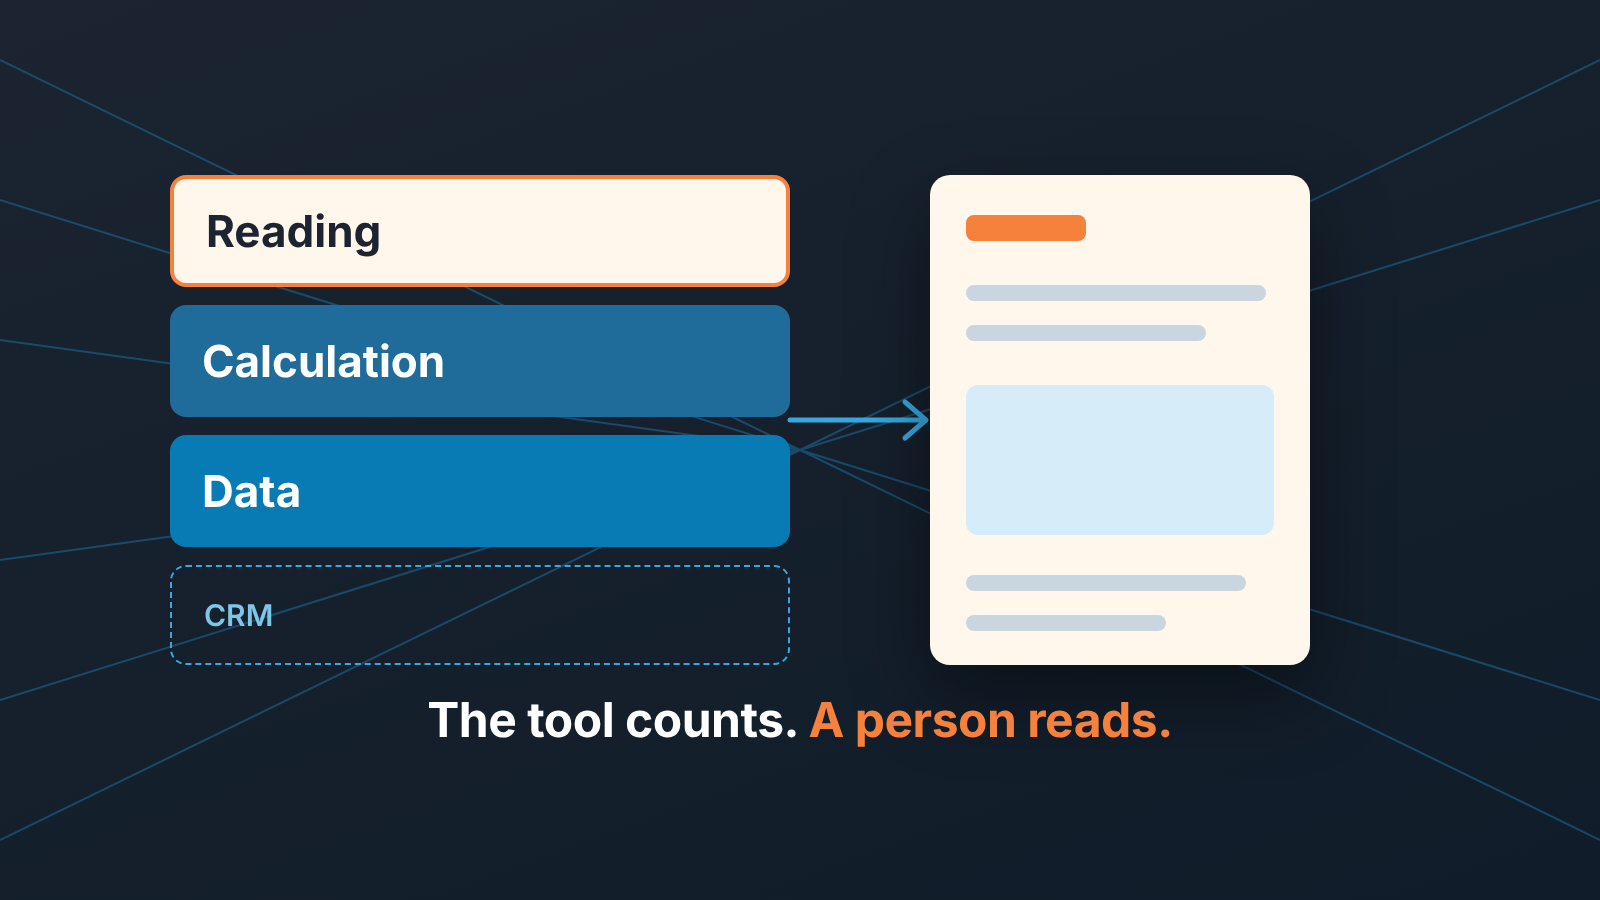
Automated sales reporting means the CRM numbers are pulled, totalled and sent on a fixed schedule, so nobody rebuilds the report by hand each week. Automate the collection, check the inputs (amounts, close dates, stages, owners) before the report goes out, and keep the reading of the numbers with a person.
One Reddit thread in the search results for this topic starts with someone who pulls data from four different tools every Friday to build a pipeline report for leadership. Those four pulls are mechanical. The time should go into what the numbers mean.
Our position is blunt: automation multiplies bad CRM data. A manual report built from a half-filled CRM is wrong once, on Friday. An automated one is wrong every Friday, in the same clean layout, and the layout is what makes it look trustworthy.
What can be automated: pulling, summing, trending, sending
Four jobs, and all four are safe to hand over.
Pulling. Reading deals, stages, amounts, owners, dates and activities from the CRM, live rather than from an export, because an export is a snapshot and someone has to remember to take it.
Summing. Open pipeline by stage, won revenue for the period, lost revenue, deals per owner. Sums and counts over filters. Nothing about them needs judgement.
Trending. The same sums compared with last week and last month. A human rebuilding the report each week rarely keeps last week’s version in the same shape, so “up or down” turns into a guess. A tool keeps the shape fixed.
Sending. A PDF or a link to the same people at the same time. If it lands on, say, Monday at 8:00, people read it before the pipeline meeting instead of during it.
What should not be: the conclusion and the decision
Say an automated report shows that the Proposal stage holds 40% of the open pipeline, up from 25% a month ago. It cannot tell you whether that is good. Maybe two large deals moved in and are on schedule. Maybe the stage is where deals wait while a rep avoids asking for a decision, and that reading calls for the opposite action.
So two things stay with a person. The conclusion: what the numbers say about this team, this month, with the context the CRM does not hold (the key account is on holiday, the price list changed, one rep is new). And the decision: what to do, who does it, by when. “Proposal stage up 15 points, three deals over 30 days in stage” is honest and complete. “Fix the Proposal stage” is a manager’s sentence, and the manager should write it.
AI summaries are fine as a reading aid, as long as the paragraph summarises the tables below it and adds no figures of its own. If the summary says something the tables do not, the summary is the one that is wrong.
Three layers of an automated report: data, calculation, reading
The simplest model we have found is three layers, with a different answer in each.
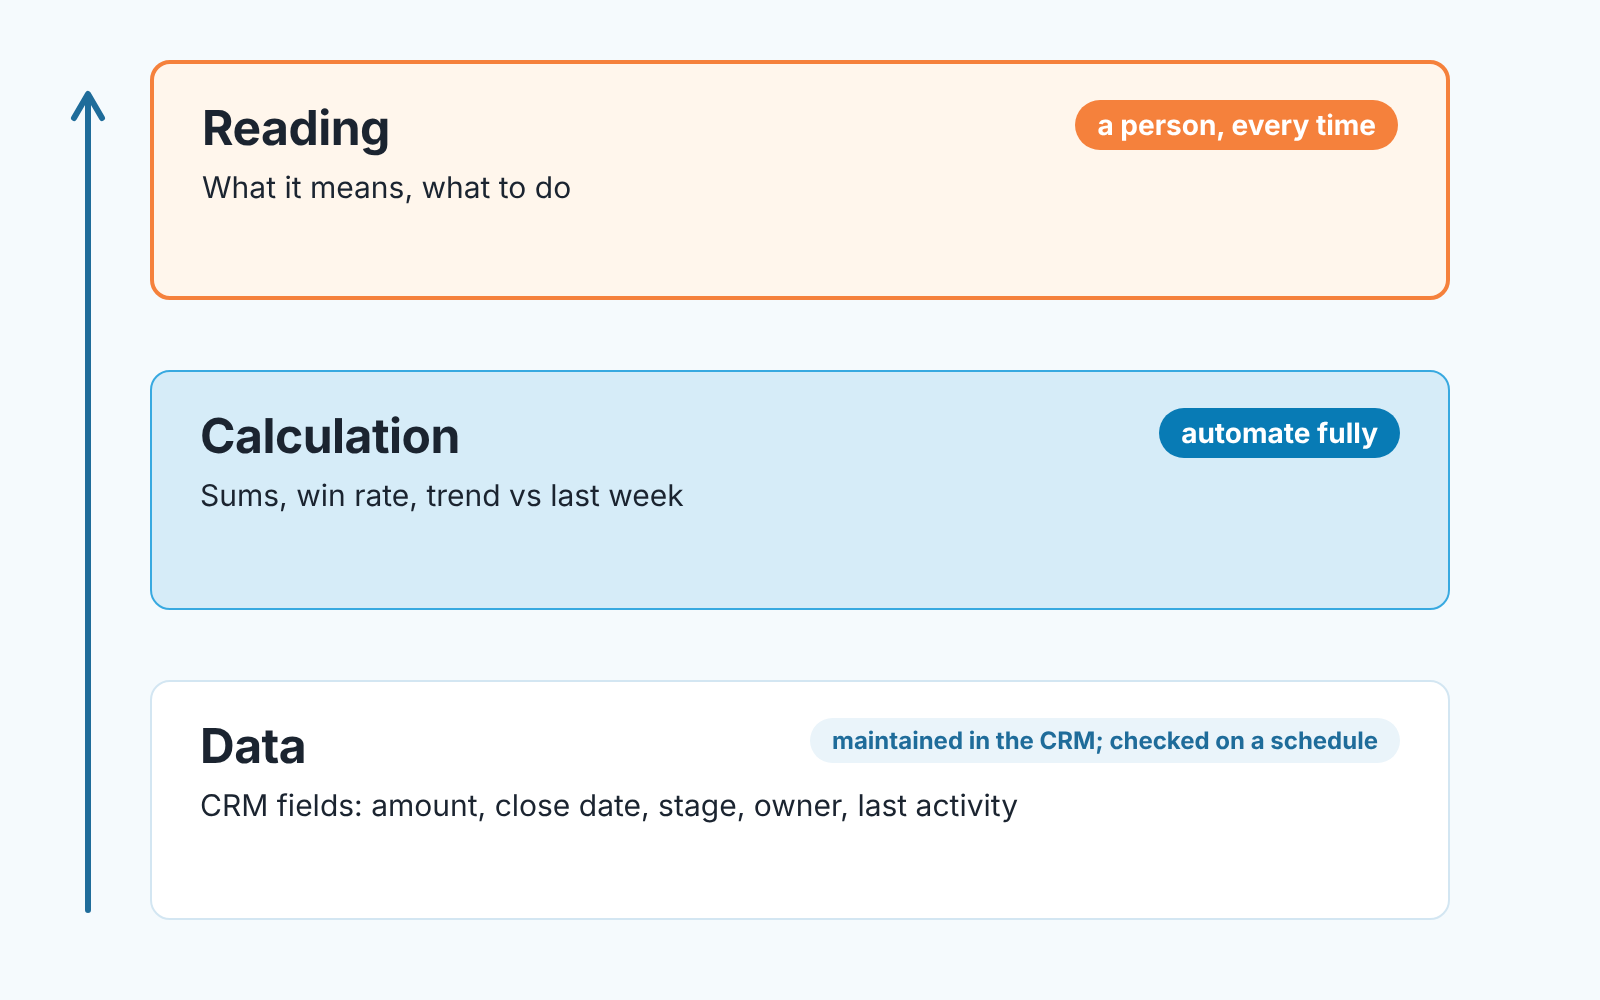
The data layer is the CRM fields the report reads: amount, expected close date, stage, owner, last and next activity, lost reason. Whoever owns the deal maintains this layer by hand, and no amount of scheduling improves it. What you can automate is the checking of it.
The calculation layer is everything from the first section. Automate all of it, and do not let anyone recalculate by hand. The moment a rep “corrects” a number in the spreadsheet after the export, you have two reports, and the one in the inbox is no longer the the one in the CRM.
The reading layer is the conclusion and the decision. A person does it every time, even if only for five minutes.
Why an automated report can be wrong
Four faults produce most of the wrong automated reports we see, and none of them throws an error. The chart looks clean and the number is false.
Empty amounts. A deal with no amount counts as zero in every sum. If a quarter of the Proposal stage has no amount, “pipeline value” is only a floor, and the trend jumps whenever someone fills a field in. Our piece on the CRM data quality metrics that break reports covers how to measure this before you trust a total.
No close date, or a stale one. A forecast by month has to put deals without a close date somewhere, usually nowhere, so they vanish from the forecast while still sitting in the pipeline. Deals whose close date is in the past do the opposite: they inflate “due this month” with things that were due in August.
Duplicates. Two deals for the same opportunity, typically one created from a web form and one by the rep. Both count. The pipeline doubles for that customer, and the win rate drops when one of them is marked lost during cleanup. If your win rate looks odd, check how lost deals and empty amounts are counted first; how we calculate win rate from CRM data goes through the traps.
Renamed or added stages. Someone renames “Negotiation” to “Contract” or inserts a stage in the middle. Last month’s numbers were grouped by the old name, this month’s by the new one, and the trend chart shows a stage that appeared from nothing. The tool did exactly what it was told.
All four get fixed in the CRM, by the owner of the deal. The report’s job is to show them: a line like “open deals without an amount: 31 of 140” (an example, not a benchmark) keeps the gap visible every week until someone closes it.
A pre-send check in five minutes
This check takes about five minutes and catches the four faults above. Before an automated report goes to the owner or into the leadership meeting, someone should open it once and run it.
- Check the period and the pipeline filter. Is it the period you think it is, and does it include every pipeline that should count (and exclude the test one)?
- Compare the open-pipeline total with the CRM’s own pipeline view for the same filter. If they differ, find out why before sending. Usually it is a deal with no amount or a stage mapping.
- Count open deals with an empty amount and with no close date. If the report does not show these counts, add them.
- Look at the stage list. A stage you do not recognise, or one that was there last week and is gone now, means someone changed the pipeline and the trend is broken for that stage.
- Sort open deals by amount and look at the top ten. Duplicates live at the top, because the biggest deals are the ones most often created twice.
- Read the summary paragraph, if the tool writes one, and check that every claim in it appears in a table below. Delete any sentence that does not.
- Write one line of your own at the top: what you want the reader to do with this.
After a month you will do steps 2, 3 and 7 and skip the rest unless something looks off. The point of the first month is to learn what your CRM gets wrong.
Automated reporting tools, by setup effort
There are four ways to get a report that builds itself. Choose by how much setup you are willing to own.
CRM built-in reports. Saved reports and a dashboard, often with scheduled sending. Setup is low. The limit is that they report what the CRM stores and say nothing about whether it is stored well; an empty amount is just a zero. For Pipedrive teams we have written up which Pipedrive reports show pipeline health and how to read a pipeline movement report.
Spreadsheets fed by an export or a connector. More flexible: you can add the “deals without amount” column yourself. The cost is that someone owns the sheet, and the sheet breaks when a stage is renamed or a column moves.
BI tools (Power BI, Looker Studio and the like). The most flexible and the most work: real trend history, any calculation you like, and a data model only its builder can change. Worth it when you already have an analyst.
A report that comes ready: a tool connects to the CRM and produces a fixed-format report with data-quality checks built in. Least setup, least flexibility. This is the category we build in, and we leave the four unranked, because each works only as well as the person who maintains it.
What goes in, and how often
Automate the sections whose numbers come straight from fields, and leave out any section that needs a sentence of explanation to be useful, because nobody will write that sentence on a schedule. Rep commission reports follow the same rule: a flat rate on closed-won amount comes straight from fields and automates well, and splits, accelerators or clawbacks need a person to check each payout before it goes out. The full section list is in what to put in a sales report built from the CRM, and the cuts are in what to include in a weekly sales report and what to drop.
On frequency: weekly for the head of sales and the team, monthly for the owner, daily only for a rep’s own deals. Fix the day and the hour and never move them, the value of an automatic report is that it is boringly predictable. Who needs which report is in the report set for an owner and a head of sales and the KPI report for a business owner.
How CRM Report builds the weekly PDF
Disclosure first: we build SalesBond, a sales management layer on top of the CRM a team already uses; we started with Pipedrive. One of its products is CRM Report, our answer to the report that comes ready, so read this section as a vendor describing its own tool.
CRM Report starts as a free CRM audit. SalesBond reads the last 30 days of the connected CRM and produces a large PDF: money at risk, a CRM score with five sub-scores, the top three findings, managers, deal health, the pipeline bottleneck, repeat customers, top-10 clients, and up to five “what to fix” cards sorted by money. Seven days later a second PDF arrives with what changed, and after that the report stays weekly.
Three things about it map onto this article. The numbers are deterministic; AI writes only the summary text and stage-name suggestions, so the summary stays tied to the tables. The report includes a review of pipelines and stage naming, so renamed and odd stages come up as a finding instead of silently breaking a trend. And deal health is one of its sections, so the state of open deals is in front of you every week rather than buried in the CRM.
It does not fix the data either. The “what to fix” cards say what to fix; a person opens teh CRM and does it.
If you want to see what your own CRM looks like through this lens, check your CRM with SalesBond. SalesBond works with Pipedrive, HubSpot, Salesforce, Zoho CRM, Microsoft Dynamics 365, Freshsales, Close, monday CRM, Copper, Zendesk Sell, Nutshell, Insightly, Attio, Bitrix24 and Kommo (amoCRM).
FAQ
What does it mean to automate a report? The tool reads the CRM, runs the same calculations and sends the report on a schedule, so nobody rebuilds it by hand. The inputs still have to be checked, and a person still reads the result.
How do I create an automated sales report? Pick the source (which pipelines), fix the calculations (open pipeline by stage, won in period, win rate, trend versus last period), add the two data-quality lines (deals without amount, deals without close date), choose a tool from the four above, and set a fixed day and hour. Run the five-minute check for the first month before you let it go out unread.
What is the best sales reporting software? We do not rank tools, and we build one, so take that with the usual caution. The useful question is which setup effort you can own and keep running for the next six months.
Can I automate the whole sales process, or only the report? Reporting is the safest part to automate because it changes nothing in the CRM. Automations that move deals, create tasks or send emails on their own are a different risk: a wrong rule acts on real customers. Start with the report, learn what your data gets wrong, and automate actions only where the rule is simple enough to explain to a rep in one sentence.