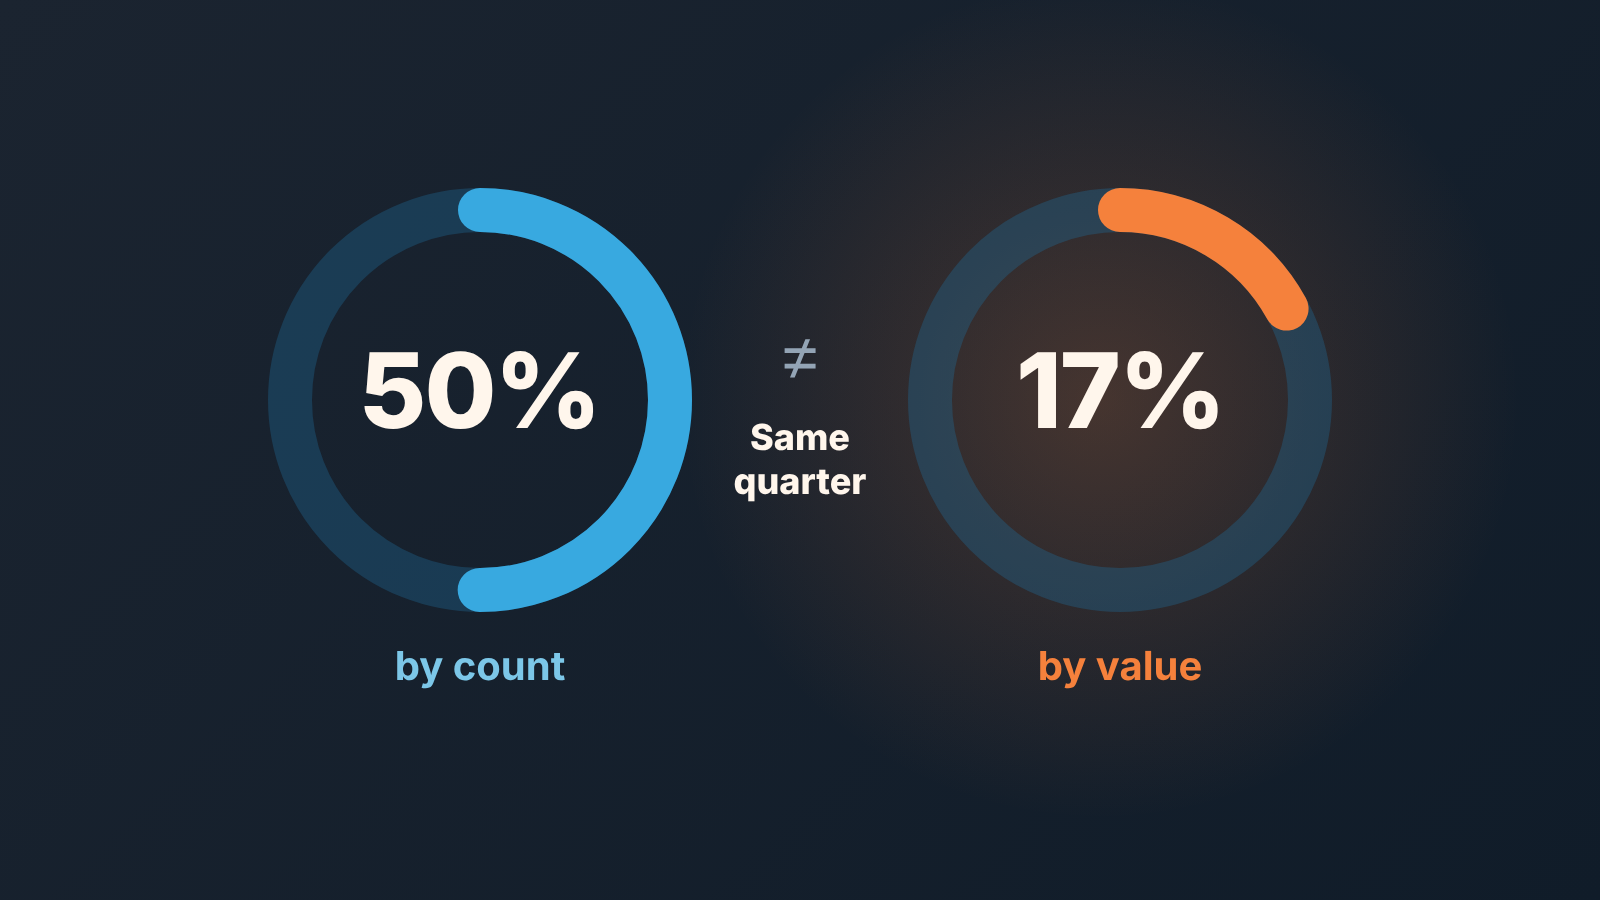
Win rate is the share of deals you closed won out of the deals that reached a final outcome in the period, Win rate = won deals / (won deals + lost deals) × 100, counted by number of deals or by their value. The number is only as honest as the CRM behind it: deals lost without a reason, deals without an amount and old open deals all change it.
Learning to calculate win rate takes a minute. What takes longer is noticing that a few habits in the CRM, from empty amounts and open deals nobody will close to duplicates and outcomes typed into a quarter you already reported, move the number more than anything the team did that quarter.
How to calculate win rate: by count and by value
By count, Win rate = deals won / (deals won + deals lost) × 100. By value, Win rate by value = amount won / (amount won + amount lost) × 100. Same period, same pipelines, same definition of “closed” in both.
By count tells you how often the team wins. By value tells you how much of the money on the table the team took. They rarely agree, and the gap is information.
Take an invented quarter, numbers chosen to make the point. The team closed 20 deals: 10 won, 10 lost. Win rate by count is 50%. The ten wins were small, $5,000 each, $50,000 together. Two of the losses were $100,000 each and the other eight were $5,000, so closed value is $290,000 and win rate by value is $50,000 / $290,000 × 100, about 17%.
Same team, same quarter, 50% or 17%, and both are correct. The team closes half of what it touches and loses the deals that carry most of the money.
Report only by count and nobody sees that. Report only by value and two big losses hide a team doing fine on its core business. We show both side by side and make the gap a question at the pipeline review. Splitting by deal size usually explains it: if, to stay with made-up numbers, win rate is 50% under $10,000 and 10% above $50,000, the conversation moves from “we need to win more” to “we need to win large deals, or stop chasing them”. For cuts by rep and source, our Pipedrive win rate walkthrough goes further.
The by-value version needs an amount on every closed deal, and that is where the number usually breaks first.
What goes in the denominator: won, lost, open, no decision
The denominator is deals won plus deals lost in the period, with nothing else added and neither side left out.
Win rate is a question about outcomes, so the denominator holds only deals that have one. Put open deals in and the number drops every time a rep creates a deal and rises every time one is cleaned out, which has nothing to do with winning. Some win rate calculators, and Breakcold’s comparison of win rate and win-loss ratio, divide wins by all opportunities instead. That is a fine number to know, but it measures how much of what entered the pipeline ever became a customer. Call it opportunity-to-win conversion and keep it separate; our piece on which sales conversion rate to track covers that family.
The same Breakcold page defines win-loss ratio as wins divided by losses. Ten wins and ten losses make a 50% win rate and a 1:1 ratio, and the ratio hides how many deals were played, so we report win rate with the counts next to it.
“No decision” is the hard case. The buyer never said no; they went quiet, the budget vanished, the project was shelved. Some teams leave those deals open forever, which is bad, or delete them, which is worse, because now the deal never happened. Our position: a deal where the buyer stopped responding is a lost deal with the reason “no decision”, and it stays in the denominator. You spent the time and did not get the customer. Take it out and win rate becomes a measure of how you perform against buyers polite enough to answer, which flatters the team and explains nothing.
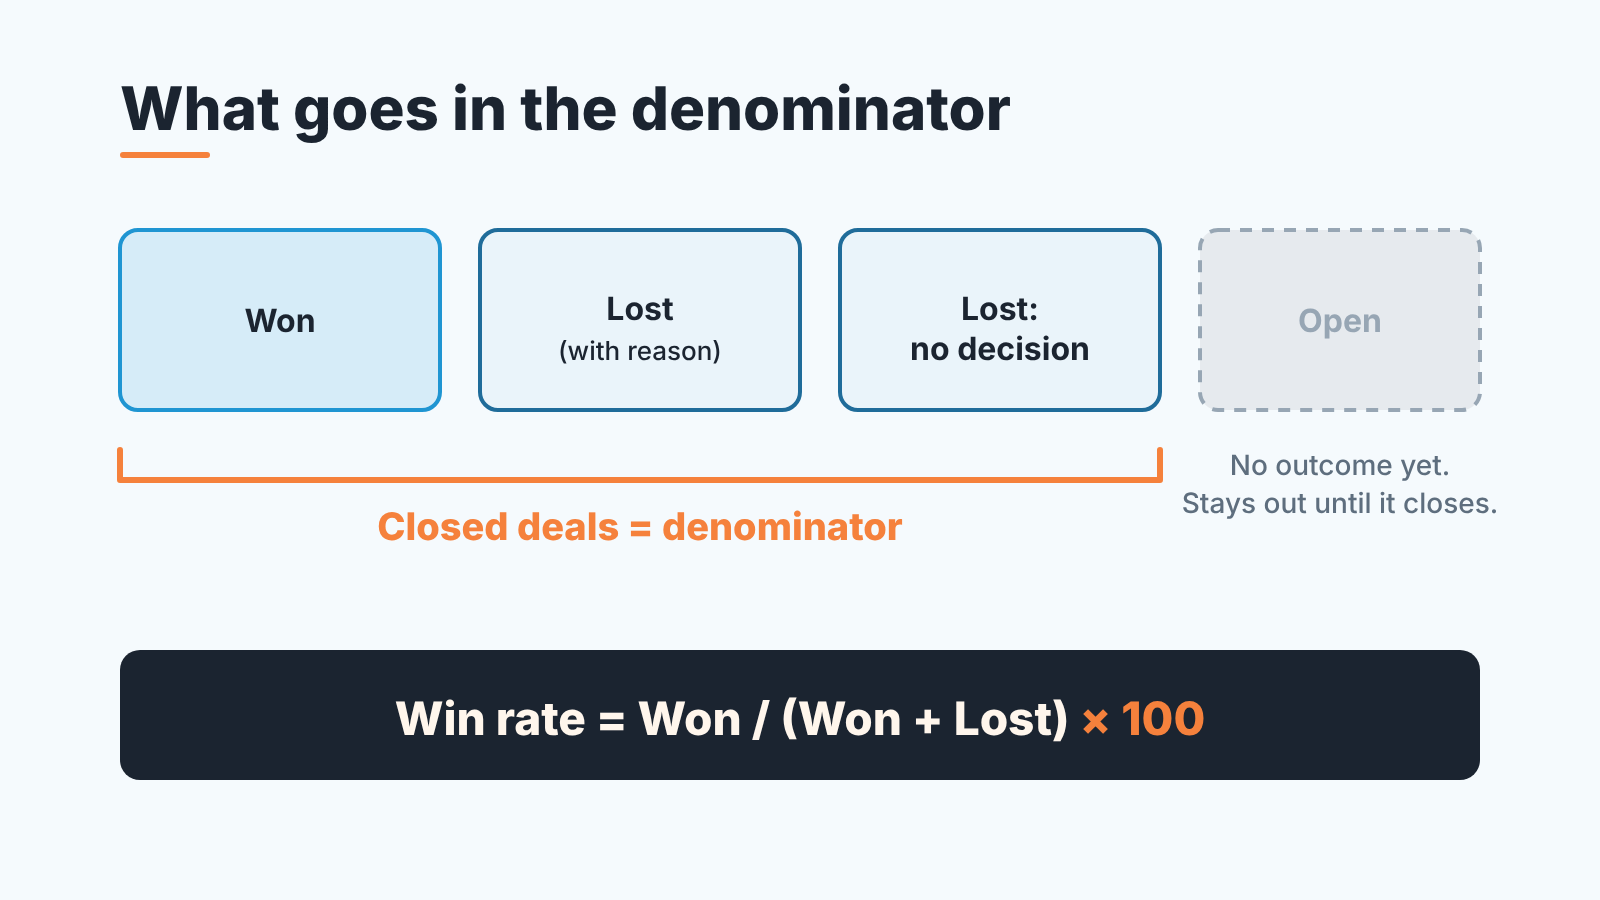
Which period? The one the deal closed in. A deal created in March and won in June belongs to June. What became of March’s deals is a cohort question and a separate report.
Is 30% a good win rate? What a benchmark can and cannot tell you
Thirty percent is a good win rate if last quarter was 22% and the denominator rule did not change. That is the only honest answer we have.
Benchmarks in search results average companies that define the metric differently: closed deals only, every opportunity created, with or without “no decision”, by count or by value. On the same CRM those definitions can land far apart (the same closed deals can read 50% by count and 17% by value), so an industry average of them says little about your 30%. We are not publishing benchmark figures here because we have not verified how each source counted.
A benchmark can still tell you when you are wildly off. A win rate by count of 5% means something upstream is wrong: qualification, lead source, or what you call a “deal”. At 90% you are probably creating deals only after the buyer has said yes, which makes the pipeline useless for forecasting. Between those edges your own history is the benchmark. Write the rule down (“closed deals in the period, won plus lost, no decision counted as lost, by close date”), put it in the footer of the report, and when the number moves, check the rule first and the team second.
Five habits that move the number more than your team does
The formula stays fixed, and the inputs come from reps closing deals on a Friday afternoon.
Lost deals with no reason are the first. The lost reason is empty, or “Other” is the most common one. It moves the number slowly. When win rate drops and someone asks why, the honest answer is “we don’t know”, so the cause stays in place and the next quarter repeats it. Make the reason required when a deal is marked lost and keep the list short enough that reps pick a real one. Pipedrive teams can start with how lost reasons work in Pipedrive, HubSpot teams with the closed lost reason property.
Empty amounts are the quiet one. By value, every closed deal with no amount drops out of both numerator and denominator, and the report still prints a confident percentage. Reps leave the amount blank on deals they are losing, because there was never a quote, so the value-based win rate ends up computed mostly from the the deals you won. The result flatters the quarter. Require an amount before a deal can be won or lost, and backfill the last two quarters.
Then there are the old open deals nobody will close: months past the expected close date, last activity long ago. They are not in the denominator yet, so win rate reads higher than it is, right up to the day someone cleans them out.
Duplicates cut both ways. The same company arriving through two channels becomes two records, often with the same amount; a won duplicate doubles a win, a lost one doubles a loss. Merge before you report.
The last one rewrites a number you already reported. A deal gets its outcome after the fact, with a close date in a quarter you already presented, and last quarter’s number changes after the meeting. Agree that reported periods are closed, and if a correction has to go in, say so in the next report.
A one-hour check of your own CRM
You do not need a tool for this. You need a filter, a spreadsheet and an hour before the next pipeline review.
Pull every deal closed in the last full quarter, won and lost, with four columns: outcome, amount, lost reason, close date. Count the rows and write the count down before you look at anything else, because the next steps will make you want to change it.
Sort the lost deals by reason. If the top entry is blank or “Other”, note its share. Our rule of thumb is that above a quarter of the losses the reasons can’t carry a conversation about why you lose, and the fix is a shorter required list.
Filter closed deals to empty or zero amount and split by outcome. Empties mostly on the lost side mean your by-value win rate is inflated and the report should say so until the amounts are backfilled. Empties spread evenly make the number noisy but not biased, a smaller problem.
Now the open deals. We use an expected close date more than 60 days in the past, or no activity for a month, as the cutoff; pick your own, as long as it stays the same from quarter to quarter. These deals will lower the win rate the day someone marks them lost, and someone eventually will. So decide now, rather than in the quarter when a new manager cleans up and the number collapses. Bring the list to the review with one question per deal: is this alive?
Then recompute, by count and by value, once from the closed deals and once with the stale open deals counted as lost. The gap is how much of your win rate is deferred bad news. We have seen it turn a comfortable number into a problem the owner should have heard about two quarters earlier.
Report setup differs by CRM, we have walkthroughs for Pipedrive, HubSpot, Salesforce and Zoho CRM, and a piece on running a win-loss review in a small team once the reasons are clean enough to read.
How SalesBond keeps the inputs clean
We build SalesBond, a sales management layer on top of the CRM a team already uses, and the inputs above are what we watch all day.
Deal Health checks every deal in the connected CRM against more than 20 rules in six categories, Data and Progression among them, and shows each violation with a recommended action. Whoever handles a violation can resolve, snooze or ignore it, and thresholds are configurable. A rep sees thier own deals, a manager the team’s.
None of this fixes the CRM on its own, and SalesBond does not create tasks in the CRM without a person accepting them. It points at the deals that would corrupt the win rate before they close, when the fix is cheap. The Sales Dashboard then gives the head of sales a Team Performance tab with per-rep execution, so the number can be read rep by rep.
The quickest way to see where your own CRM stands is the free CRM audit. SalesBond looks at the last 30 days of the connected CRM and sends a PDF report: money at risk, a CRM score, the top three findings, deal health, and up to five things to fix, sorted by money. Seven days later a second PDF shows what changed. Check your CRM with SalesBond and read the deal health part before you trust the win rate. SalesBond works with Pipedrive, HubSpot, Salesforce, Zoho CRM, Microsoft Dynamics 365, Freshsales, Close, monday CRM, Copper, Zendesk Sell, Nutshell, Insightly, Attio, Bitrix24 and Kommo (amoCRM). The wider set of fields that break reports is in CRM data quality metrics, and the score itself in the deal health score explainer.
Before the next review, run the one-hour check and put both numbers on the slide, the one from closed deals and the one with the stale deals counted as lost. If you would rather have the empty amounts and missing reasons counted for you, sign up for SalesBond and start with the free CRM audit.