
RFM analysis ranks customers by recency (days since the last purchase), frequency (how many purchases) and monetary value (how much they spent). Each customer gets a score of 1 to 5 on each of the three, and the three digits together sort the base into groups you can act on. In B2B, measure recency against each customer’s own buying cycle: 90 days of silence means something different for a customer who buys every four months than for one who buys every year.
The RFM model was built for online stores and email lists (TechTarget’s definition is a fair summary). A sales team needs two changes to the ordinary version, recency measured against each customer’s buying cycle and segments that end in calls.
Recency, frequency, monetary: what each one is in a B2B CRM
A purchase is a won deal. If your team keeps one deal per customer and reopens it for every order, you have no purchase history and no RFM. The fix is in repeat orders in Pipedrive: one new deal per order; the logic is the same in any CRM.
With one won deal per order, the three signals come from three fields:
- Recency is today minus the close date of the customer’s most recent won deal, in days.
- Frequency is the count of won deals in a window you choose. We use 24 months for reorder businesses, because 12 months throws away too many customers whose cycle is close to a year.
- Monetary is the sum of won deal values in the same window. Only money that was invoiced counts, so leave out the open pipeline and the quoted amount.
Group by organization. A plant with three buyers is one customer with one buying rhythm.
The RFM score: 1 to 5 from a CRM export
Export won deals with four columns: organization, close date, value, owner. Build a pivot by organization with last close date, count and sum. Then score each column 1 to 5.
The textbook way is quintiles: the freshest fifth gets a 5, the next fifth a 4, and so on. With forty customers that gives bands of eight that shift every time a deal closes. For a small base though we prefer fixed thresholds you set once and can explain to the team.
Take a made-up base of six customers (the figures are illustrative and made up) and score it with fixed bands. Recency: 5 up to 45 days, 4 up to 90, 3 up to 180, 2 up to a year, 1 beyond. Frequency: 1 for a single deal, then 2, 3, 4 and 5 from 2, 4, 7 and 11 deals. Monetary: 1 under $10k, then 2, 3, 4 and 5 from $10k, $20k, $40k and $80k.
Alder Logistics (9 deals, $54,000, last order 30 days ago) comes out 544. Dune Foods (9 deals, $96,000, silent for 200 days) is 245. Fir Hotels is 522, Elm Labs 111. Birch Dental and Cedar Print, both last seen 95 days ago, get 332 and 334.
By the standard playbook Alder is a champion, Fir a promising newcomer, Dune a big account that is slipping, Elm lost, and Birch and Cedar sit in the middle with the same R. Two of those readings are wrong, and the scores cannot show you which.
Why plain recency misleads when customers buy at different rhythms
In a store, every customer runs on the same clock, so one recency scale is fair. In B2B the clock belongs to the customer.
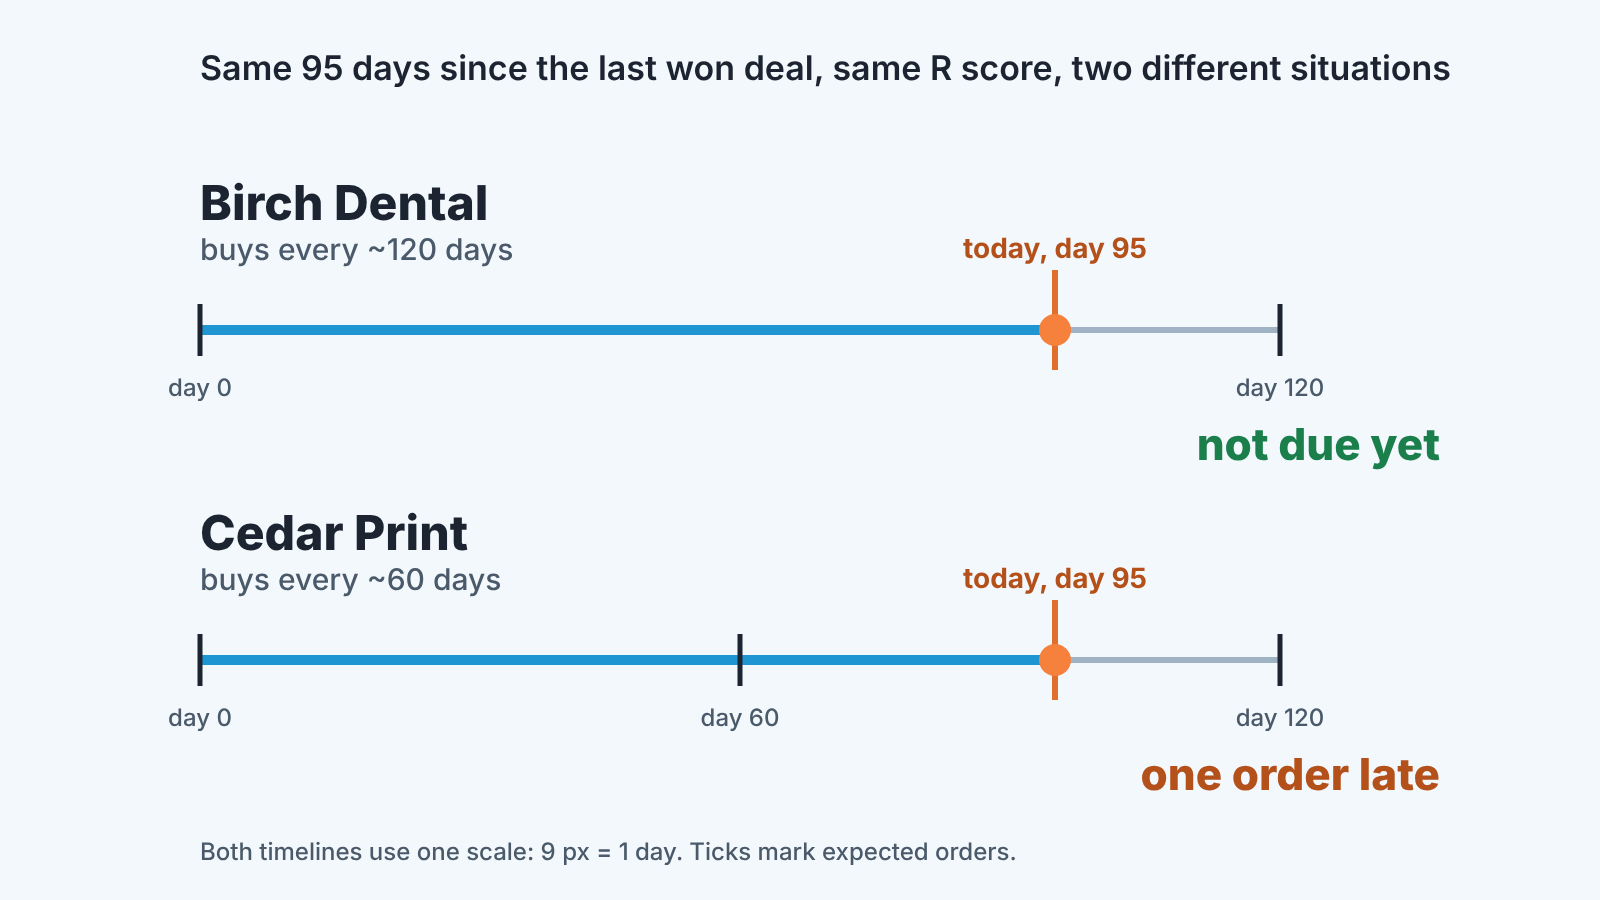
Birch Dental buys roughly every 120 days. At day 95 the next order is not due, and a discount now is money handed to someone who was going to order anyway.
Cedar Print buys roughly every 60 days, so at day 95 they are more than a month late. Something has changed there: a new supplier, a frozen budget, a contact who left. Both got R = 3.
Dune Foods is worse. Their usual gap is 60 days and they have been quiet for 200, which means three missed orders in a row. Plain RFM says “at risk, send a win-back offer”. By their own rhythm they have most likely moved the business, and they are the largest account in the base.
Recency against the buying cycle: a better R for reorder business
Cycle-adjusted recency is days since the last won deal divided by the median gap between the customer’s won deals. The median needs at least two deals. Under 1 means the next order is not due yet, 1 means it is due today, 2 means two cycles have passed. The ratio, its thresholds and the statuses it produces are covered in account management by customer status; here it is applied to the same six customers.
| Customer | Days since last won deal | Won deals, 24 mo | Revenue, 24 mo | Median gap, days | Ratio | R by days | R by cycle |
|---|---|---|---|---|---|---|---|
| Alder Logistics | 30 | 9 | $54,000 | 80 | 0.4 | 5 | 5 |
| Birch Dental | 95 | 6 | $18,000 | 120 | 0.8 | 3 | 4 |
| Cedar Print | 95 | 4 | $41,000 | 60 | 1.6 | 3 | 2 |
| Dune Foods | 200 | 9 | $96,000 | 60 | 3.3 | 2 | 1 |
| Elm Labs | 400 | 1 | $7,000 | n/a | n/a | 1 | not scored |
| Fir Hotels | 45 | 3 | $12,000 | 100 | 0.45 | 5 | 5 |
The cycle bands are on the ratio: up to 0.5 is a 5, up to 1.0 a 4, up to 1.5 a 3, up to 2.0 a 2, above that a 1. Set your own; what matters is that they count cycles.
Birch moves up: leave them alone until about day 110, then call to confirm the order. Cedar drops to a 2, so call this week and find out what changed. Dune, the biggest account in the base, becomes a 1 and the first call on Monday morning, with the head of sales on the line.
Elm Labs drops out: one purchase gives no interval. And trust the median only as far as the data behind it. Two deals give one interval, which is a guess; five or six give a number you can plan on.
RFM segments as call lists, not mailing lists
Marketing RFM ends with names like champions, loyal, at risk, hibernating, and the actions attached to them are campaigns. A sales team makes calls.
Most guides to customer segmentation sort the types into demographic, geographic, psychographic and behavioral, with needs-based as a common fifth (TechTarget lists all five). RFM is behavioral segmentation, the kind that comes straight out of the CRM and changes every week. For a sales team it becomes four lists.
Call this week. High F or high M, R by cycle of 1 or 2: customers who used to order regularly and have missed at least one order. In the table, Dune and Cedar. The call opens with a question: “we noticed you usually order around now; is anything different on your side?” The rep logs the reason, which is the data you will want in six months.
Leave alone, and thank the best. R by cycle of 4 or 5: Alder, Fir, Birch. Calling to “check in” spends a favor you will want later. Put the expected next order date in the CRM as an activity and call a week before it. Alder also earns a thank-you call, and the question to ask is “who else should we be talking to?” Leave discount offers out of that call.
Second order due. F = 1 and past your usual first-reorder window. New customers have no cycle of thier own, so borrow the median first-to-second interval across your base. More on this group in customer retention strategies for late reorders.
Let go. Low F, low M, ratio above 2. One email, then stop spending rep time on them.
What RFM cannot tell you
It cannot tell you why they stopped. A ratio of 3.3 says Dune has missed three orders; it does not say whether the buyer changed jobs, the plant closed a line or a competitor undercut you. Only the call does, which is why the call is the output and the score is just the input .
It is fooled by a single large deal. One installation project worth a year of consumables pushes M to 5, when the monthly consumables are the actual relationship. If you sell both, score M on reorder revenue only.
It has nothing to say about one-off customers. A company that bought a fit-out once and will not need another for ten years is not “hibernating”; ask them for a referral. Mark such deals with a deal type and exclude them before scoring.
And it is quiet about the open pipeline. A customer at 1.6 with a proposal under review this week is late on paper and fine in reality. Check open deals before you build the list.
RFM, LTV and the status view: three looks at the same won deals
Historical LTV is the sum of a customer’s won deals since the first one: what an account has been worth, and with the average order value, what a missed order costs (customer lifetime value: the historical LTV in your CRM). The status view asks where one customer stands against their own cycle today. RFM ranks the whole base at once: “of 300 customers and two reps, which 20 do we call this week?”
So use LTV to size the money, the status to time the the call and RFM to order the list. Cohort analysis is a different tool again: it groups customers by the month of their first purchase and follows each group over time, which makes it a tool for the quarterly review.
Already keep a customer health score in a spreadsheet, as in customer health score in Pipedrive or HubSpot customer health score? The cycle-adjusted R is the one column we would add.
How Repeat Sales shows the same three signals
We build SalesBond, a sales management layer on top of the CRM a team already uses; we started with Pipedrive. It works with Pipedrive, HubSpot, Salesforce, Zoho CRM, Microsoft Dynamics 365, Freshsales, Close, monday CRM, Copper, Zendesk Sell, Nutshell, Insightly, Attio, Bitrix24 and Kommo (amoCRM). Repeat Sales, the part for repeat business, does the arithmetic of this article. It treats a won deal as a purchase and computes each customer’s buying cycle as the median interval between purchases, with a cycle confidence of high, medium or low. Days since the last purchase divided by that cycle gives each customer a status, on track, overdue or leaving, with configurable thresholds; an overdue customer with an open deal and recent contact shows as in work, a customer on track whose next purchase is close is flagged purchase soon, a customer with one purchase shows as new, and one with no determinable cycle as undefined. Per customer it shows historical LTV, average order value and the expected next purchase, computed per customer and seller, so a manager sees which rep is behind a late account.
It does not score anyone 1 to 5 and has no RFM segments; the call lists you build yourself, from its Health section or your own table.
The quickest way to see whether your base has a reorder pattern is the free CRM audit. SalesBond looks at the last 30 days of your connected CRM and sends a PDF report, with repeat customers and top-10 clients among its sections; seven days later a second PDF shows what changed. Check your CRM with SalesBond.
Start with the export, though. Four columns and an afternoon will tell you whether Dune Foods lives in your CRM too. If it does, and the spreadsheet proves the pattern, the next step is to stop rebuilding it every Monday: Start with SalesBond.


