
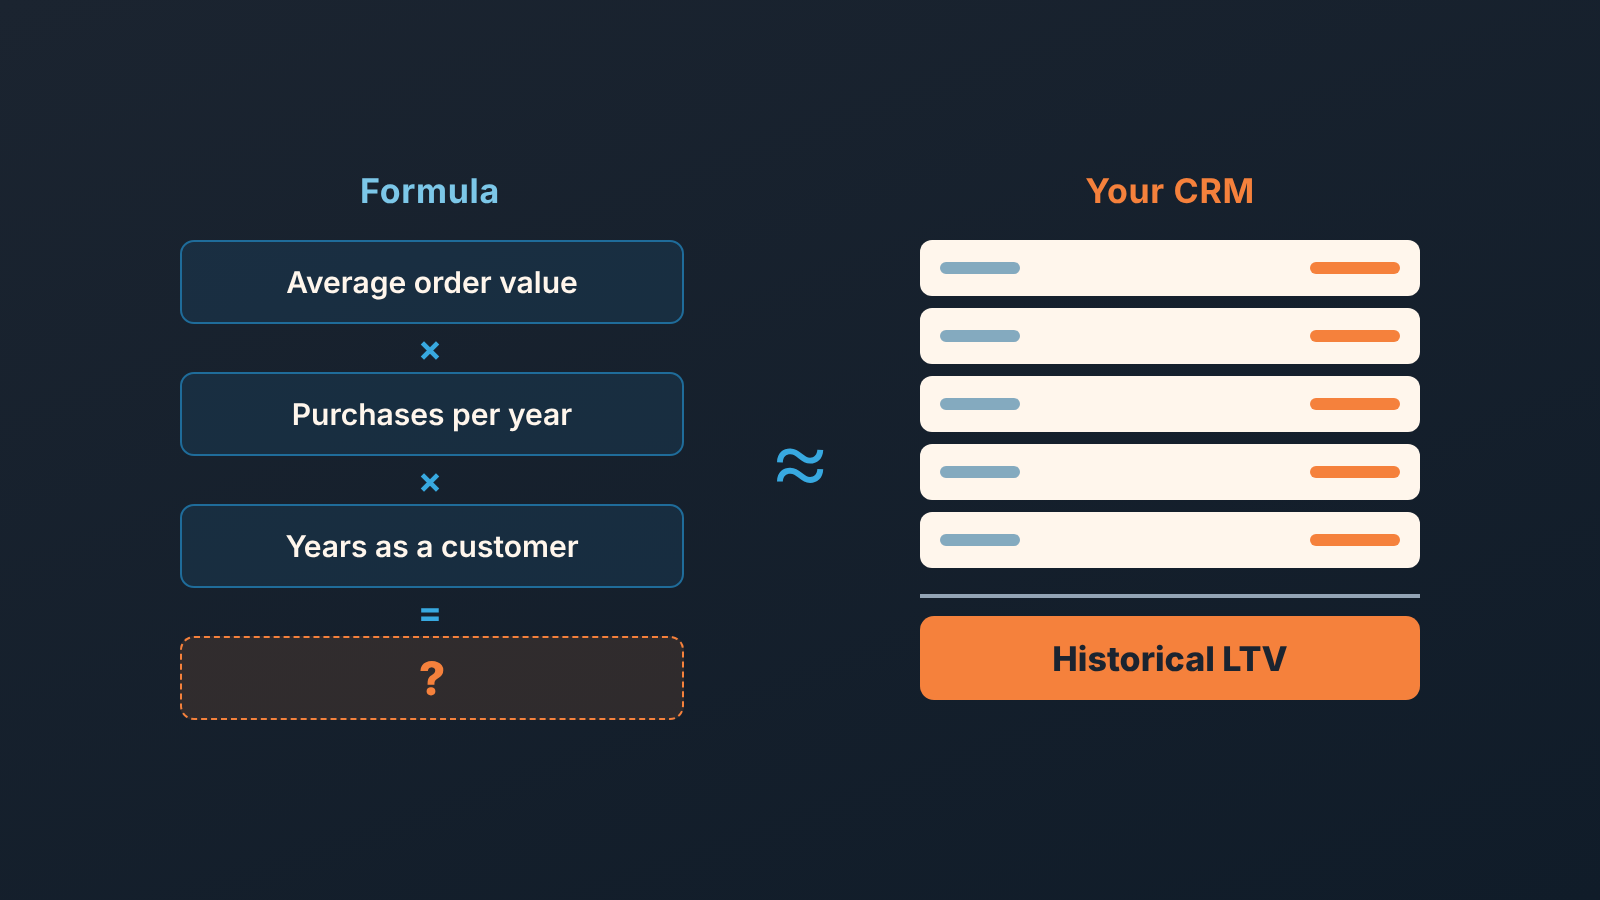
Customer lifetime value (CLV, or LTV) is the total revenue, or gross profit, a customer brings over the whole relationship with you. The simplest way to calculate it is average order value times the number of purchases a customer makes (purchase frequency × lifespan). If you sell repeat orders and track deals in a CRM, you can skip the guess: add up the deals each customer has actually won, and you have their historical LTV, today, without a single assumption.
In a spreadsheet such as Excel the simple formula is one cell: with average order value in B2, purchases per year in C2 and lifespan in years in D2, CLV is =B2*C2*D2. Calculators stop at that figure, and a head of sales also needs the list of real customers with their real LTV.
The customer lifetime value formula, simple version
Three numbers, multiplied:
CLV = average order value × purchase frequency × average customer lifespan
Shopify’s guide gives the same formula and one rule people skip: keep the periods consistent, so annual purchase frequency goes with a lifespan measured in years (Shopify: Customer Lifetime Value: How To Calculate CLV). If you track churn rather than lifespan, average customer lifespan is 1 / churn rate for the same period, so 5% monthly churn means a lifespan of about 20 months.
A made-up example. A packaging supplier’s typical customer orders $2,000 of material, four times a year, and stays for three years. CLV = $2,000 × 4 × 3 = $24,000. Every number here is invented.
That is enough when you need one planning figure for the whole customer base: how much you can afford to spend to win a customer, or whether a new channel pays back. It also works when purchases really are regular, as in consumables, subscriptions and most e-commerce. The inputs then come from your own history, and the output is a fair average.
What it will never tell you is which customer is worth $24,000 and which one is worth $4,000. An average hides exactly the thing a sales manager needs.
The margin and retention versions: what you must know before using them
Both refinements you will find in nearly every guide need a number sales does not have.
Margin-adjusted CLV multiplies the revenue version by gross margin, entered as a decimal. For the supplier above, at an invented 35% margin: $24,000 × 0.35 = $8,400 of gross profit per customer. Gross margin lives in finance, outside the CRM. Ask for one blended number and write down the date you got it.
The retention version replaces lifespan with a retention rate and discounts future money:
CLV = (gross profit per customer per period × retention rate) / (1 + discount rate − retention rate)
Discounting future money is the idea behind net present value.
Shopify states it with its assumptions: constant gross profit, retention and discount rates over an ongoing relationship, value counted after the first purchase, acquisition costs excluded (Shopify). Invented numbers again: $2,800 of annual gross profit per customer, a retention rate of 0.8 and a discount rate of 0.1 give $2,800 × 0.8 / (1 + 0.1 − 0.8) = $2,240 / 0.3, roughly $7,470.
To use it honestly you need a retention rate measured over the same period as the profit figure, a discount rate (ask finance, nobody in sales keeps one), and a belief that retention will stay where it is. That last one is the weak point for the teams we work with.
Where the formulas break for B2B teams with irregular reorders
Picture a distributor, an invented one, with 60 active accounts. Eight order every month. A dozen order twice a year for a seasonal run. One bought in 2022, went quiet, and came back last spring with the biggest order of the year. What is this team’s “average customer lifespan”? You only know a lifespan once the customer has left, and in B2B nobody announces that they left. They stop answering, and a year later someone notices.
Retention rate has teh same problem from the other side. To count retention you have to pick a period, and a customer who orders every nine months is churned in any quarterly calculation and perfectly retained in any annual one. The number moves more with the period you chose than with anything your customers did.
So for a team like this the formula returns a planning figure that partly reflects its own assumptions. We think that figure serves finance well and gives sales management nothing to act on, because a manager calls customers one at a time and needs one row per customer. Your CRM already holds everything that goes in it.
Historical LTV: add up what the customer actually bought
Historical LTV for one customer is the sum of all their won deals, in one currency. No lifespan, no retention rate, only what was bought up to today.
Any CRM can produce it if the data is set up a particular way, and this is where most teams hit their first problem. Four things have to be true:
- Every order is its own deal, linked to the account (organization or company) as well as to a contact person. A customer with eleven orders under three different contacts is three customers to your report. We wrote up the one-deal-per-order setup for Pipedrive teams in repeat orders in Pipedrive: one deal per order; the logic is the same in any CRM.
- Won deals have a value and a won date. A won deal with an empty value is a zero in your sum.
- One currency, or a conversion at the won date.
- You know whose deals you can see. A report that covers only your own team shows your team’s LTV for the customer, which may not be the whole company’s.
With that in place the report is a won-deals report grouped by account, with a sum of deal value, a count of deals and the earliest won date. In a spreadsheet export it is a pivot table with the account in the rows, or one SUMIFS formula per account that adds deal value where the status is won.
Here is a customer lifetime value example with the formula next to the fact, every number invented. Northfield Foods: $24,000 by formula, $31,500 in historical LTV from 14 won deals since March 2023. Carter & Vale: the same $24,000 by formula, $9,800 in fact from five deals since January 2025. Hollis Print: $24,000 again, and $4,000 from two deals since November 2024. The formula gives all three the same number because it is an average, and only the historical figure tells you which account to call first.
Two limits. Historical LTV is revenue; it becomes profit only if your CRM carries a margin field. And credit notes or refunds usually live in accounting, outside the deal.
Three numbers that belong next to LTV
A total on its own invites the wrong conclusion. Northfield’s $31,500 spread over more than three years and $31,500 from a single deal are different customers.
Start with average order value per customer: historical LTV divided by the number of won deals. Northfield’s is $2,250, Hollis Print’s is $2,000. Per customer, average order value also opens a conversation (“your last three orders were smaller, what changed?”).
The first purchase date is the won date of the earliest won deal. LTV per year of relationship often says more than LTV itself, and this date is what makes it possible.
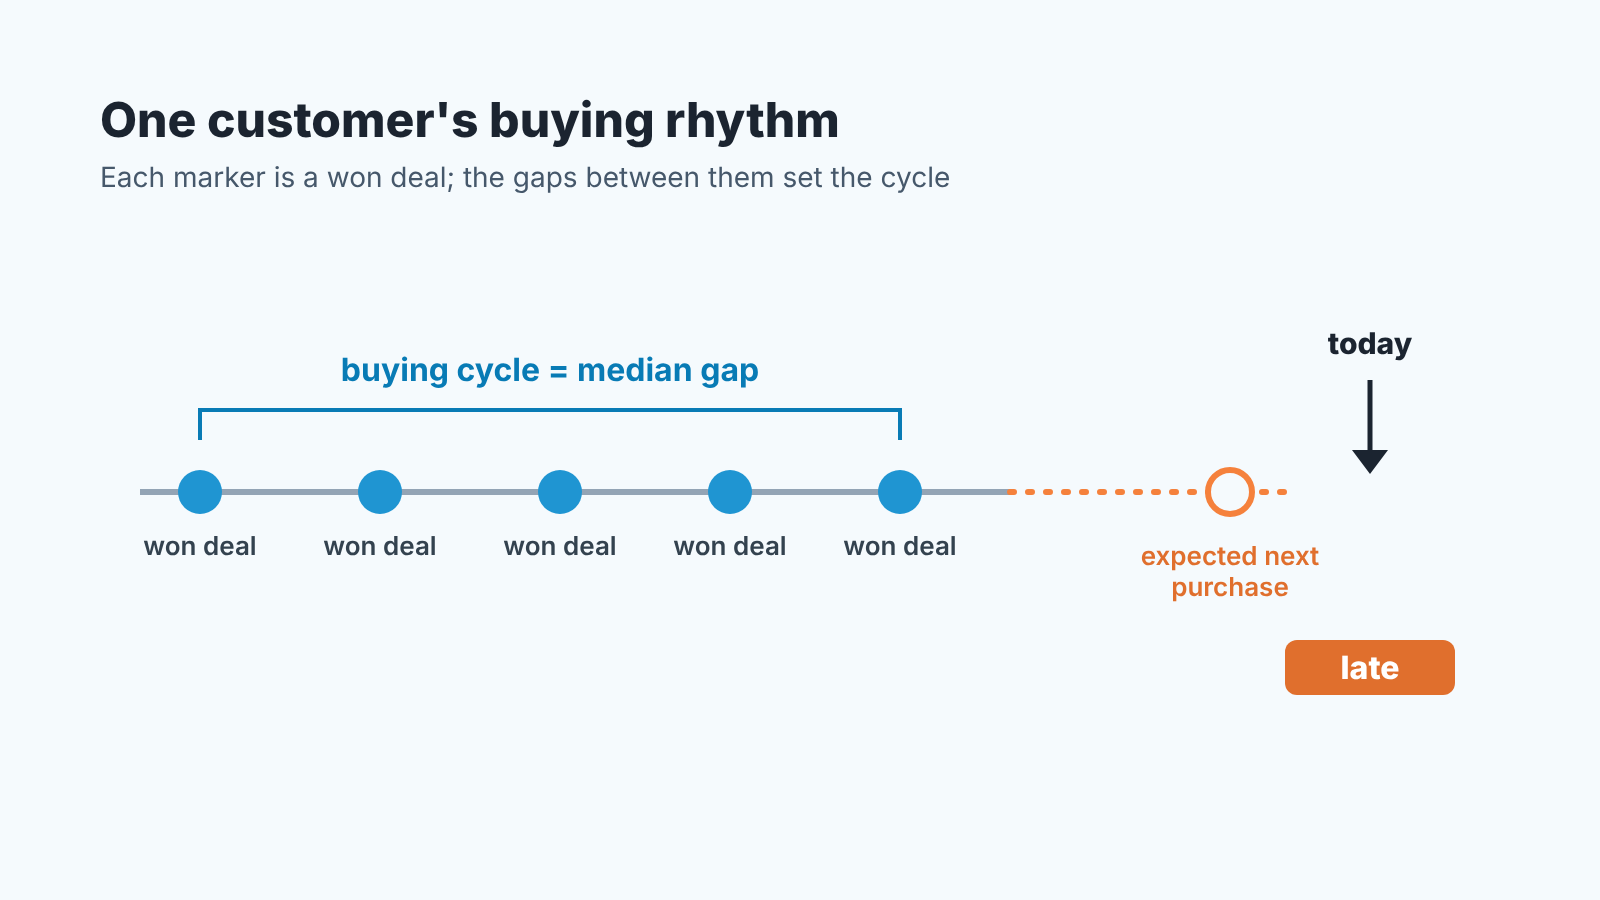
The third is the expected next purchase: the last purchase date plus the customer’s buying cycle. The cycle is the median interval between a customer’s purchases, so it needs at least two purchases to exist. We use the median rather than the mean because one long gap would otherwise stretch the cycle and hide a late reorder. Invented example: Northfield’s orders came mostly 80 to 100 days apart, so the cycle is about 90 days. A last order on 15 July means an expected next purchase around 13 October. On 1 November the customer is nearly three weeks late, and nothing in the CRM has flagged it, because CRMs track deals and ignore the gaps between them.
What a head of sales does with the table
Sort it by historical LTV, and the top ten rows are where a late reorder costs the most. That is the first use, and for many teams its a surprise: the biggest accounts by lifetime spend are rarely the ones with the most open deals this quarter, so they get the least attention.
The second use needs one more column, expected next purchase against today. Every customer past that date is late. Cross it with LTV and you have a very short list for Monday’s meeting. The retention playbook for that list is in customer retention strategies for B2B teams, and if you would rather build the late-customer logic yourself, a customer health score built from Pipedrive dates walks through the fields and filters.
The third use is by seller. Add an owner column and sum LTV per rep. If, say, 40% of your historical revenue sits with customers one rep owns, that is a concentration risk the pipeline report does not show, and it belongs in the same conversation as revenue at risk in the pipeline. Per rep, the share of their LTV that is currently late is a fairer coaching number than win rate, because it measures the customers they already have.
One warning from experience: don’t turn the table into a bonus formula on day one. Reps learn within a month that splitting one order into two deals raises their deal count. Historical LTV stays right; average order value and the buying cycle quietly break. Use the table for conversations first, for a quarter at least.
How Repeat Sales shows historical LTV, the buying cycle and who is late
Repeat Sales computes everything in the last three sections from won deals, with no assumptions added. Full disclosure: we build SalesBond, a sales management layer on top of the CRM a team already uses; we started with Pipedrive, and Repeat Sales is one part of it.
The rules are simple. A purchase is a won deal in a sales pipeline; one purchase makes a new customer, two or more a repeat customer. The buying cycle is the median interval between purchases, shown as “once every N days”, with a cycle confidence of high, medium or low depending on how many intervals there are and how spread out they are. Days since the last purchase divided by the cycle gives the status: on track within the cycle, overdue past it (threshold 1.0 by default), leaving past twice the cycle (2.0 by default), and both thresholds are configurable. An overdue customer with an open deal and recent contact shows as in work, an on-track customer whose expected purchase is close is marked purchase soon, one purchase gives new, and no determinable cycle gives undefined.
Historical LTV per customer is the actual sum of all won deals in the viewer’s scope, in the tenant’s base currency, next to the first purchase date, the average order value and the expected next purchase. It is computed per line, customer × seller, so a manager sees both the account and the rep behind it. In Repeat Sales a separate New section follows customers with one purchase toward their second. Customer recommendations appear in Sales GPS as one card per customer; accepting “Contact” creates a task in the CRM, and SalesBond never writes to your customers itself.
The limits: there is no machine-learning churn or next-purchase prediction, only the deterministic rules above. For one-off sales with no repeat pattern you will see mostly new customers and undefined cycles, and a spreadsheet is the the better tool. SalesBond works with Pipedrive, HubSpot, Salesforce, Zoho CRM, Microsoft Dynamics 365, Freshsales, Close, monday CRM, Copper, Zendesk Sell, Nutshell, Insightly, Attio, Bitrix24 and Kommo (amoCRM). If you want the table from this article built from your own won deals, check your CRM with SalesBond.
LTV against CAC, in one paragraph
LTV earns its keep when it meets customer acquisition cost: what you paid to win a customer against what that customer went on to buy. Historical LTV makes the numerator honest for existing customers, and the formula versions give you a forward estimate for the ones you have not won yet. CAC is the half the CRM cannot see, since salaries and ad spend live in finance. We walked through that side, and how to combine the two from a small team’s data, in the LTV to CAC ratio from CRM data.
FAQ
What is a good customer lifetime value?
There is no good absolute number. A $4,000 LTV is excellent if the customer cost $400 to win and poor if they cost $3,000. Judge LTV against acquisition cost and against your own customers: the median of your historical LTV table is the first benchmark worth having, and it is yours.
How do you calculate CLV for SaaS?
Shopify’s guide gives a subscription version: average monthly recurring revenue per customer × gross margin, divided by monthly customer churn rate, assuming stable revenue, margins and churn (Shopify). Where contracts are annual and renewals are deals in the CRM, the historical approach works too: sum the won renewal deals per account.
What is the difference between CLV and LTV?
In sales and marketing there is none: CLV, CLTV and LTV name the same metric, and LTV is the short form you see most often in the LTV-to-CAC ratio (Shopify). Search for “LTV” alone, though, and most results are about mortgages, where LTV means loan-to-value. For the sales metric, search “customer lifetime value” or write CLV.


