

Sales prioritization means deciding which deal, lead or customer gets a rep’s time first, and a prioritization matrix does it by ranking items on a few criteria, such as value and urgency. For sales, the useful version scores every deal, lead and customer on the same scale and turns the result into one short daily list with the reason written next to each item. The grid you draw on a whiteboard is the starting point, and the rep works from the ranked queue built out of it.
Every hour spent on one deal is an hour not spent on the next best one, which is its opportunity cost.
The classic 2×2 and the weighted matrix: when each works
The 2×2 is the version most people picture: two axes, four boxes, items placed by eye. Value on one axis, urgency on the other, and whatever lands top-right gets done first. It’s fast and fits on a napkin and it is good for one conversation about a dozen things. The Eisenhower matrix is the same picture with “important” and “urgent” on the axes; it sits with the other prioritization methods for an owner or sales manager, a guide that also covers projects and tasks.
The weighted matrix is the grown-up sibling. Six Sigma teams use it to filter causes or solutions: list the criteria, agree a weight for each on a 1 to 10 scale, rate every item against every criterion, multiply, add up (Six Sigma Certification Course: prioritization matrix). Minitab’s project version works the same way, usually with scores from 1 to 10, then plots each project’s total against an ease-of-completion value (Minitab Engage: project prioritization matrix). Both assume a team in a room agreeing on weights and picking between a handful of projects.
Use the 2×2 when you are talking. Use the weighted matrix when you are choosing between things that will each eat weeks; a one-off choice of that kind, such as a hire, a tool or where the owner’s month goes, is what a decision matrix for a sales owner handles with weights. Neither was designed for a Tuesday morning with a full pipeline, which is where sales lives; for that morning, task prioritization for sales reps turns the matrix into a daily order.
Why 2×2 fails with 50 deals, 50 leads and 50 customers on one desk
A 2×2 gives you categories without an order, and deals, leads and customers do not share its axes. Put fifty deals on it and the top-right box alone ends up with eleven sticky notes. You still have to pick which of the eleven to call first.
Then there is the axis problem. A deal has an amount and a close date. A lead has neither, only a chance of becoming a deal. A customer who bought every quarter for three years and has gone quiet has no open deal at all, so the pipeline view does not even show them. A rep who prioritizes from the deal list alone is, by construction, ignoring the lead list and the customer base. Three lists, three habits, and the loudest one wins.
The third failure is quieter: the 2×2 says nothing about where the scores come from. Someone places the the note. If that someone is the rep, the hardest deals drift toward “later”. If it is the manager, the placement is a week old by Wednesday. And nothing moves the note when the customer finally replies.
Five criteria for a sales prioritization matrix: severity, value, urgency, confidence, feasibility
Keep the two axes everyone understands, value and urgency, and add three that a sales queue can’t do without. Give each a weight so the total lands on a 0 to 100 scale. The weights below come from Sales GPS, the daily priority board in SalesBond. We quote them as a reasonable default to argue with. The plain-language reading of each criterion is ours:
- Severity, 35 points. How bad is the problem on this item right now? A deal with no next activity and a passed close date is severe; a deal that is merely large is not.
- Value, 25 points. Where the deal’s amount sits among the company’s deals, as a percentile. A $4,000 deal scores high in a company that usually sells $3,000 deals and low in an enterprise pipeline.
- Urgency, 20 points. What a day of waiting costs. A customer waiting for a reply is urgent, a close date four months out is not.
- Confidence, 10 points. How sure you are that the signal is real, given what is on the record.
- Feasibility, 10 points. Can the rep do anything about it today? If the decision-maker is on leave until the 15th, not much.
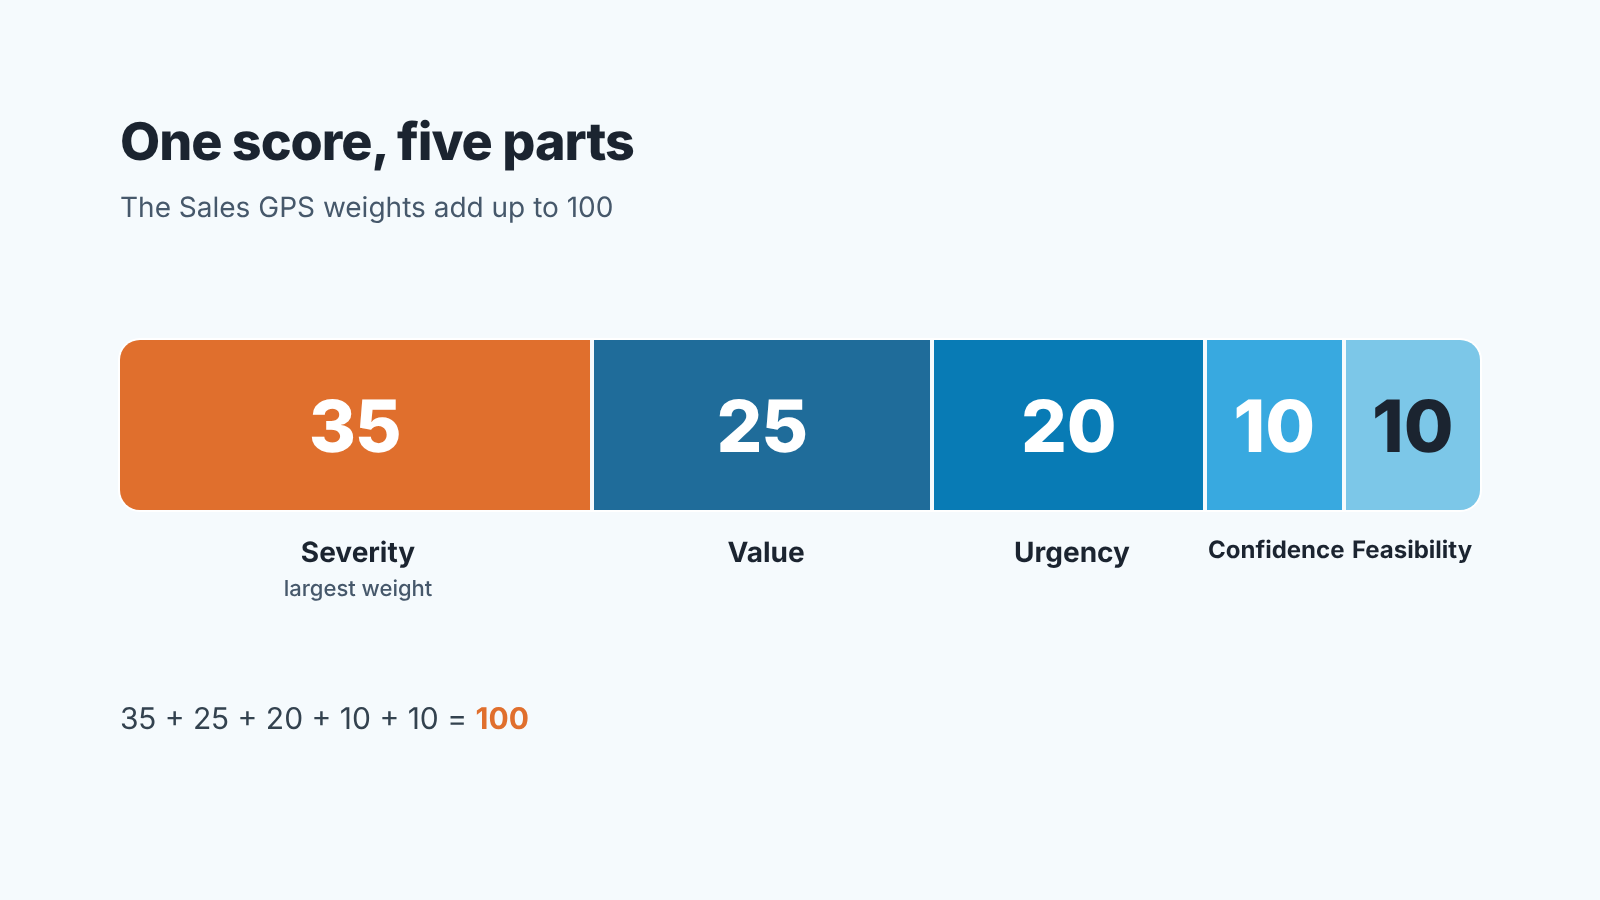
Severity gets the largest weight on purpose. Value alone makes the rep live in thier biggest deals and forget everything else, which is exactly the habit a matrix is supposed to break. Urgency alone turns the day into a sequence of whoever emailed last. Putting severity first means the queue starts where something is actually wrong.
Notice what is not on the list: the rep’s gut feeling, and any model that guesses. Each of the five can be read from the CRM record and explained in one sentence. That will matter later, when the reason has to be written next to the score.
How to build a prioritization matrix for sales, step by step
- Pick the items: deals, open leads and customers without an open deal, in one table.
- Pick the criteria. The five above work; fewer is fine if you can’t fill a column from the CRM.
- Set the weights so they add to 100, and write down why severity or value gets more. You’ll be asked.
- Score each item 0 to 100 on each criterion, from fields in the CRM rather than from memory. Days since the last activity, days past the close date, the amount, whether the last email is the customer’s.
- Multiply, add up, sort.
- Next to every score, write one sentence: what is wrong and what to do. Then cut the list to what one rep can finish in a day.
That’s the whole priority matrix. The table in the worked example below is a usable prioritization matrix template: copy it into a spreadsheet and replace our invented numbers with yours. If your team already keeps priority fields in Pipedrive, how to score deal priority with criteria in Pipedrive and activity priority labels in Pipedrive show the manual version inside the CRM.
A worked example: two deals and a customer (hypothetical numbers)
The numbers here are invented to show the mechanics. Score each criterion from 0 to 100, multiply by its weight, add up. Three items on one rep’s desk:
| Item | Severity (35) | Value (25) | Urgency (20) | Confidence (10) | Feasibility (10) | Score |
|---|---|---|---|---|---|---|
| Deal A: large, stalled 3 weeks in Proposal, no next activity | 80 | 90 | 40 | 60 | 70 | 71.5 |
| Deal B: small, customer emailed yesterday and is waiting for a price | 90 | 30 | 90 | 50 | 90 | 71.0 |
| Customer C: repeat buyer, past their usual reorder cycle, no open deal | 60 | 70 | 70 | 40 | 80 | 64.5 |
Deal A: 80 × 0.35 + 90 × 0.25 + 40 × 0.20 + 60 × 0.10 + 70 × 0.10 = 71.5. Deal B works out to 71.0, Customer C to 64.5.
Look at Deal B first. The small one lands within half a point of the big stalled deal. A value-only ranking would have buried it, and the customer waiting for a price would have waited another day. Then look at Customer C, who made the list at all. There is no deal to look at, so a pipeline-based 2×2 never shows them; the weighted queue does, because a customer is scored on the same five criteria as a deal.
The near-tie between A and B is the honest part of the example. 71.5 against 71.0 is close enough that either order could be defended, so what makes a rep trust the order is the reason next to the number.
Deals, leads and customers in one list: where the signals come from
A matrix is only as good as its inputs, and the universal templates leave this part to you. For a sales queue the signals live in three places, and all three are already in the CRM if the team fills it in.
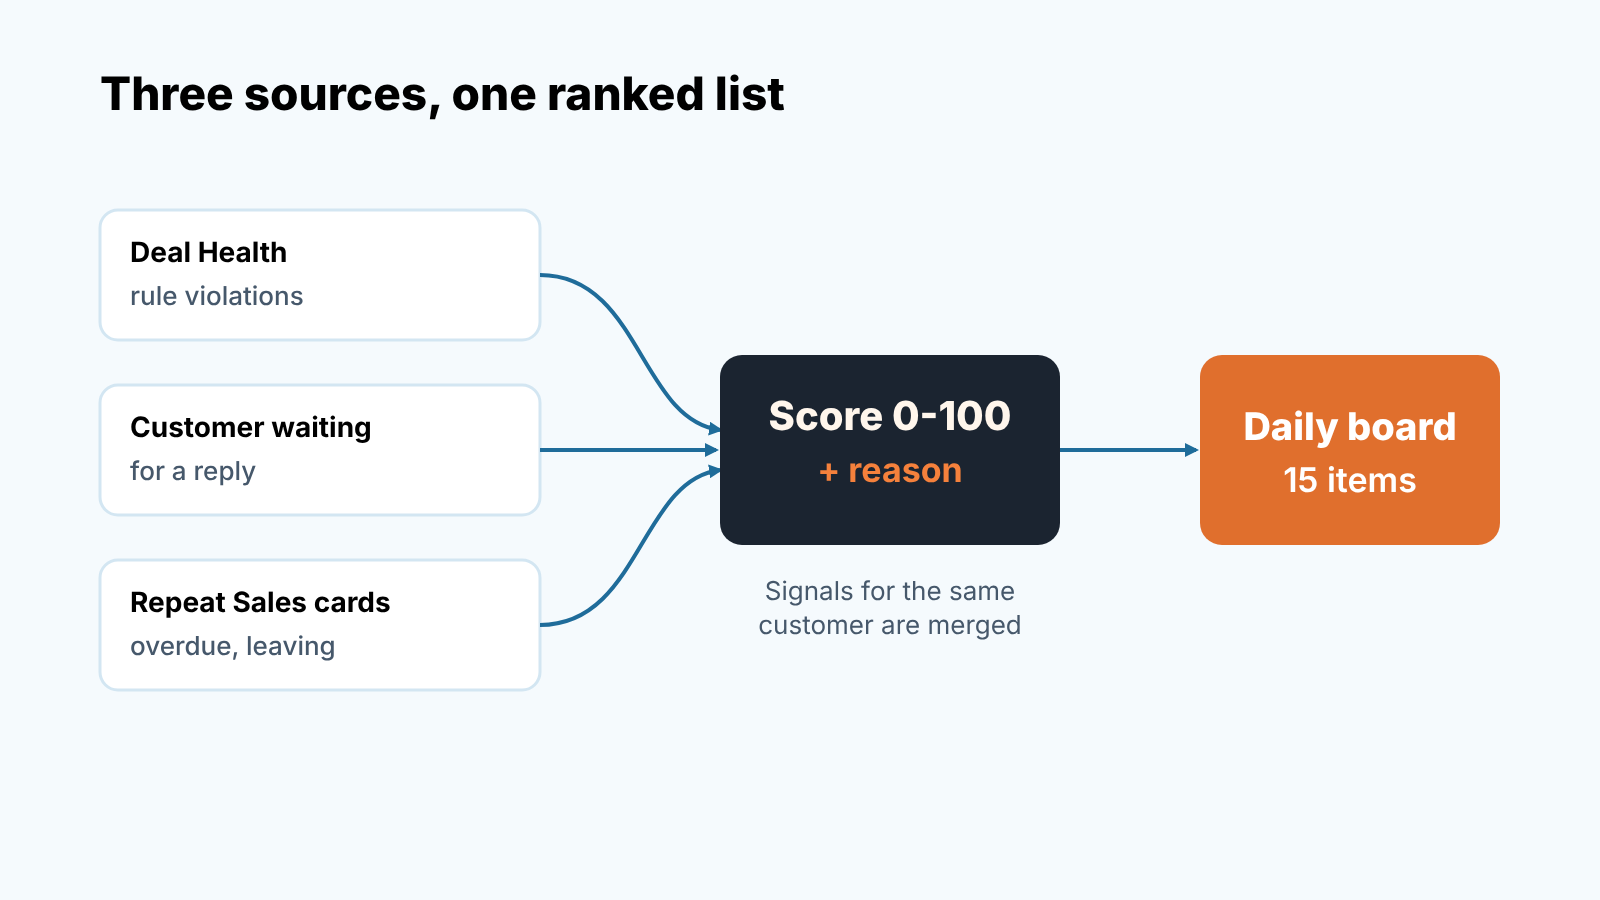
Deals produce signals through rule violations. Deal Health runs more than 20 rules against every deal, grouped into categories such as Activity (weight 30), Progression (25), Data (20), Forecast (15) and Ownership (10): no next activity scheduled, an overdue activity, no activity for 14 days, stuck in a stage for 21 days, a close date in the past, a missing amount, a missing contact or organization. Each violation is a candidate for the queue. The full logic is in what a deal health score is and how it is calculated and how Deal Health flags at-risk deals.
The second signal is the simplest and the most ignored: the customer is waiting for a reply. No rule set needed. The last message on the thread is theirs, and nobody has answered.
Customers without open deals produce the third signal through their buying cycle. Repeat Sales takes a customer’s won deals, works out the median interval between purchases (it needs at least two) and compares the days since the last purchase against that cycle. Past the cycle is overdue; past twice the cycle is leaving. An overdue customer belongs in the queue even though no rep has created a deal yet. The reorder mechanics are in customer retention through late-reorder detection.
Leads sit between the two, and they are the part you will mostly score by hand. A lead has no amount and no history, so value is thin and confidence is low by definition. That’s fine. Severity and urgency carry it. An inbound lead who filled in a form two days ago and has heard nothing is high on urgency and feasibility, and it belongs in the same list as Deal A, ahead of any inbox that gets opened after lunch. If an AI agent books meetings for your inbound leads, first make sure the meeting actually lands in the CRM: the booked-meeting handoff check.
One rule ties the sources together. If the same customer shows up as a stalled deal, a waiting reply and an overdue reorder, that is one customer with three reasons and one item. Merge them. A queue that lists the same company three times is a queue the rep learns to skim.
Why this item is first: write the reason next to the score
A score puts an item on the list, and reps still don’t act on 71.5. They act on “Deal A: no next activity scheduled and the close date passed 9 days ago; propose a date and book the call.” That is the format we would insist on for every line: the state, the reason, the recommended step. It also lets a manager read the list in two minutes and disagree with one line instead of with the whole system.
There is a side effect on the matrix itself. Once the reason has to be put into words, criteria that can’t be put into words quietly disappear. “Feels big” is not a reason. “Amount is in the top 10% of the company’s deals this year” is. If a prioritization framework cannot produce the sentence, the rep gets a ranking with nothing to do next to it.
We also think the reason should come straight from the data, with no language model guessing at it. Which rule fired, how many days late, which percentile: its all on the record. Generating the reason with AI adds nothing except the chance of an invented cause, and a rep who catches one invented cause stops reading the rest.
Daily limit: why 15 items a day beat 50
Cap the list because a rep finishes 15 and abandons 50. With fifty the rep does the top three and the other 47 roll over to tomorrow, where they meet a dozen new ones. By Thursday the list is a place where items go to be ignored.
Sales GPS caps the board at 15 items a day by default. That number is a product decision with no research behind it, and we are not going to claim it does anything to your revenue. Fifteen is a list a rep can finish, and a rep who finishes the list tends to open it again the next morning.
You may know the same instinct from personal productivity. The 1-3-5 rule plans a day as one large task, three medium and five small ones (Clockify: the 1-3-5 rule), and the four D’s sort each task into delete, delegate, defer or do, an approach the University of Arkansas extension service traces to The Power of Focus by Jack Canfield, Mark Victor Hansen and Les Hewitt (UACES: the Four Ds of time management). Both are caps and sorting rules, and both are useful. Neither tells you which deal is the “one large task”, which is why the scoring step comes first. In a sales queue “delete” is rare, “delegate” is usually handing a lead to another rep, and “defer” is what should happen to item 16.
A cap also matters for the manager. When the board has 15 lines, the Monday pipeline conversation can go line by line. When it has 50, the conversation drifts back to the biggest deals, and you are in the value-only habit again. If that conversation is about money rather than items, revenue at risk in the sales pipeline is the companion read: the same signals, added up in dollars instead of ranked.
How Sales GPS does it in the CRM
A disclosure, since the method above is the one we built: we build SalesBond, a sales management layer on top of the CRM a team already uses; we started with Pipedrive. SalesBond works with Pipedrive, HubSpot, Salesforce, Zoho CRM, Microsoft Dynamics 365, Freshsales, Close, monday CRM, Copper, Zendesk Sell, Nutshell, Insightly, Attio, Bitrix24 and Kommo (amoCRM). In it, Sales GPS takes its signals from Deal Health violations, from “customer is waiting for a reply” and from Repeat Sales customer cards, scores each one 35/25/20/10/10 to a 0 to 100 priority and writes the “why first” explanation from the data, with no AI in the calculation. Signals for the same customer merge into one card, tasks that already exist in the CRM are not suggested twice, and the board holds 15 items a day unless you change it. The rep accepts or declines each card. An accepted card becomes exactly one task in the CRM, and nothing is created there without that click; a declined card pauses, so it does not come back tomorrow with the same reason.
If you want to see what the queue looks like on your own data: Check your CRM with SalesBond.


