
Opportunity cost is the value of the next-best option you give up when you choose one thing over another. In a sales team, that’s the best deal nobody worked on. When a rep spends five hours on a stalled deal, the price of those hours includes the stronger deal that didn’t get a call back (often the one where the buyer was actually answering emails).
What is opportunity cost?
Wikipedia’s article on the term, as it read on November 18, 2026, defines the opportunity cost of a choice as “the value of the best alternative forgone where, given limited resources, a choice needs to be made between several mutually exclusive alternatives” (Wikipedia: Opportunity cost). Corporate Finance Institute’s explainer says it in fewer words: opportunity cost “is the value of the next best alternative foregone” (CFI: Opportunity Cost, checked November 2026).
Take a student who picks up Tuesday evening shifts. The paycheck is real, and the study hours those shifts used up are the price. Money behaves the same way. Leave $10,000 in a savings account and its opportunity cost is what a fund, or your own business, might have earned with it over the same year. For a small firm deciding between a new machine and a second technician, buying the machine costs the work the technician would have done.
The opportunity cost formula
When you choose between Decision A and Decision B, “the opportunity cost of Decision A is the net benefit of Decision B”, according to CFI’s same explainer (CFI, November 2026). We write it as a difference, so the result shows how much a choice left on the table.
Opportunity cost of your choice = expected return of the best option you passed up − expected return of the option you chose
Use margin for “return” if you have it, since revenue flatters deals that need a heavy discount or extra delivery work. The example below sticks to revenue to keep the arithmetic short.
A positive result means you picked the weaker option, and the number is what that choice cost. Got zero or less? Then the option you picked was at least as good as anything else on the table.
Only one alternative counts, the best one that was really available. A rep with ten open deals has nine alternatives to the deal they’re on, and eight of them don’t matter for this sum. And the alternative has to be real. If the rep’s queue is empty, an hour on a weak deal costs close to nothing, because the only other use of that hour was an empty calendar.
Opportunity cost vs sunk cost vs explicit cost
Pipeline reviews mix these three up constantly. Sunk cost is the one that sneaks in most often, usually as a sentence like “we’ve already put twenty hours into this account.”
Opportunity cost is an implicit cost. Wikipedia describes implicit costs as “the opportunity costs of utilising resources owned by the firm that could be used for other purposes” and says they “are also not recorded for the use of accounting purposes because they do not represent any monetary losses or gains” (Implicit costs, November 2026). So you won’t find the lost afternoon in your books. A team can run a healthy-looking P&L while its reps spend their afternoons on deals that won’t close, and the only way to see that is to work the number out yourself.
Explicit costs are the ones that do show up. The same article defines them as “the direct costs of an action”, paid through a cash transaction or a transfer of resources (Types). In a sales team that’s salary, commission, the CRM subscription and the train ticket to a client meeting. They belong in a decision as money you’ll still pay from here on, and the ROI formula for a sales team is the place to start with them.
Sunk cost stays out of the decision. Wikipedia calls sunk costs “costs that have been incurred already and cannot be recovered” and says they “should not influence present or future actions or decisions regarding benefits and costs”. The twenty hours and two demos already spent on a deal that went quiet are sunk. Hear “but we’ve invested so much” in a pipeline review? That’s sunk cost talking, and it’ll keep a rep feeding a deal because of what it has already eaten.
If your books split costs into fixed and variable, that’s a different cut of the same money, covered in fixed vs variable costs for a sales owner.
Where it hides in a sales team: rep hours, stalled deals, discounts
Open the pipeline on a Monday and count the deals nobody has moved in three weeks. Each one still gets a little attention. A check-in email, a “just following up” call, ten minutes of rereading notes before the pipeline meeting. Most of those minutes never get logged against a deal, which is how a rep’s whole Friday afternoon can vanish without a line in any report.
Those minutes cost something because a rep’s selling week is short and fixed. Whatever goes to the quiet deal comes out of a deal where the buyer is answering. Payroll is identical either way, which is why the P&L never shows the difference. You pay the same salary for an hour with a 40% chance of producing revenue and for an hour with a 5% chance (example numbers), and payroll reports both as one hour.
Stalled deals carry a second cost that’s easy to miss. They keep the forecast looking full, so the owner feels less pressure to fill the the top of the funnel, and the prospecting that should have happened this month doesn’t.
Discounts work the same way with money. A discount given to close this deal is margin that can’t be spent on anything else, and it sets the price the next buyer from that referral circle will expect. Sometimes it’s still the right call (there’s an example below). The question to ask is what the same dollars or the same hours would have produced elsewhere.
How would you know? You need three numbers per deal, and two of them are already in the CRM.
A worked example from CRM numbers
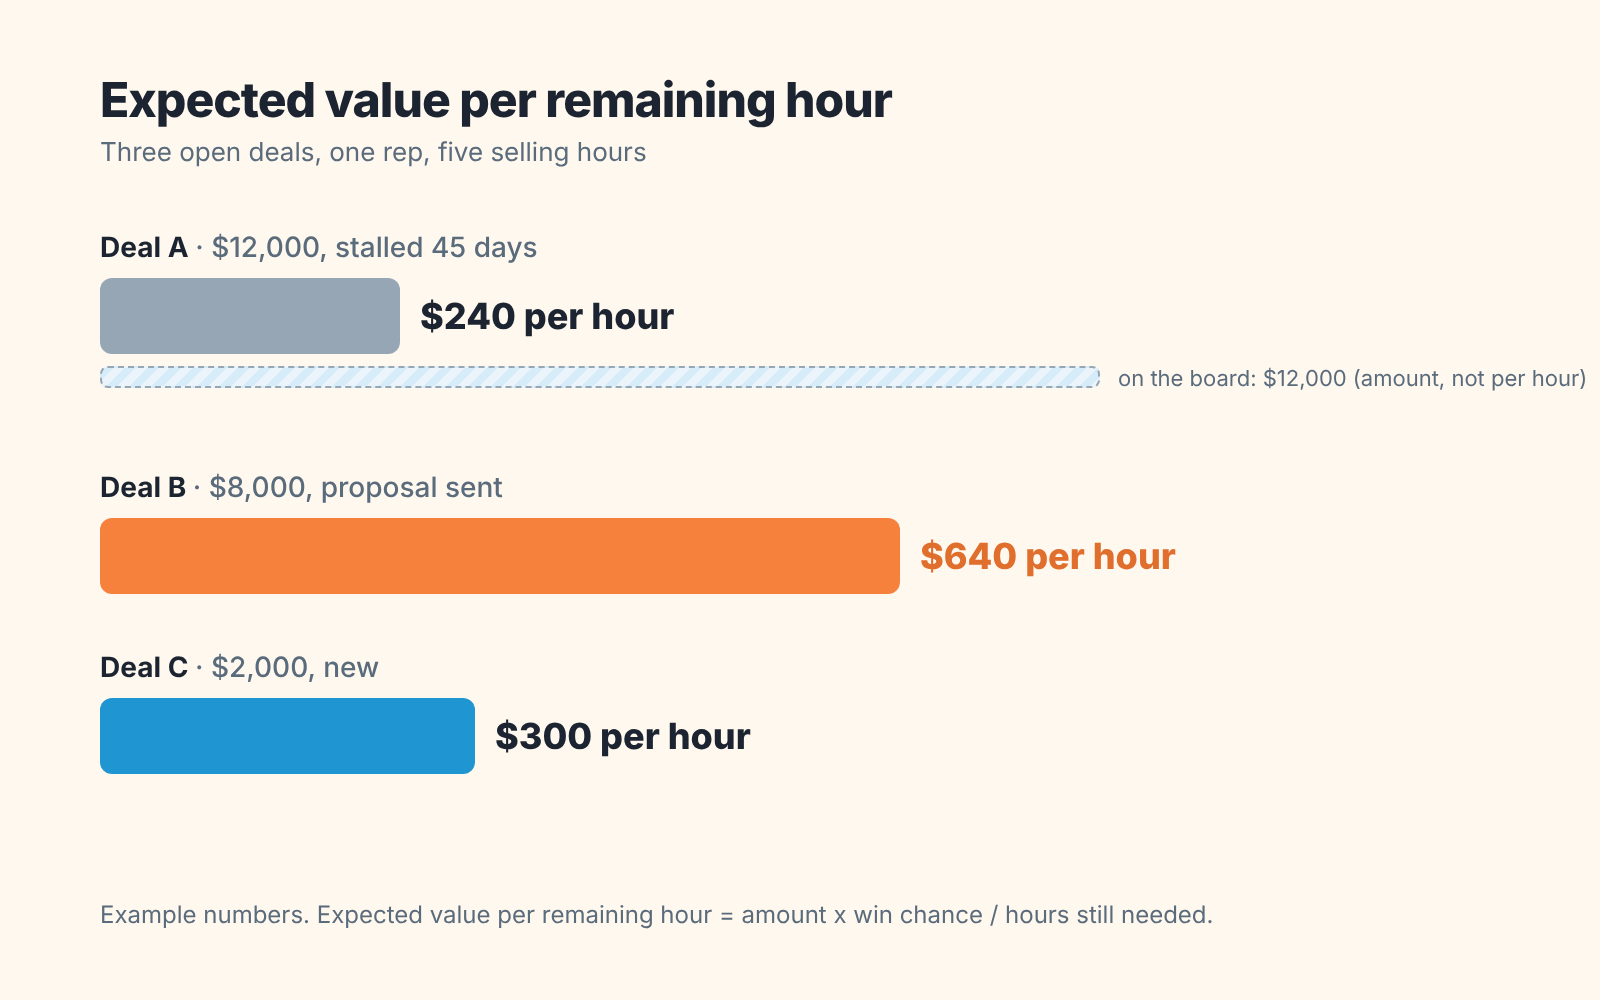
Say a five-rep team sells a B2B service (every number in this section is a made-up, round example, so swap in your own). One rep, call her Dana, has five selling hours left this week and three open deals. The team’s closed deals from the past twelve months give a win rate for each stage. In this example the negotiation stage wins 50% of the time overall, but deals that sat in negotiation longer than 30 days went on to win only 10% of the time. Deal A has been sitting there for 45 days.
| Deal | Amount | Win chance | Hours still needed | Expected value | Expected value per hour |
|---|---|---|---|---|---|
| A: stalled 45 days in negotiation | $12,000 | 10% | 5 | $1,200 | $240 |
| B: proposal sent last week, buyer replying | $8,000 | 40% | 5 | $3,200 | $640 |
| C: small new deal | $2,000 | 30% | 2 | $600 | $300 |
Expected value is amount times win chance. Expected value per hour divides that by the hours the deal still needs.
Dana’s instinct is to work Deal A, the biggest number on her board. If she does, she gets $1,200 of expected value and passes up Deal B’s $3,200.
Opportunity cost of choosing A = $3,200 − $1,200 = $2,000.
That $2,000 appears in no report. Deal A looks like a $12,000 opportunity in the pipeline view, and Dana looks busy on her largest deal.
Where do the inputs come from?
Amount is the deal value field. Win chance comes from your own history. Of the deals that reached this stage, what share was won? Split it by time in stage if you can, since a stage-wide percentage flatters old deals, as Deal A shows.
Hours still needed is an estimate. Count the calls and meetings your won deals typically had after this stage and multiply by how long those usually take.
If you track margin per deal, run the same table on margin instead of revenue. Contribution margin per deal explains how to get that figure.
Three calls the owner makes with this number
Who gets which deal
Who should take the $2,000 deal? Your best closer’s hour is the most expensive hour on the team, because their next-best option is usually a good deal. In the example, Dana’s hours are worth $640 each while Deal B-type work is waiting. Deal C returns $300 an hour, so every hour she gives it costs the team $340.
Hand Deal C to a junior rep. Suppose the junior wins such deals 20% of the time instead of 30%. Expected value drops from $600 to $400, a $200 loss, and Dana gets two hours back, worth $1,280 at Deal B’s rate. The trade only works while Dana has strong deals queued, so check her pipeline before you reassign anything . For ordering work inside one rep’s day, see task prioritization for sales reps.
When to drop a deal
The usual advice is to follow up until the buyer says no and never give up on a deal. We disagree. Persistence has a price like everything else, and that advice only holds for a rep who has nothing better to do. Once there’s a deal in the queue with a higher expected value per hour, each extra follow-up on the quiet one buys revenue at a bad rate.
Here’s a drop rule you could announce at Monday’s pipeline meeting. A deal with no next step agreed with the buyer (in most CRMs, an empty next activity), sitting in its stage for more than twice your usual time in that stage, gets one last message with a specific date in it. No reply by that date? Close it as lost and set a reminder to check back next quarter. “Twice” is a starting point; tune it against your own win rates by deal age. And leave the hours already spent out of the discussion, since nothing you do this week brings them back.
When a discount isn’t worth it
A 10% discount on Deal B gives away $800. Holding the price might take two more hours of calls, and at $640 an hour those two hours cost $1,280 in expected revenue from other deals. In this example the discount is the cheaper route by $480.
Change one fact and the answer flips. If the rep’s queue is thin, two more hours cost very little and the $800 is simply gone. So the discount decision depends on what else is waiting, which is why a blanket “never discount” rule and a blanket “close it at any price” rule both lose money. The longer version is in what closed-won discounts tell you about pricing.
What the CRM can’t show you
Ask a rep how many hours Deal A really took and you’ll probably get a shrug. Hours are the weakest input in the table. A CRM records activities that were logged, and plenty of selling time never gets logged: proposal writing, internal pricing chats, the drive to the client, thinking. If reps log calls unevenly hours-per-deal will be off by a wide margin, and the per-hour column inherits the error. Treat it as a ranking tool. $640 against $240 is a clear signal; $310 against $290 is noise.
Win chance has it’s own gap. Stage percentages describe your past deals on average and know nothing about this buyer’s budget freeze or the champion who just resigned. Does the rep know something the stage doesn’t? Ask before you trust the 40%.
And the CRM holds no deals you never created. The prospecting call that wasn’t made has an opportunity cost too, and no field for it. A fixed weekly block for prospecting protects it better than any report does (time blocking for an owner who also manages sales covers how).
What the CRM does show is enough to start: stage, amount, time in stage, and whether a next step is scheduled. We build SalesBond, a sales management layer on top of the CRM a team already uses. It doesn’t calculate opportunity cost and it isn’t an accounting tool. Its free CRM audit looks at the last 30 days of your CRM and sends a PDF report that includes deal health and the pipeline bottleneck, then a second PDF seven days later with what changed. That’s a quick way to get the list of stalled deals this article keeps asking about. Check your CRM with SalesBond.
Then pick one rep and one week. Put amount, win chance by age and hours left next to each of their open deals, sort by value per hour, and look at where their Monday actually went.


