
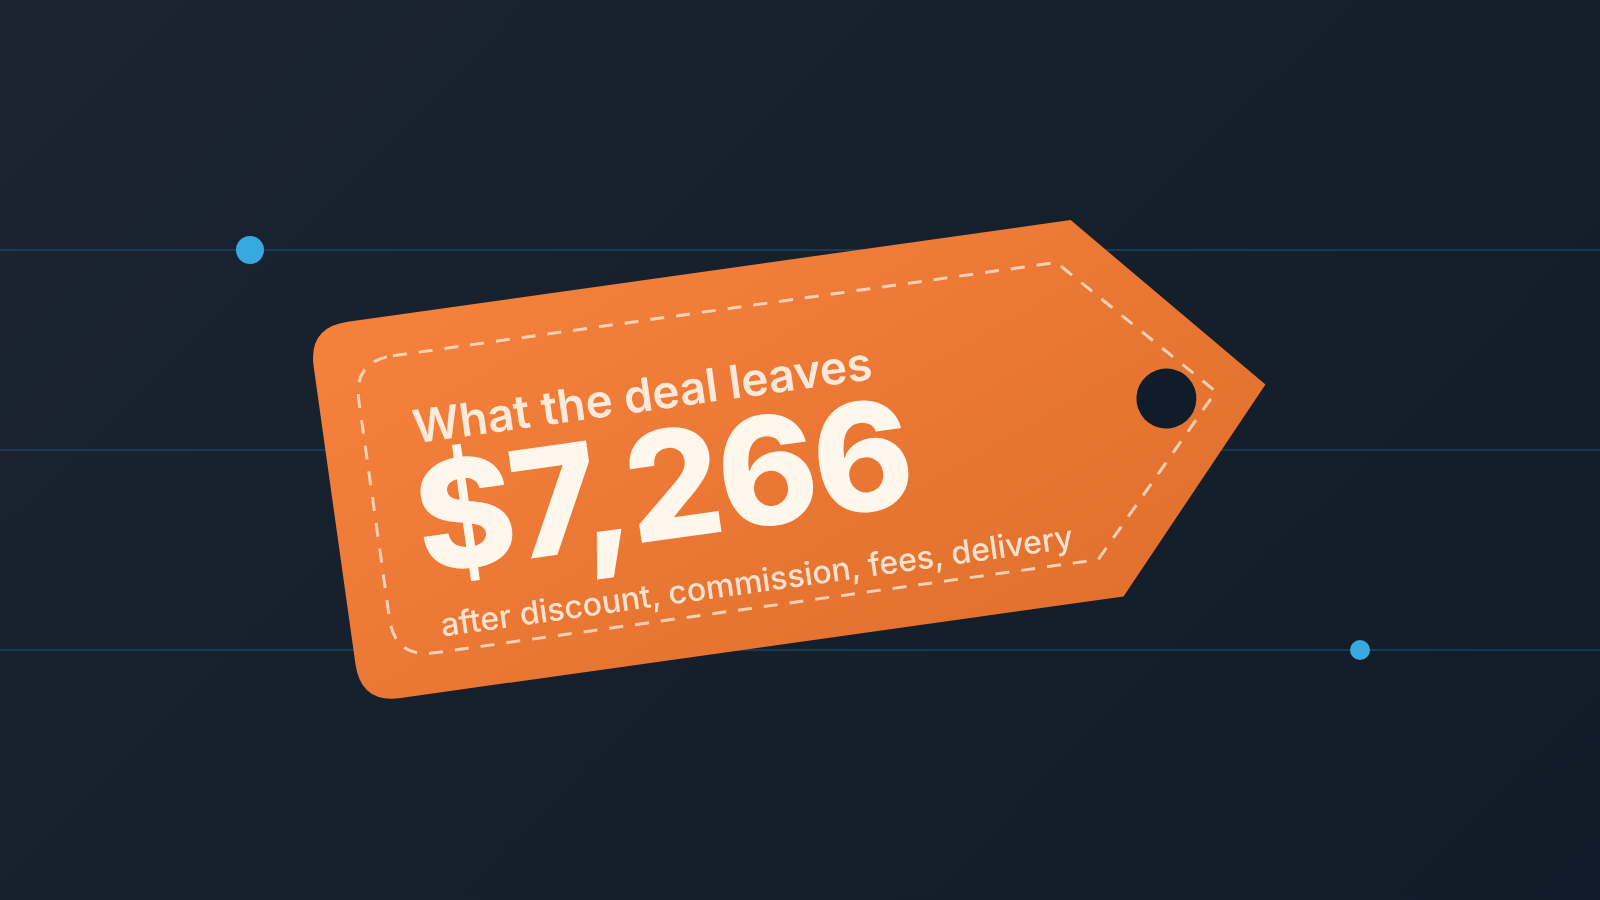
Contribution margin is selling price minus variable costs: the amount a sale leaves behind to cover fixed costs and, after that, profit (Intuit: what is contribution margin). For a sales team the useful version is per deal. Take the price the customer actually pays after the discount and subtract the rep’s commission, the payment fee and the direct cost of delivering that one order: Deal contribution = net price − commission − payment fee − direct delivery cost. That number tells you how much discount a deal can take before it stops being worth winning.
The accounting textbooks compute it per unit of product. We think a sales owner should compute it per deal, because that is the unit a rep negotiates, a manager approves and a commission plan pays on.
The two kinds of cost behind a deal
Every deal has two kinds of cost behind it. Some appear only because this deal exists: the discount, the commission on it, the card or invoice fee, the contractor hours or shipping to deliver it. Others are there whether the deal closes or not: office, salaries of people who do not sell, software subscriptions. Contribution margin is price minus the first kind. It is what the deal contributes toward the second, and the split is the classic fixed vs variable costs question applied to a single deal.
Tracing those costs to the deal is the job of cost accounting.
Intuit’s definition adds the part people skip: the metric exists for internal decisions, pricing and product strategy among them, and that is what separates it from gross profit. Nobody outside the company will ask for it; you compute it for your own pricing and discount decisions.
The formula on one deal (illustrative numbers)
In general form, Contribution margin = net price − variable costs and Contribution margin ratio = contribution margin / net price. Accounting textbooks state it per unit, as price per unit minus variable cost per unit; here the unit is the deal.
Now with a made-up deal.
A rep sells an implementation package with a list price of $12,000. To close it she gives 10% off. The commission plan pays 8% of the net price. The customer pays by card, and the processor keeps 2.5%. Delivering the package means 20 hours of a contractor at $120 an hour, so $2,400 of direct cost that would not exist without this order.
Walk it through. Ten percent off $12,000 leaves a net price of $10,800, the amount the customer actually pays. Commission at 8% of that is $864. The card fee is $270. Take those and the $2,400 of delivery away, and what is left is the contribution, $10,800 − $864 − $270 − $2,400 = $7,266. As a ratio, 7,266 / 10,800 = 67.3%.
So the deal the CRM shows as $10,800 contributes $7,266 to fixed costs. The $12,000 the rep quoted first is not in any of those subtractions; it only matters for sizing the discount. Once you know the contribution, cost-volume-profit analysis turns it into the number of deals needed for a target profit.
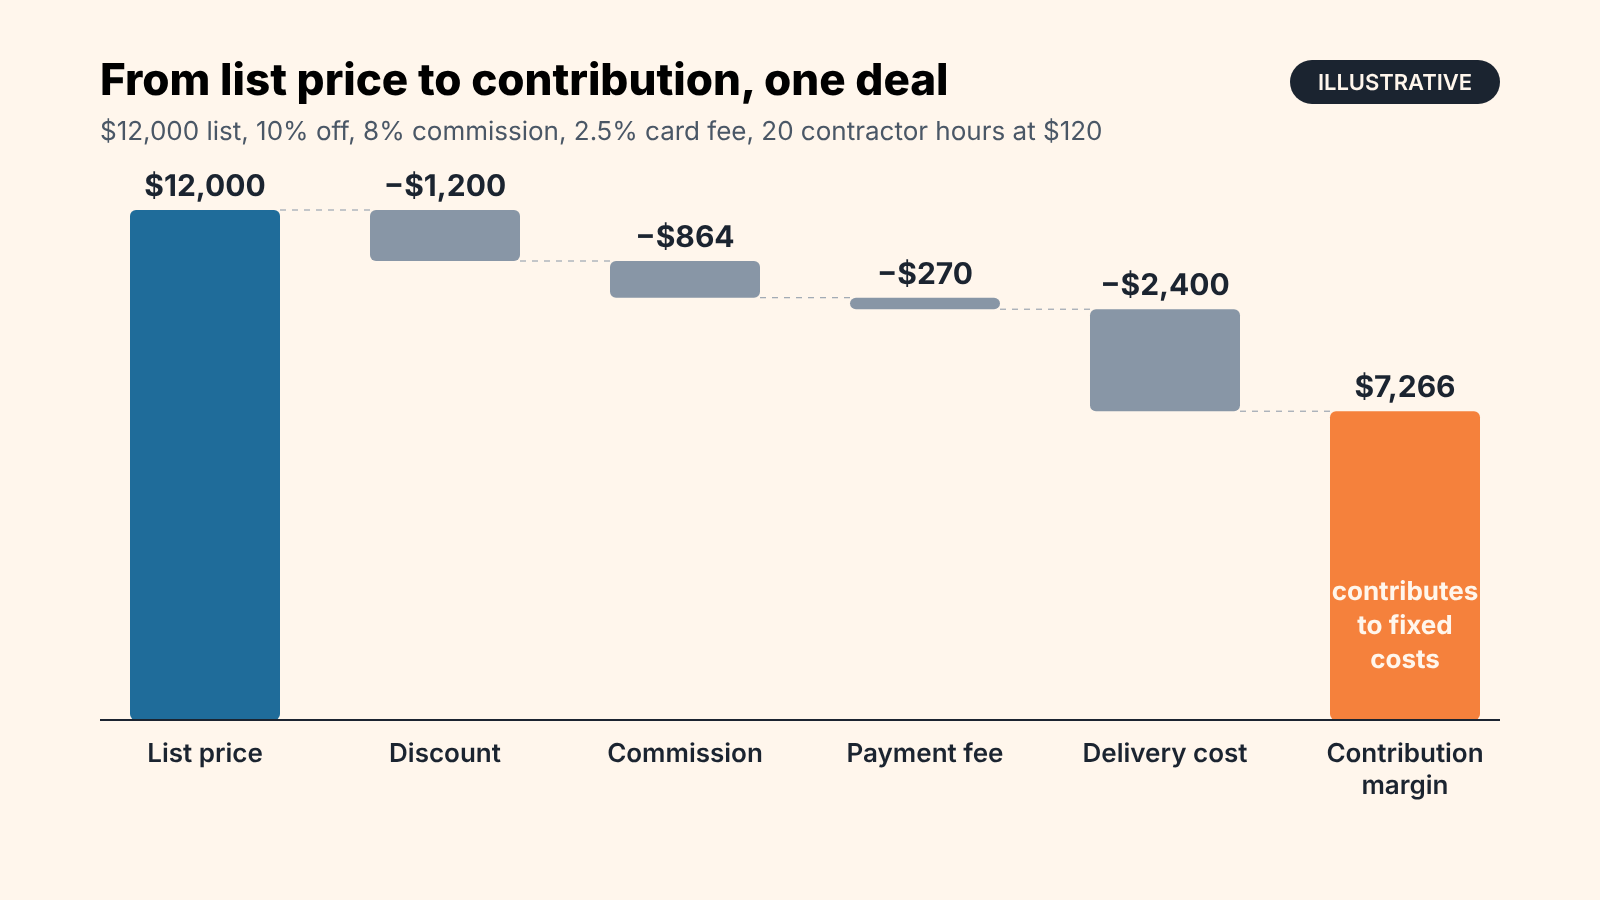
Two choices in that calculation are deliberate. Commission is computed on the net price; if your plan pays on list, the discount gets cheaper for the rep and dearer for you. And the delivery cost is only the part caused by this order: the contractor’s hours count, the account manager’s salary does not, even though she will spend time on the account.
Contribution margin vs gross margin: which question each one answers
Gross margin answers “how much does the company keep after cost of goods sold, over a period”. Contribution margin per deal answers “should we take this deal at this price, with this rep, delivered this way”. Same family of arithmetic, different unit and different audience.
Three differences matter to a sales owner. Gross margin comes from the P&L and uses a COGS classification the accountant owns; contribution per deal uses whatever costs the deal itself triggers, and some of those (commission, payment fees) are not COGS at all. Gross margin is a monthly or quarterly number; contribution is estimable the moment a quote is written. And gross margin never shows the discount, because revenue on the P&L is already net, while contribution per deal shows it as a line, so you can see what it bought.
The company-level view, including how to tie closed-won revenue to the margin on the P&L, is in gross margin formula and what COGS means for a small sales company. If “markup” also comes up in discount conversations, markup vs margin for sales managers untangles the percentages.
What a discount does to one deal’s contribution margin
A discount comes out of contribution almost one for one, and that is why it hurts more than the percentage suggests. In the example deal, the only costs that shrink with the price are commission and the payment fee. The $2,400 of delivery cost stays whatever the customer pays.
Whether a discount still pays comes down to the marginal cost of one more deal.
Run the same deal at a few discount levels, keeping the commission rate, the fee and the delivery cost as they were.
With no discount the customer pays $12,000, commission and fee take $1,260, and the deal contributes $8,340, a 69.5% ratio. At 10% off it is the $7,266 from above, 67.3%.
At 20% the net price drops to $9,600 and contribution to $6,192 (64.5%). At 25%: $9,000 and $5,655 (62.8%). At 30% the customer pays $8,400 and the deal contributes $5,118, or 60.9% of the price, with the same $2,400 of delivery in every case.
Each ten points of discount removes $1,074 of contribution on this deal, every time, because 89.5 cents of every discounted dollar would have reached contribution (the other 10.5 cents were commission and fee that go away with it). A 10% discount is a 12.9% cut in what the deal contributes. A 30% discount, which a rep might call “a bit more than usual”, takes out 38.6%.
This is the number to set a floor against. Decide, per product line, the smallest contribution a deal must bring, in dollars or as a ratio, and write it into your discount policy for the sales team. In the example, a floor of $6,000 means 20% is the last discount a manager can approve alone and 25% is not. A floor stated as contribution is easier to defend than one stated as discount percent, because it stays correct when the delivery cost of a product changes.
The approval mechanics are a separate topic: for Salesforce teams, how a manager gates a discounted deal without slowing the rep; for what closed-won discounts say about the price list itself, pricing strategy for a small sales team.
Commission and payment fees: the variable costs sales owners forget
Discounts get argued about. Commission and payment fees quietly do not, and together they took $1,134 out of the example deal, almost as much as the 10% discount itself ($1,200).
Payment fees are easy to miss because they never appear on a a quote. A card payment, a marketplace cut, a financing partner’s fee, a currency conversion: whichever applies is a cost that only exists because the customer paid that way. Record the payment method on the deal and apply the rate once, so nobody has to remember it in the monthly review.
Commission is the bigger question, and here is a position: if commission is paid on revenue, the rep and the owner are optimizing different numbers. On the example deal, a 25% discount costs the rep 25% of her commission ($960 to $720) and costs the company 32.2% of its contribution ($8,340 to $5,655). The rep is right that the discount is cheap for her.
One variant worth discussing with your finance person before any team adopts it is to pay commission as a share of the deal’s contribution before commission. On the example, 10% of that figure gives $930 at list price and $637.50 at a 25% discount, a 31.5% drop, close to what the company loses. A rep paid this way asks for the delivery cost before she asks for the discount. The downside is that the plan is harder to explain, and the rep has to trust a delivery cost figure she did not produce. The arithmetic for several plan types, tiers and splits included, is in sales commission calculator: five worked examples.
The CRM fields you need on the deal
Contribution per deal fails in practice for one reason: the costs live in three places (the quote, the payroll sheet, the delivery team’s heads) and nobody puts them on the deal. The fix is a short set of deal fields, filled at the right moment, in whichever CRM you run.
- List price and discount (percent or amount). Keep the list price; once it is gone you cannot tell a 20% discount from a cheaper product.
- Net price. In most teams this is the deal’s standard amount field, so write down which one it is and do not let reps enter the list price there.
- Commission rate, or at least the plan the rep is on, filled when the deal is created and not at payout time.
- Payment method, as a short dropdown. The fee rate follows from it.
- Direct delivery cost: an estimate at proposal stage, the actual at closed-won. The estimate drives the discount decision; the actual drives the monthly view.
- Contribution margin itself, computed or filled by ops once the deal is won.
Where the last field is calculated depends on the CRM. Pipedrive teams can do most of it with a formula field; what works and where it stops is in deal margin in Pipedrive without a spreadsheet. Elsewhere an export to a sheet at closed-won is an honest answer. What matters is that the inputs sit on the deal, with the same field names for every rep, from the first proposal. To see how your deal data looks today before adding anything, SalesBond, the product we build, offers a free CRM audit that reads the last 30 days of the connected CRM and sends a PDF report with money at risk, a CRM score and up to five things to fix, sorted by money; seven days later a second PDF shows what changed.
A quick monthly view: contribution by rep and by product line
Once the fields exist on closed-won deals, the monthly view is a single pivot. Group won deals by rep and show net revenue, total contribution and the contribution ratio side by side. Then do teh same by product line.
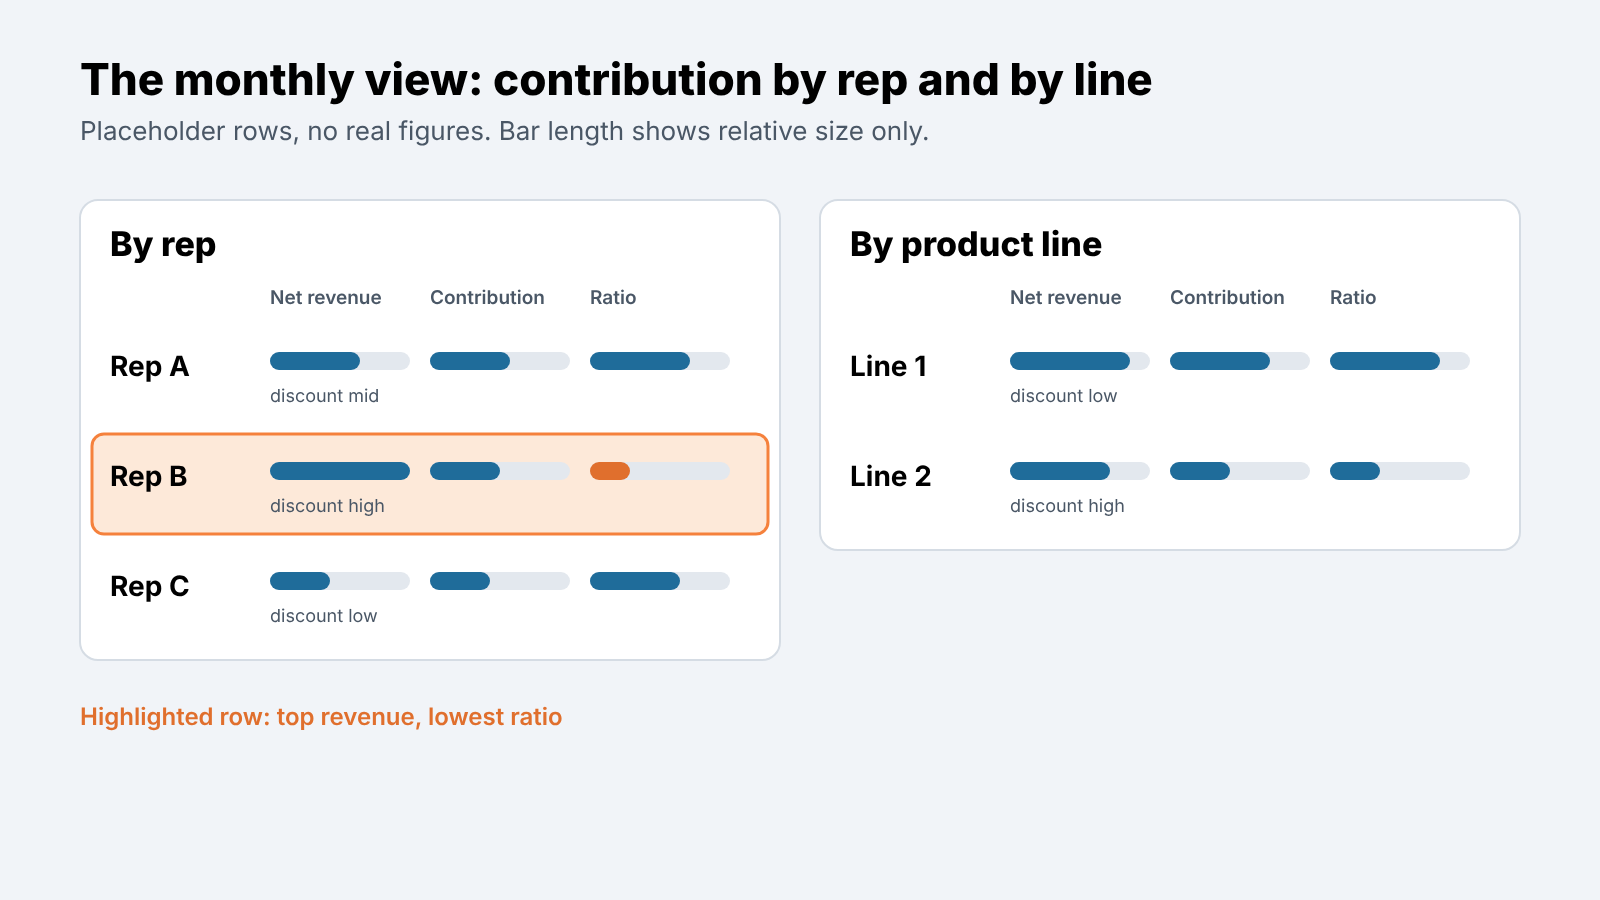
Three patterns show up within a quarter or two. A rep whose revenue is top of the board and whose contribution ratio is bottom of it, usually because her average discount is highest and she sells the product with the heaviest delivery cost. A product line whose ratio is fine on paper and poor in practice, because the delivery estimate at proposal is routinely half the actual. And the opposite surprise: a smaller rep whose deals contribute more per dollar than anyone’s, never thanked for it because the revenue leaderboard cannot see it.
The view is still about deals. Fixed costs, taxes and what the company earns for the period are a different question with a different owner. What the sales owner controls, deal by deal, is the top of that chain: the price, the discount, the cost of winning and the cost of delivering. Put those four on the deal and the conversation with finance gets shorter.


