

Net present value (NPV) is the value today of money you expect in the future, minus what you pay now, with future money discounted at a chosen rate. If the NPV is above zero, the investment returns more than the discount rate; for a sales owner it is a way to compare hiring a rep, buying a tool or accepting a deal that pays in installments.
This guide isn’t investment advice, and every number in the examples below is made up for illustration, including the discount rates of 1% a month and 3% a quarter.
The net present value formula
The net present value formula in Wikipedia’s net present value article writes NPV as the sum of each period’s net cash flow divided by (1 + i) raised to the number of that period:
NPV = R0 + R1/(1+i)^1 + R2/(1+i)^2 + ... + RN/(1+i)^N
R is the net cash flow of a period (cash in minus cash out), i is the discount rate per period, and period 0 is today. R0 is usually negative, because that’s the money you put in. By the convention the same article describes, cash flows inside a period are treated as arriving at the end of it.
You need three inputs, then. A list of dated cash flows, a rate, and a horizon (how many periods you’re willing to count). The arithmetic takes a minute in a spreadsheet. Agreeing on the inputs takes the afternoon.
Why $5,000 next December is worth less than $5,000 today: the discount rate
Would you swap $5,000 in your account this morning for a signed promise of $5,000 in a year? Most owners wouldn’t, and the reason is practical: money in hand can pay a salary, clear a supplier invoice or sit in a deposit account, while a promise can do none of that until it turns into cash. Wikipedia’s NPV article gives the small-scale version: “a lender may offer 99 cents for the promise of receiving $1.00 a month from now.”
The discount rate puts a price on that waiting. The article defines it as “the return that could be earned per unit of time on an investment with similar risk,” and describes two common ways to pick one. Some firms use their weighted average cost of capital. Others ask what the same money would earn elsewhere (if the capital can earn 5% in an alternative venture, they discount at 5%). There is no standard number for a small sales business, and this guide doesn’t suggest one. Pick a rate you can explain to your accountant, then run the calculation at a second, higher rate to see whether the decision survives.
Discounting is compounding run backwards. Wikipedia’s future value article grows a sum forward as FV = PV × (1 + i)^n, and NPV divides each future amount by that same (1 + i)^n to bring it back to today.
A monthly table needs a monthly rate and a quarterly table needs a quarterly one, and mixing them up is the most common way to get a wrong answer. In the examples below 1% a month and 3% a quarter are close to the same price of money, since 1.01 multiplied by itself three times is 1.0303.
How to calculate NPV: hiring a rep, worked through
Say a company wants a fourth rep. Recruiting and onboarding cost $15,000 before the first call is made. After that the rep costs $21,000 a quarter (salary, commission, payroll taxes, software seats). Gross margin from the rep’s closed deals ramps slowly: nothing in the first quarter, $9,000 in the second, $24,000 in the third, and $36,000 a quarter from the fourth on. The owner discounts at 3% a quarter and counts two years.
| Quarter | Margin from deals | Rep cost | Net cash | Discount factor at 3% | Present value |
|---|---|---|---|---|---|
| 0 (today) | $0 | $15,000 | -$15,000 | 1.0000 | -$15,000 |
| 1 | $0 | $21,000 | -$21,000 | 0.9709 | -$20,388 |
| 2 | $9,000 | $21,000 | -$12,000 | 0.9426 | -$11,311 |
| 3 | $24,000 | $21,000 | $3,000 | 0.9151 | $2,745 |
| 4 | $36,000 | $21,000 | $15,000 | 0.8885 | $13,327 |
| 5 | $36,000 | $21,000 | $15,000 | 0.8626 | $12,939 |
| 6 | $36,000 | $21,000 | $15,000 | 0.8375 | $12,562 |
| 7 | $36,000 | $21,000 | $15,000 | 0.8131 | $12,196 |
| 8 | $36,000 | $21,000 | $15,000 | 0.7894 | $11,841 |
| Total | $30,000 | $18,912 |
(Rows are rounded to the dollar, so they add up to $18,911; the unrounded total is $18,912.)
Without discounting, the hire brings in $30,000 over two years. In today’s money it’s worth $18,912, because the costs come early and the margin comes late. At 6% a quarter the same table gives $10,079. Still positive, so the hire clears both rates.
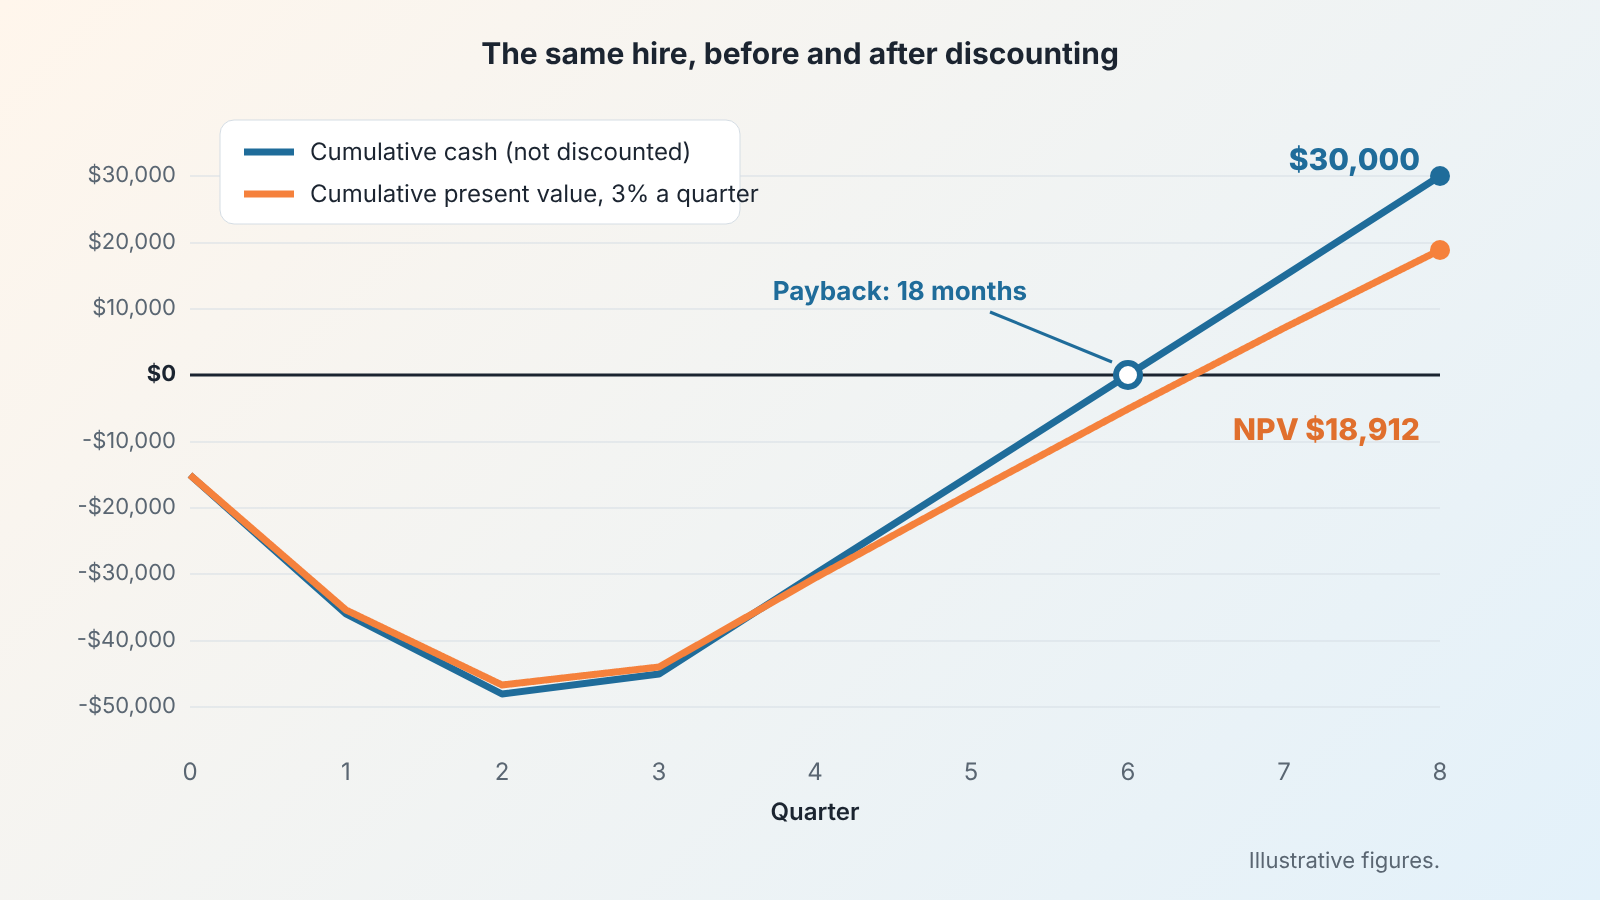
Now look at the same hire through the rule most owners hear first, that a hire or a tool should pay for itself within a year. After four quarters this rep is still $30,000 in the red, and cumulative cash only reaches zero at the end of quarter 6, which is 18 months. By the one-year rule you’d turn down a hire worth $18,912.
We don’t use that rule to make the decision. Payback counts the months until the outlay comes back and then stops looking; Wikipedia’s payback period article says plainly that “Payback does not allow for the time value of money,” and the measure ignores every dollar earned after the break-even date. A rep who breaks even in month 18 and then produces $15,000 a quarter is a different purchase from a campaign that breaks even in month 11 and then ends. We keep payback for a second job, the one Wikipedia’s NPV article assigns it when it calls payback a measure of risk. It tells you how long you’re exposed. In this example the exposure is real: if the rep quits after quarter 6, cash is back to zero and the NPV of the whole exercise is -$5,125.
So take two questions to Monday’s meeting in place of “does this pay back in a year?” How deep does the hole get (here it’s $48,000 at the end of quarter 2), and can the business carry it? Will the rep stay past month 18? The split between the rep’s fixed pay and commission moves both answers, and fixed vs variable costs in deal economics covers that part.
A deal paid in installments, and a tool paid annually
A buyer agrees to a $60,000 contract and offers a choice. Either twelve monthly payments of $5,000, the first one a month from now, or the whole thing today in exchange for 10% off, which is $54,000. Which is the bigger deal?
| Option | Cash you receive | Present value at 1% a month | Present value at 2% a month |
|---|---|---|---|
| $54,000 today | $54,000 | $54,000 | $54,000 |
| 12 payments of $5,000 | $60,000 | $56,275 | $52,877 |
At 1% a month the installments win by $2,275. At 2% a month the up-front payment wins by $1,123. The two options are worth the same at about 1.66% a month, so the whole decision comes down to which side of that number your own rate sits on. An owner with spare cash and nothing urgent to spend it on can take the installments. An owner who is financing payroll on a credit line that costs more than 1.66% a month should take the $54,000.
The table also assumes all twelve payments arrive, on time. A payment in month 12 is worth $4,437 today at 1% a month if it comes and nothing if it doesn’t. If you’d put the odds of full collection below certain, multiply the later payments by that probability before discounting. Long payment terms also tie up cash you may need for the next hire; working capital, payment terms and open deals goes through that side.
The tool decision is the same arithmetic from the buyer’s chair. Say a sales tool costs $500 a month, billed at the start of each month, or $5,000 for the year paid today. Twelve monthly payments have a present value of $5,684 at 1% a month, so the annual plan is $684 cheaper in today’s money. What you give up is the option to cancel in month four. If you’re unsure the team will use the tool, that option can be worth more than $684.
NPV vs ROI vs payback period
These three numbers answer different questions about the same spending, and they can disagree. The rep above passes on NPV and ROI and fails a twelve-month payback test.
| NPV | ROI | Payback period | |
|---|---|---|---|
| What it tells you | Dollars of value added today, after the price of waiting | Profit as a ratio of the money invested | Time until the outlay is recovered |
| Counts the timing of cash | Yes | No | No |
| Counts cash after break-even | Yes, up to your horizon | Yes | No |
| Needs a discount rate | Yes | No | No |
| In the rep example | $18,912 at 3% a quarter | $30,000 net gain over two years on a deepest outlay of $48,000 | 18 months |
Wikipedia’s return on investment article defines ROI as the ratio of net income or profit to the investment; if you haven’t filled it in for your own team yet, our ROI formula for a sales team shows how. For acquisition spending specifically, CAC payback period is the payback version most small teams track.
Use ROI when two options last about the the same time and you want a quick ranking. Use payback to see how long you’re exposed. When the cash is spread over more than a year, or the options have different shapes (money now against money later), NPV is the one that compares them fairly.
Which inputs your CRM gives you and which it doesn’t
Open any deal record and you’ll find about half of what the formula needs.
What the CRM has:
- Deal amount, which is the starting point for the cash-in column. Convert it to gross margin before you use it.
- Expected close date and your average sales cycle length. These date the cash flows, a rep’s ramp in the example above is mostly sales cycle.
- Stage probability and historical win rate. Wikipedia’s NPV article describes risk-adjusted NPV as multiplying each cash flow by the estimated probability that it occurs, and the stage probability on an open deal is the closest thing a CRM has to that estimate.
- Closed-won history per rep, for a realistic ramp.
The rep’s cost, your margin and the discount rate come from outside the CRM, from payroll, your books and your accountant. The payment schedule depends on your setup. Look at a won deal that pays in parts and check where the installments are recorded, in a custom field, on product lines with billing terms or only in the contract. Wherever they sit, that’s the source for the cash-in column of an installment deal. Closed-won and cash collected are different dates too, and a deal won in March can pay its first invoice in May; closed-won vs cash collected covers that gap.
All of this depends on the CRM fields being honest. If close dates get pushed every month and amounts are placeholders the cash-flow column is fiction and the NPV built on it is too. The NPV spreadsheet stays with you and your accountant. SalesBond checks the CRM data underneath it: the free CRM audit looks at the last 30 days of your CRM and sends a PDF report with findings and what to fix, then a second PDF seven days later showing what changed. Check your CRM with SalesBond before you trust the deal amounts in a two-year table.
FAQ
What is a good NPV?
Any NPV above zero means the investment returns more than the discount rate you chose. Wikipedia’s NPV article treats an NPV of exactly zero as a point of indifference, where the decision should rest on other criteria. Between two options with the same horizon, the higher NPV adds more value.
What’s the difference between NPV and IRR?
NPV is an amount of money and IRR is a rate. Microsoft’s documentation for the Excel NPV function puts the link in one line: “IRR is the rate for which NPV equals zero.” In practice you find IRR by trying rates until NPV hits zero, and Excel’s IRR function does that search for you on the same cash flows; per Microsoft’s IRR function page (checked November 2026), it starts from a guess and repeats the calculation until the result is accurate within 0.00001 percent. In the installment example, 1.66% a month is that kind of break-even rate.
How do I calculate NPV in Excel?
Use =NPV(rate, value1, value2, ...), with one caution. According to Microsoft’s NPV function page (checked November 2026), the values “must be equally spaced in time and occur at the end of each period,” and a cash flow that happens at the start of the first period “must be added to the NPV result.” For the rep table that means =NPV(3%, quarters 1 to 8) + (-15000). Put the -$15,000 inside the function and every figure gets discounted one quarter too many. Lay the sheet out like the rep table, one row per period with a discount-factor column, and you have a reusable net present value calculator: change the rate or any cash flow and the total updates.
Can a negative NPV still be a sensible decision?
Sometimes. Wikipedia’s NPV article notes that an investment with a negative NPV “will not necessarily result in a net loss: it is just that the internal rate of return of the project falls below the required rate of return.” A hire with a slightly negative NPV at a demanding rate may still make money. It just makes less than the alternative you used to set the rate.


