
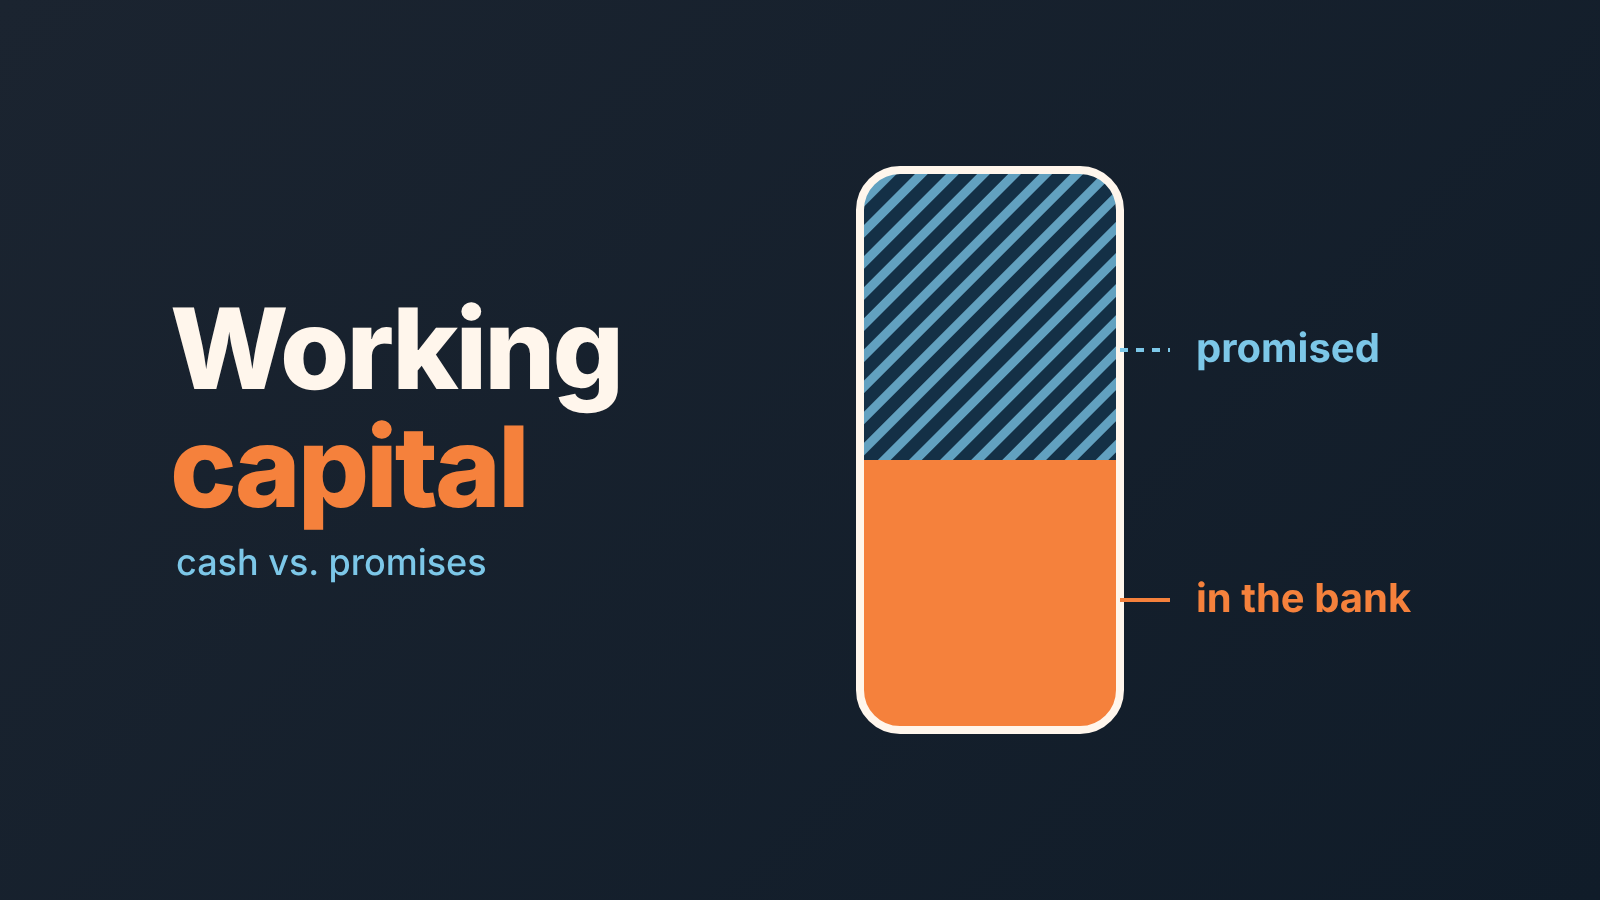
Working capital is current assets minus current liabilities, the short-term cash cushion a company runs on. The sales to working capital ratio, which AccountingTools calculates as annualized net sales divided by average working capital (checked November 2026), shows how many dollars of sales each dollar of that cushion supports. For a sales team the cushion shrinks in practice every time a deal is won on long payment terms and the money has not arrived, because payroll and suppliers fall due before the customer pays.
Most of what is written about working capital is for the person who computes it. The owner of a small sales-led company has a different question. The CRM says we had a good quarter. The bank balance says we did not. Both are true.
Working capital in one paragraph, and the formula
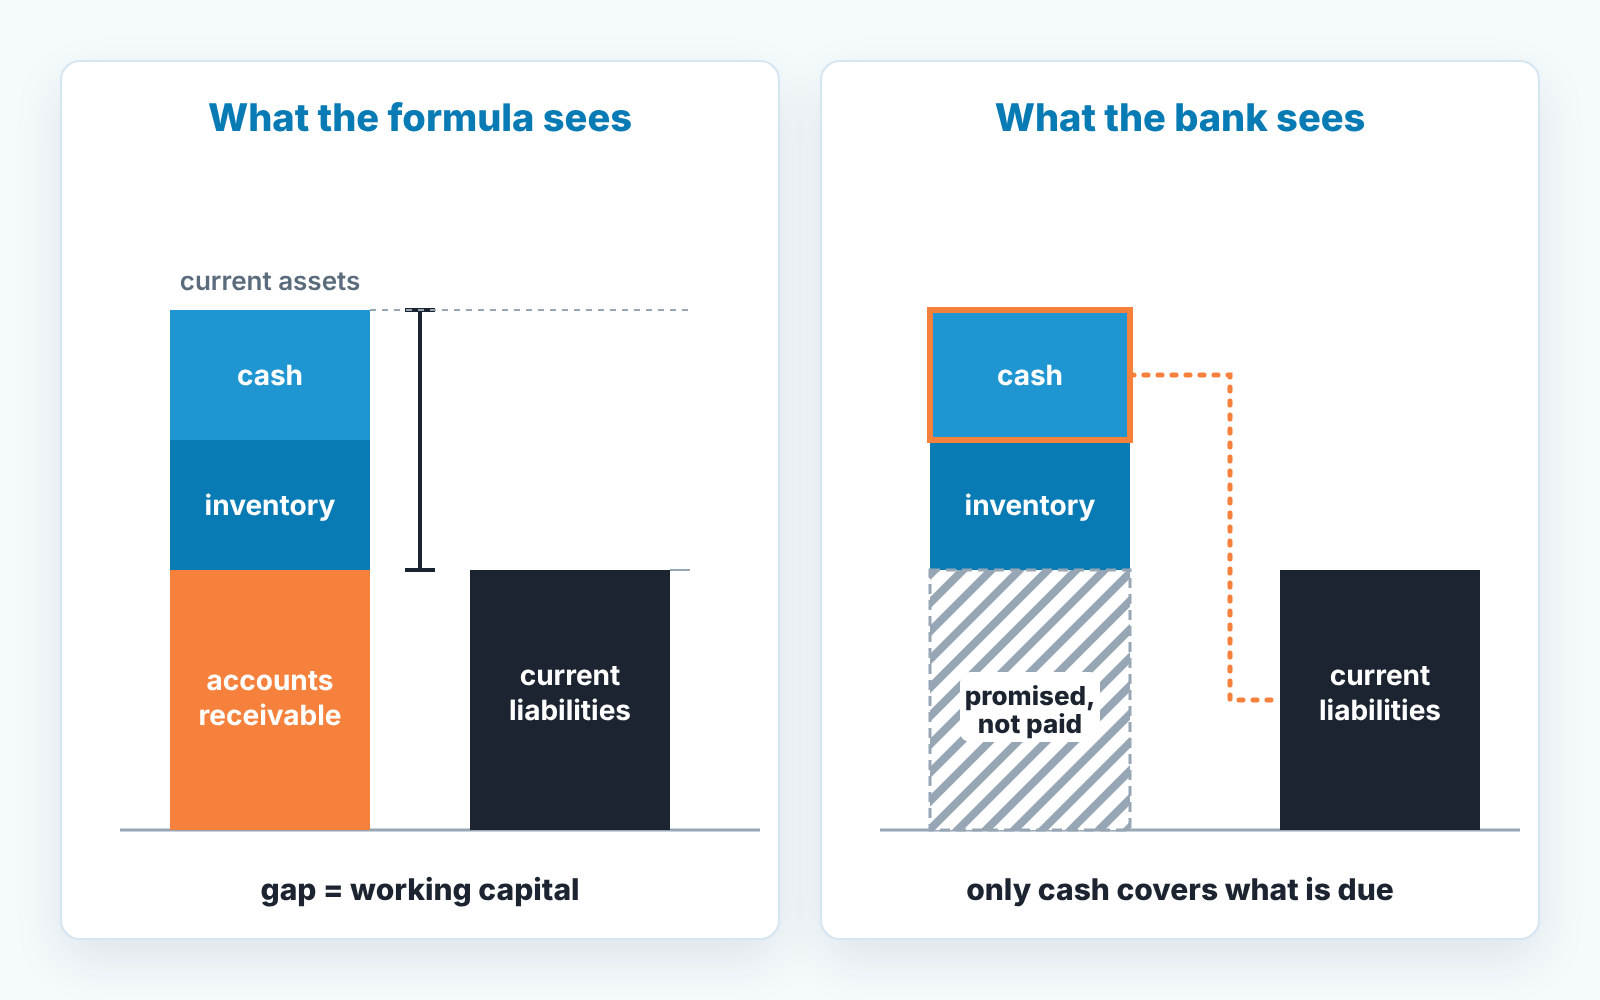
Current assets are what turns into cash within a year: cash itself, accounts receivable, inventory, prepaid expenses (Recurly glossary: Working capital). Current liabilities are what falls due within the same year: accounts payable, short-term loans, accrued expenses, taxes payable (Finley: What is working capital?). Subtract the second from the first.
How fast stock sells is measured by the inventory turnover ratio.
Working capital = current assets − current liabilities
So working capital is neither a current asset nor a current liability. It is the difference between the two. You will also see it called net working capital; in this article both names mean the same subtraction.
Finley’s worked example: $50,000 in cash, $100,000 in inventory and $75,000 in accounts receivable make $225,000 of current assets; $60,000 of accounts payable and $40,000 of short-term debt make $100,000 of current liabilities; working capital is $125,000 (Finley). A positive figure means the company can fund its short-term obligations from its own resources. A negative one signals it may need outside financing to keep running (Recurly).
Look at what sits inside that $225,000. One third of it is receivables. Money customers owe you counts as a current asset the day you invoice, long before it is in the bank. That is where the sales team enters the story.
The working capital ratio, and why a big number can still be thin
The working capital ratio (also called the current ratio) takes the same two inputs and divides instead of subtracting: current assets / current liabilities. Above 1.0 means more current assets than current liabilities; below 1.0 means the reverse and a possible liquidity problem. Many analysts treat a ratio of around 2.0 as a healthy target, though it varies by industry (Finley).
Recurly adds the point worth holding on to: a company can have a large working capital figure and still a thin ratio if its liabilities are almost as big as its assets (Recurly). For the owner reading a bank balance on Monday morning, the dollar amount is the one that matters. The ratio is mostly for the accountant and the bank.
Sales to working capital is the ratio that ties the cushion to the sales team. In AccountingTools’ version the denominator is accounts receivable plus inventory minus accounts payable (checked November 2026). With Finley’s figures that is $75,000 of receivables plus $100,000 of inventory minus $60,000 of payables, or $115,000. That is $10,000 less than the $125,000 of working capital in Finley’s example, because this version keeps only the operating lines and leaves out the $50,000 of cash and the $40,000 of short-term debt. Say the company sells $920,000 a year; on that base the ratio is 8.0 ($920,000 / $115,000). Now let longer payment terms push receivables to $135,000 while sales stay flat. The base grows to $175,000 and the ratio falls to about 5.3, so the same sales now hold $60,000 more of the owner’s cash. As a percent of sales, the base goes from 12.5% ($115,000 / $920,000) to about 19% ($175,000 / $920,000). AccountingTools suggests watching the ratio on a trend line, because in a steady business it stays fairly constant as sales change; a drop like this one means each dollar of sales now ties up more of the company’s money in receivables.
Why a good quarter can drain it
When your team wins a deal and invoices it on net 60, working capital on paper goes up. The receivable is a current asset, and the formula is right.
What goes down is cash. Take one illustrative deal: $40,000, won on March 3, invoiced on March 10 on net 60. Payroll for the people delivering the work runs on March 15 and March 31. The supplier bill for the same job is due April 9. The customer’s money is due May 9, and that is if they pay on time. For two months the company carries that deal out of its own pocket.
Recurly’s glossary puts it plainly: a business can show positive working capital and still run into a cash flow problem if its assets are not converting to cash fast enough (Recurly). Growth makes this worse: every extra deal on long terms is another receivable you fund until the customer pays.
That is why the headline total is not enough for an owner. Pull the receivables line out and look at it on its own: how much of our cushion is cash, and how much is promises? The cash flow statement answers the “how much actually arrived” half of that question, and a cash flow forecast from your pipeline estimates when the rest will land. How fast the receivables line turns is accounts receivable turnover, and the road from closed-won deals to spendable cash is free cash flow for a sales owner. How long the money sits in receivables is decided on the sales side.
Four things sales decides before finance ever sees the deal
Finley’s advice for improving working capital reads like a finance checklist: invoice as soon as the work is delivered, give customers a reason to pay early, set credit terms, send reminders (Finley). Read it from the sales side and most of it is decided by the rep, on the deal, before accounting has heard of the customer.
Payment terms come first. Net 30 or net 60 is a line in the proposal, and reps often treat it as a formality the customer fills in. On net 30 the company funds the deal from its own cash for thirty days after the invoice goes out. We wrote about how to answer when procurement asks for longer terms in the net 60 request; the short version is that terms are something you trade for, and you don’t give them away for free.
What you owe suppliers runs on its own clock, measured as days payable outstanding (DPO).
Then deposits and milestones. A deposit on signing turns part of the receivable into cash on day one, and the rep decides whether to ask for one. Until the work is delivered, a paid deposit also sits among the liabilities for a sales owner.
Invoice timing is the quiet one. “Invoice on delivery” and “invoice on acceptance” can be weeks apart, and the contract the rep negotiated sets which one applies. A staged deal can carry an invoice per stage. If nobody writes that into the proposal, the default is one invoice at the end.
And follow-up. Reminders are a finance task in the glossaries. In a small company the person who has the customer’s mobile number is the rep who sold the deal, and a friendly “did the invoice reach the right person?” from them two weeks before the due date does more than a statement from accounting two weeks after. We think this belongs in the sales process, with the rep’s name on it.
None of these change the formula. They change how fast the receivables segment turns into cash, which is the only part of working capital a sales owner actually controls.
Slow-paying receivables also tie up assets, which pulls down return on assets even when revenue is fine.
Receivables are capital too, and return on invested capital shows what that tied-up money earns.
Where this shows up in your CRM, and where it doesn’t
A CRM will not calculate working capital. It does not know your payables or your inventory. What it can hold is three facts about each won deal that decide how long it sits in receivables. The field names below are generic; any of the common CRMs lets you add custom fields to the deal record.
The stock part of that picture is days inventory outstanding: it shows how long goods sit before a deal.
A payment terms field on the deal
A single-select: prepaid, net 15, net 30, net 60, custom. Make it required at the won stage, so reps are not guessing on day one. The payoff is a filter: won deals this quarter grouped by terms. Say you find that 70% of yours are on net 60 (your own share will be whatever it is). Then you have found the reason the bank balance lags the pipeline, and it has nothing to do with collections. The DSO article walks through this field in HubSpot; the idea is the same anywhere.
An invoice date field
A date, copied from accounting when the invoice goes out. Empty means the deal is won and not yet invoiced. That is the most expensive state a deal can be in: you have promised delivery, you are probably doing the work, and the payment clock has not even started. A filter of “won, invoice date empty, won more than 7 days ago” is a list the owner should see every Monday.
Closed-won without payment
A payment status or paid date field, again copied from accounting. Accounting stays the source of truth for whether money arrived. But the filter “won, invoiced, past due date, not paid” is the sales owner’s receivables list, and it tells each rep which customers to call. The accounts receivable article goes deeper on that weekly check.
What the CRM cannot show is the other side of the formula. The balance sheet article draws that line in detail. In short, the CRM feeds one line of working capital, receivables, and the owner reads the rest from the accountant. SalesBond’s free CRM audit looks at that deal side too, reading the last 30 days of the connected CRM and sending a PDF report with money at risk and what to fix, then a second PDF a week later with what changed.
A monthly check in twenty minutes
Illustrative numbers, picked to make the mechanics visible; yours will differ.
- Take working capital from the accountant’s month-end balance sheet. Use Finley’s figures from above: current assets of $225,000 against current liabilities of $100,000 (Finley). That gives $125,000 of working capital and a ratio of 2.25 ($225,000 / $100,000).
- Pull the receivables line on its own. In that example it is $75,000, so a third of current assets is promises.
- Open the CRM filter of won deals from a recent window (say the last 90 days; pick whatever matches your sales cycle), grouped by payment terms. Note the share and value on net 60 or longer.
- Open the filter “won, invoice date empty”. Every deal on it is a receivable whose clock has not started. Give each one a name and a date.
- Open the filter “invoiced, past due, not paid”. Hand each rep thier own customers on that list before the planning meeting.
- Write down two numbers for next month: the receivables figure and the share of new won deals on terms longer than net 30. If both fall, the levers are working. If receivables fall but the share of long terms rises, you are collecting old deals while signing up the same problem again.
It does not replace the accountant’s view. It tells the sales owner which part of the working capital number is theirs to move.
FAQ
Is negative working capital bad?
Not always. It can mean a business will struggle to meet short-term obligations, but some companies run it deliberately because they collect from customers before they pay suppliers (Recurly). For a services or B2B company that sells on net 30 and net 60, it is rarely by design. It usually means receivables are not turning into cash fast enough to cover what is due.
How much working capital is enough?
There is no single number, and Finley notes that the target ratio varies by industry (Finley). We would add a sales owner’s test: enough is when the cash alone, with receivables left out, covers next month’s payroll and supplier bills without a credit line. If it only covers them with the the receivables counted in, your working capital is healthy on paper and fragile in the bank. Start with the terms on the next deal your team signs.


