
Inventory turnover ratio shows how many times a business sells and replaces its stock in a period: inventory turnover = cost of goods sold ÷ average inventory. Divide 365 by the ratio and you get days in inventory (the average number of days stock waits for a buyer). Sales moves it too. Every closed-won deal adds to cost of goods sold, and every discount decides how much margin you gave up to get there. Stock levels and their cost live in your inventory or accounting system, and a CRM doesn’t hold them.
Most guides on this ratio are written for the warehouse and the finance desk. This one’s for the owner or head of sales at a company that sells physical goods, the person who signs off on a 25% discount and later wonders where the cash went. It follows one illustrative company from start to finish.
Inventory turnover ratio formula, piece by piece
Wikipedia’s article on inventory turnover (checked November 2026) gives the standard version as cost of goods sold divided by average inventory at cost, and the most basic average as (beginning inventory + ending inventory) ÷ 2 (Wikipedia: Inventory turnover).
Two inputs, then.
Cost of goods sold (COGS) is what you paid for the goods you sold in the period. It comes from the income statement. If the term is new, our guide to the gross margin formula and COGS walks through it with deal data.
Average inventory is the value of stock you held, at cost, averaged over the same period. Opening and closing balances from the balance sheet are the minimum. The same Wikipedia article notes that multiple data points, such as an average of monthly averages, give “a much more representative turn figure”. For a seasonal business that matters a lot, since a December 31 count taken right after the holiday rush says little about July.
There’s also a per-item version. Wikipedia lists a unit formula used by some software: units sold in the period ÷ average units on hand. Keep that one in mind, because it’s the version where sales data helps most.
Inventory turnover in days
How long does a dollar of stock sit before someone buys it? Tell a sales team the ratio is 4 and nobody reacts; tell them the average item waits 91 days for a buyer and they do.
That waiting time is days in inventory, also called days inventory outstanding (DIO) in Wikipedia’s days in inventory article. The inventory turnover article gives the conversion: 365 ÷ inventory turnover ratio. The 365 assumes you calculated the ratio on a full year. If you ran the formula on one quarter, annualize it first. A quarter with $480,000 of COGS on $480,000 of average inventory gives 1.0 turn per quarter, which is 4.0 a year.
Put it next to days sales outstanding, which counts how long customers take to pay. Days in inventory covers the stretch before that clock even starts, while the goods are still on a shelf.
A worked example with the numbers checked
This is an illustration, with round numbers chosen to be easy to follow. Say a distributor of commercial kitchen equipment has a five-rep sales team and reports the following for the year.
| Line | Figure | How it’s calculated |
|---|---|---|
| Net sales | $3,200,000 | from the income statement |
| Cost of goods sold | $1,920,000 | from the income statement |
| Gross margin | 40.0% | ($3,200,000 − $1,920,000) ÷ $3,200,000 |
| Inventory on January 1, at cost | $400,000 | opening balance |
| Inventory on December 31, at cost | $560,000 | closing balance |
| Average inventory | $480,000 | ($400,000 + $560,000) ÷ 2 |
| Inventory turnover | 4.0 | $1,920,000 ÷ $480,000 |
| Days in inventory | about 91 | 365 ÷ 4.0 = 91.25 |
So the company sells through its stock four times a year, and a typical dollar of inventory waits about three months for a buyer.
Read in days, the same figure is days inventory outstanding, about 91 for this company.
Now the part that involves the sales team. Inside that $560,000 closing balance sits a $60,000 lot of an older oven model, list price $100,000. Suppose the reps had closed it in December at 25% off, for $75,000, which the table below sets against the year as reported.
Stock is one of the assets the asset turnover ratio divides revenue by.
| Line | Without the clearance deal | With it |
|---|---|---|
| Net sales | $3,200,000 | $3,275,000 |
| Cost of goods sold | $1,920,000 | $1,980,000 |
| Closing inventory | $560,000 | $500,000 |
| Average inventory | $480,000 | $450,000 |
| Inventory turnover | 4.0 | 4.4 |
| Days in inventory | about 91 | about 83 |
| Gross profit | $1,280,000 | $1,295,000 |
| Gross margin | 40.0% | 39.5% |
One discounted deal took eight days off the figure and added $15,000 of gross profit, while the margin percentage slipped half a point. On the lot itself the margin was 20% ($15,000 on $75,000), half the company’s usual rate.
Was it a good deal? That depends on what the ovens would have fetched in six months, and on what the freed $60,000 buys next.
What is a good inventory turnover ratio?
A good inventory turnover ratio holds steady or improves against your own history and sits in a sensible range for businesses in your industry; there is no single number that fits every company. We aren’t printing an industry benchmark table here, because we couldn’t find an open, dated source for one that we could check ourselves.
Wikipedia’s article is blunt that only comparisons within an industry are appropriate. A supermarket sells fast-moving goods and turns stock quickly, while a car dealer sells slow-moving items and turns it slowly. Even inside one industry, it adds, turns vary with product variety, the extent of price discounts and the structure of the supply chain. It also notes that some compilers of industry data, Dun & Bradstreet among them, put sales in the numerator instead of cost of sales. Keep that in mind the moment someone hands you a benchmark.
The practical benchmark is your own history. Calculate the ratio the same way for the last eight quarters and look at teh direction. Is it drifting down while sales grow? Then stock is piling up faster than you sell it. For an outside reference, you’d ask your accountant or trade association for figures on businesses your size, and check which formula they used before you compare.
Is a higher inventory turnover ratio better?
Not always. A high ratio can mean you’re running short of stock, or that you sold at a discount to move it, so it only makes sense next to gross margin. Ask around and you’ll be told to push turnover up anyway. We don’t agree with that as a blanket rule, and we’d keep it off the sales team’s scorecard entirely.
Look back at the arithmetic above. A ratio rises when COGS goes up or average inventory goes down, and both can happen for bad reasons. Wikipedia’s article says a high turnover rate may indicate inadequate inventory levels, which can lead to lost business and stock shortages. The same article notes that firms may reduce prices to generate sales in an effort to cycle inventory. A rep who’s paid to clear stock will clear it, at whatever discount the approval process lets through.
In the example 4.4 turns at a 39.5% margin was a reasonable trade. Reaching the same 4.4 by discounting half the catalog would make for a much worse year, and the ratio alone won’t tell you which of the two you had.
How to improve inventory turnover from the sales side
Sales has three levers for improving inventory turnover: discounts on slow stock, pre-orders, and the pipeline as a signal to whoever buys the stock. Each one shows up in deal records, in a discount field, a close date or a product line.
The oven lot from the example is the typical discount case. If you run a clearance, name the items, set a floor price and an end date, send anything below the floor through discount approval, and record the discount on the the deal so you can add up what it cost afterward. A custom deal field such as “Clearance discount %” is enough. A discount that’s only in a PDF quote won’t show up when you review the quarter.
Pre-orders and back-to-back orders work the other way round. When a deal is won before the goods are bought, those goods spend a few days in your warehouse on thier way to the customer. Average inventory drops and the ratio climbs without a cent of discount. You’ll pay for it in lead time, since customers wait longer for delivery, and your working capital depends on how supplier terms line up with customer payment terms.
Then there’s the pipeline. Whoever does your buying usually orders from past sales, and the pipeline knows something past sales don’t: which products are sitting in late-stage deals right now. If your CRM carries products or line items on deals, a weekly list of items in deals expected to close this month gives the buyer a reason to hold off on a reorder, or to place one early. It also shows the opposite case, where an item is piling up in the warehouse and appears in no open deal at all. How many of those do you have today?
Where the numbers live: CRM vs inventory and accounting
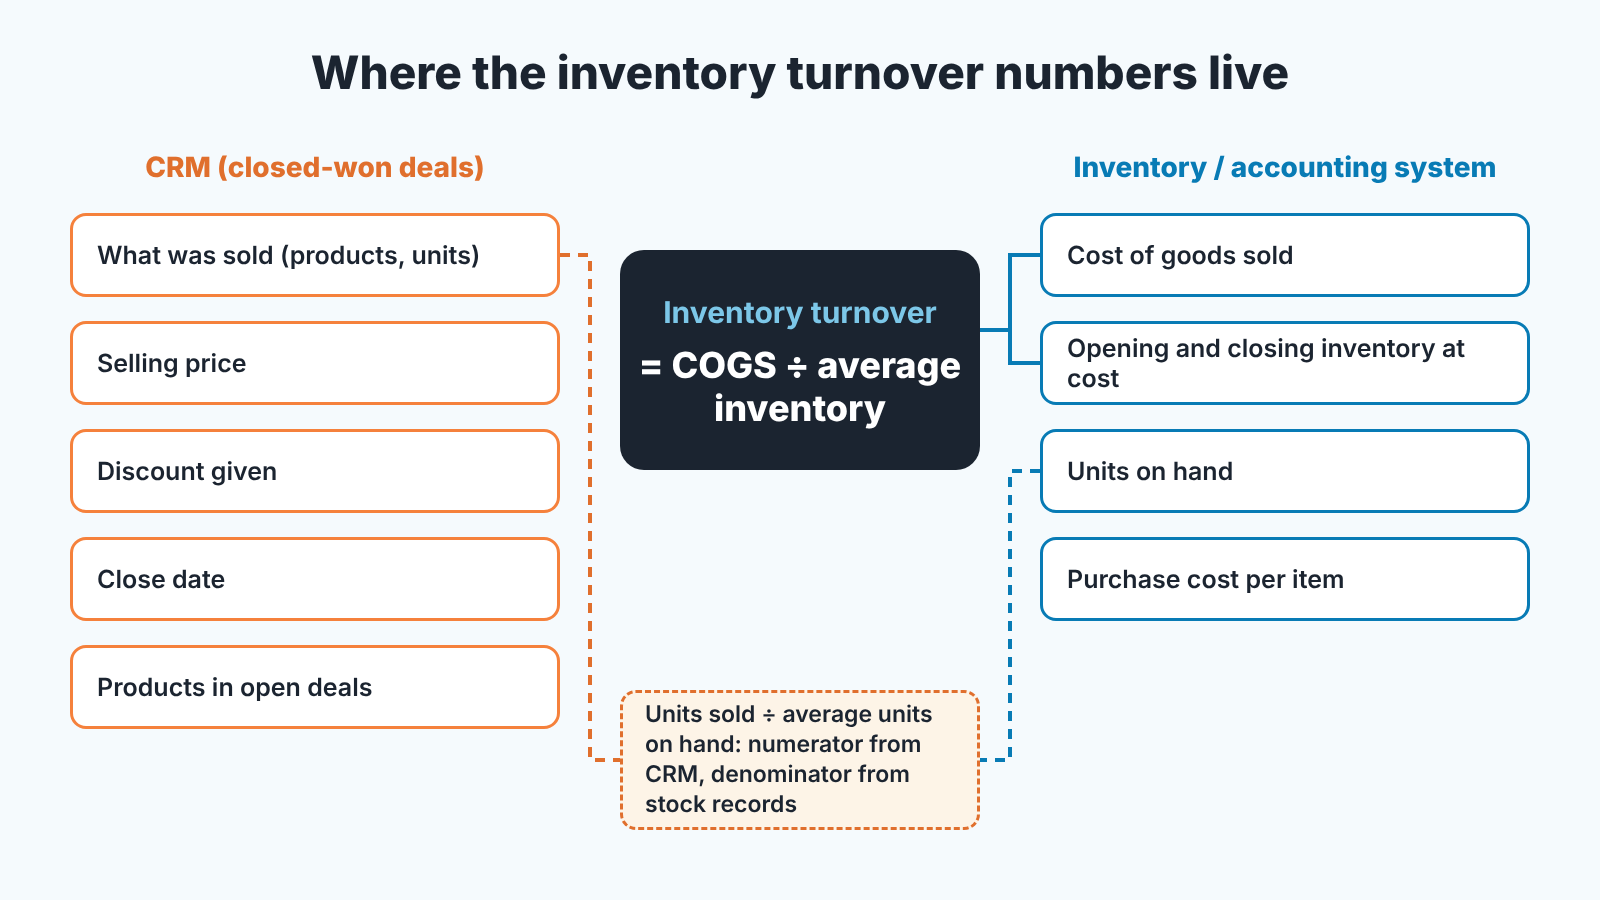
Open your CRM and look for the two inputs of the formula. You won’t find either. COGS and the value of inventory at cost are accounting figures, built from purchase invoices and stock counts, and they sit in your accounting or inventory software. The balance sheet is where the inventory balance is reported.
So what does a CRM hold? The selling side of every closed-won deal: who bought, when it closed, the price and the discount. If your team attaches products to deals, you’ll also see what was sold and how many units.
That’s enough for one honest calculation with the unit formula from earlier. Say the distributor’s won deals for the year contain 240 units of one mixer model, and the stock records show 80 units on hand on average. That’s 3.0 turns, or about 122 days in inventory for that model (365 ÷ 3.0 = 121.67). The unit count came from the CRM and the stock average from the warehouse, so both systems have to use the same product names or codes for the match to work.
Everything on the CRM side depends on deals being recorded properly, with real close dates and real amounts. SalesBond’s free CRM audit checks that side: it looks at the last 30 days of your connected CRM and sends a PDF report with a CRM score, findings and what to fix, then a second PDF seven days later with what changed. It doesn’t read stock or cost data. Check your CRM with SalesBond.
FAQ
Is inventory turnover calculated with sales or with COGS?
Both versions exist. Wikipedia’s article lists net sales ÷ average inventory at selling price alongside COGS ÷ average inventory at cost, and says cost of sales yields a more realistic ratio. Mixing them, with sales on top and inventory at cost underneath, is an easy mistake to make. In the example it gives $3,200,000 ÷ $480,000 = 6.7 turns where the true figure is 4.0, because the 40% margin inflates the numerator.
Can I use year-end inventory for the calculation?
You can, and Wikipedia lists it as the simplest option, but check how far it moves the answer. With the example’s closing balance of $560,000 the ratio is 3.4 and days in inventory come to about 106, two weeks more than the 91 from the averaged figure.
How often should I calculate it?
Quarterly is enough for most owners, monthly if stock is a large share of your cash. Whichever you pick, keep the formula the same from one period to the next, or the trend won’t mean anything.
Does a service business need this ratio?
If you hold no stock for resale, there’s nothing to turn over. Receivables are the equivalent place where cash waits, and accounts receivable turnover is the ratio to watch.


