
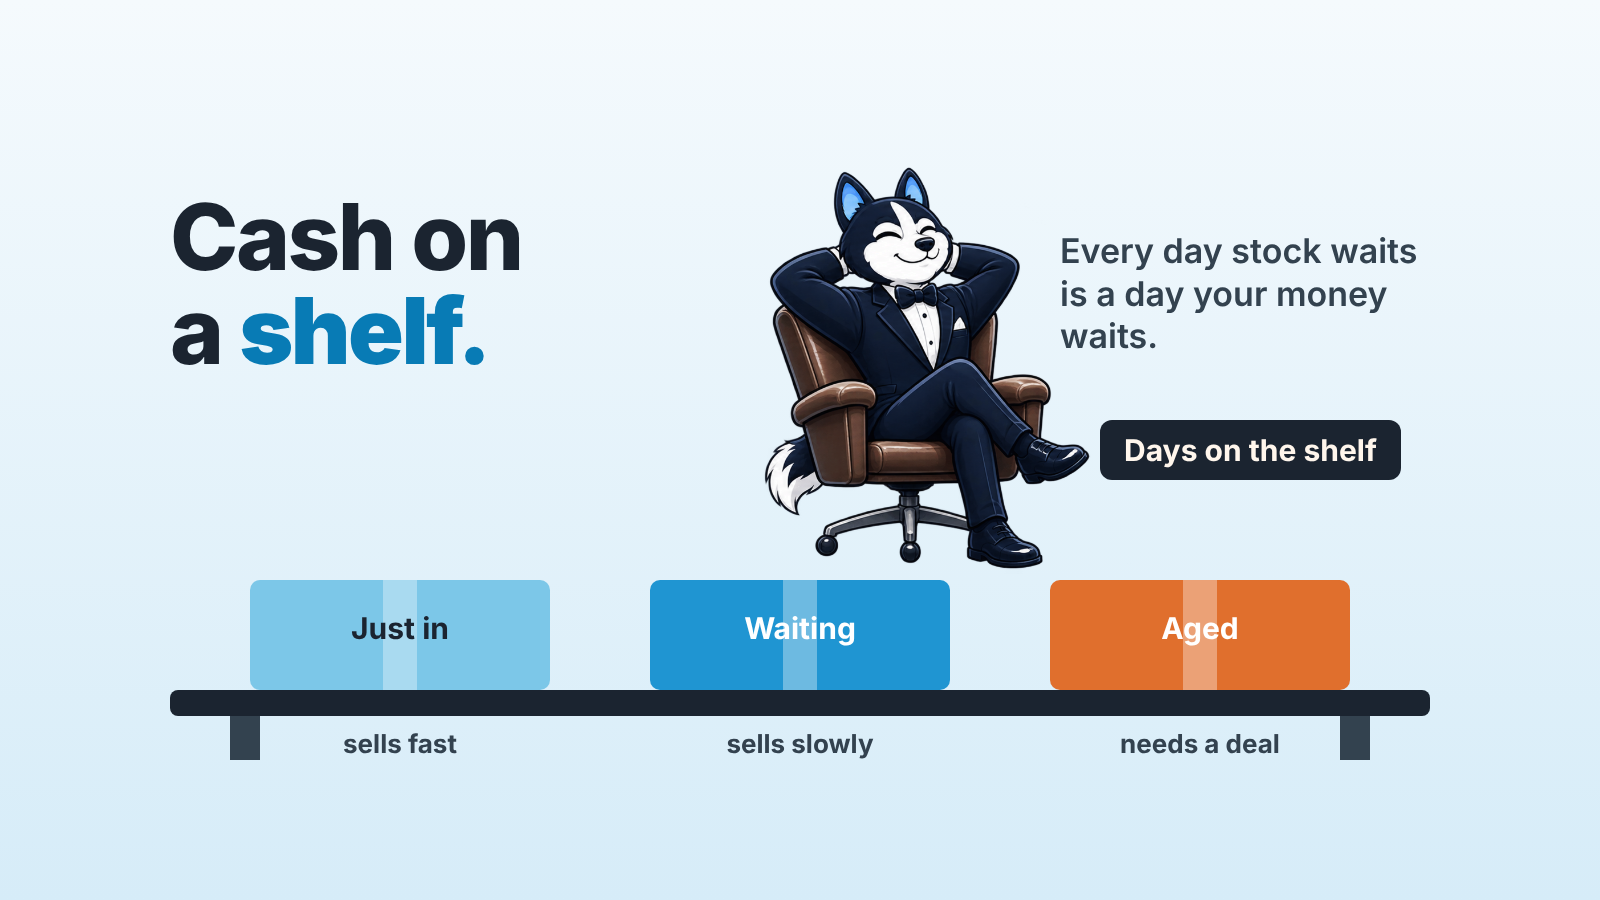
Days inventory outstanding (DIO), also called days sales of inventory (DSI), is the average number of days stock sits in the warehouse before it’s sold: DIO = average inventory ÷ cost of goods sold × number of days in the period. A lower number means stock turns into revenue sooner. For an owner, DIO is one of three figures in the cash conversion cycle (DIO + DSO − DPO), which counts the days between paying a supplier and getting paid by a customer.
Finance calculates DIO from the books. Sales decides a good part of it, though, because every aged pallet is waiting for a deal that nobody’s working, and you’d see that in the CRM long before the year-end stock count. This guide follows one made-up equipment wholesaler from the formula to the cash cycle and then to a monthly check that pairs the stock list with CRM deals.
How to calculate days inventory outstanding
Corporate Finance Institute’s page on days inventory outstanding (checked November 2026) gives the formula as average inventory divided by cost of sales, multiplied by the number of days in the period, with average inventory taken as beginning plus ending inventory divided by two.
Take an example company with invented numbers, a wholesaler of commercial coffee equipment. Its cost of goods sold for the year is $1,460,000, or $4,000 a day. Inventory at cost was $340,000 on January 1 and $380,000 on December 31, which averages $360,000. DIO is $360,000 ÷ $4,000 = 90 days.
So a machine that arrives at the warehouse waits about three months for a buyer, on average. Each of those days holds $4,000 of the owner’s cash on a shelf.
The usual mistake is dividing by revenue. In the example the wholesaler sells $2,190,000 a year ($6,000 a day), and $360,000 ÷ $6,000 gives 60 days, a full month better than the truth. Inventory is recorded at cost, so the daily figure under it has to be cost too. If you don’t have COGS to hand, our guide to gross margin and COGS shows where it comes from.
Running the formula on a quarter? Use the quarter’s COGS and the quarter’s days (90, 91 or 92). Keep the same choice every period so the trend means something.
DIO vs inventory turnover vs days sales of inventory
Your accountant says DSI, the bank’s form says DIO, and the report template says turnover. Two of those are one number. CFI’s DIO page lists “days in inventory” among its other names, and CFI’s separate page on days sales in inventory calls DSI “sometimes known as inventory days or days in inventory” and uses the same inventory ÷ cost of sales × days formula. A DIO of 90 and a DSI of 90 describe one fact.
Turnover is DIO flipped over. It’s COGS ÷ average inventory (how many times a year the stock sells through, which for the wholesaler comes to $1,460,000 ÷ $360,000, roughly 4.06 turns), and 365 divided by that brings you back to 90 days. The ratio, its averages and its benchmarks are in our inventory turnover ratio guide, and there’s no reason to repeat them here.
Which one goes on the owner’s page? Turnover works when you compare product lines or talk to a buyer. DIO works when the conversation is about cash, because days can be added to customer payment days and subtracted from supplier payment days.
The cash conversion cycle formula: DIO + DSO − DPO
DIO measures one leg. The cash conversion cycle adds the other two and tells you how long your own money is tied up from supplier invoice to customer payment.
Hit the number, empty bank account? That’s this cycle. CFI’s cash conversion cycle page writes it as DIO + DSO − DPO and notes that a shorter cycle is better. The CFA Institute’s Level I reading Financial Analysis Techniques (2026 curriculum) files days of inventory on hand under activity ratios and describes the cash conversion cycle as a liquidity measure that isn’t a simple ratio. The approach goes back at least to Verlyn Richards and Eugene Laughlin’s 1980 paper “A Cash Conversion Cycle Approach to Liquidity Analysis” in Financial Management.
Here is the same example wholesaler, one step at a time. Purchases for the year are taken as equal to COGS, which is close enough when the stock level barely moves.
- Average inventory of $360,000 divided by $4,000 of COGS a day gives a DIO of 90 days.
- Customers pay after $270,000 average receivables ÷ $6,000 sales per day, a DSO of 45 days.
- The company pays suppliers after $120,000 ÷ $4,000 purchases per day (DPO 30 days).
- Add the first two and subtract the third: 90 + 45 − 30 = 105 days of cash conversion cycle.
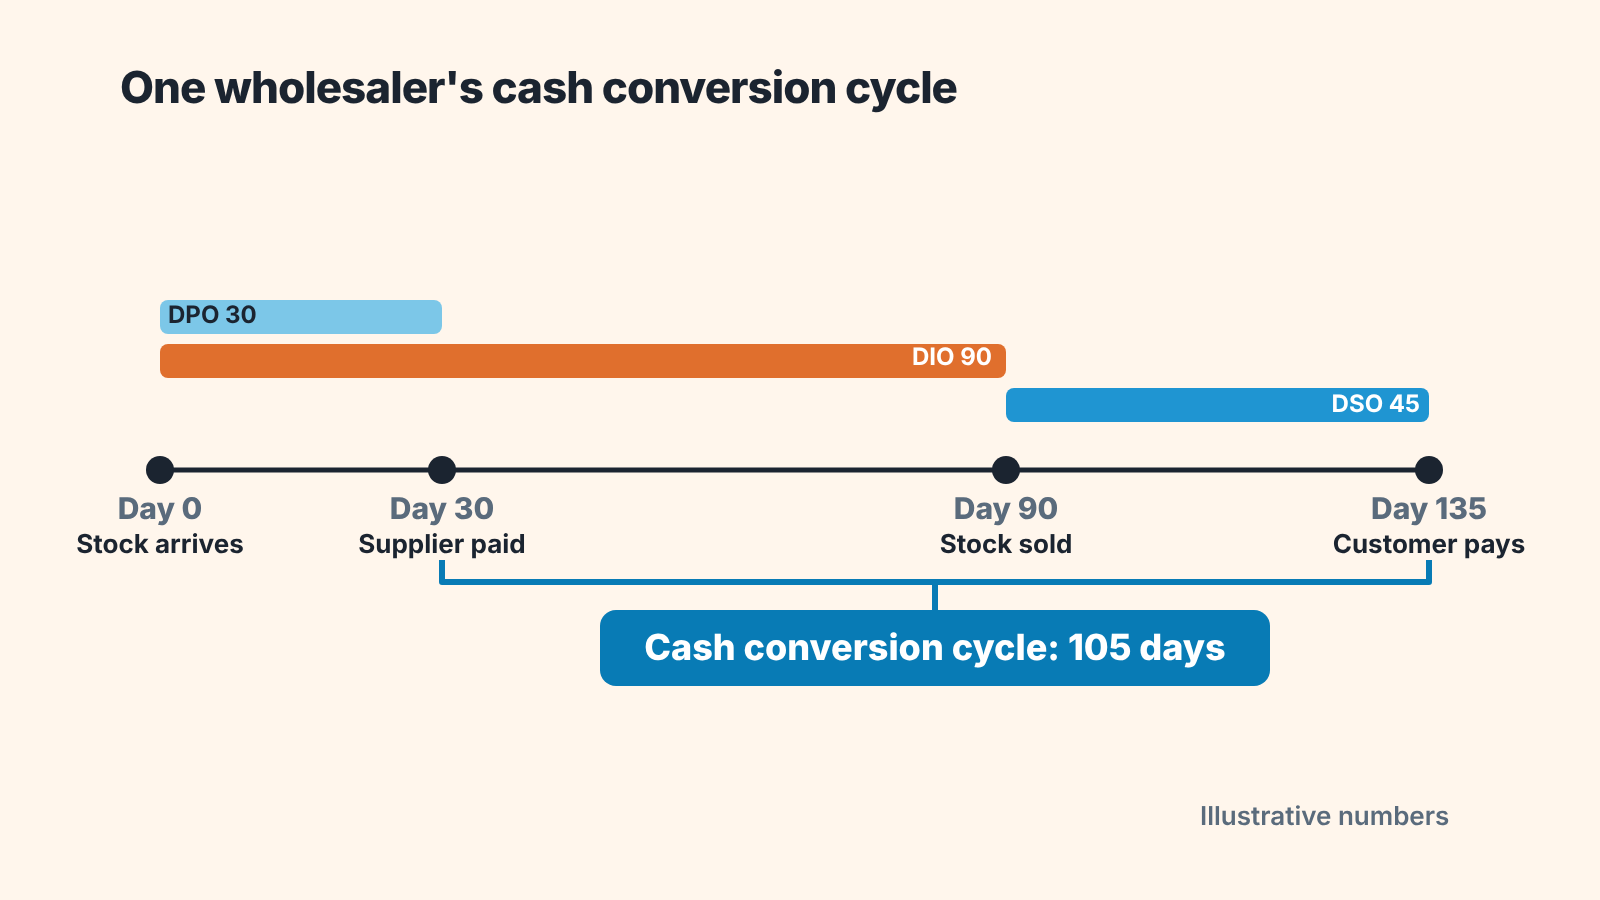
For 105 days the wholesaler has paid for a machine and hasn’t been paid for it. Stock accounts for 90 of those days.
Sales teams usually argue about the 45, the payment terms. We have separate guides on days sales outstanding and payment terms and on days payable outstanding for the other two legs. In this example, shaving five days off customer terms is a hard negotiation that moves the cycle from 105 to 100. Fifteen days off DIO frees $60,000 (15 × $4,000), and nobody has to renegotiate a contract.
Can the cycle drop below zero? Arithmetically, yes: if supplier terms are longer than stock days plus customer days, the sum turns negative and customers are funding teh inventory.
What sales changes in DIO: the aged pile
Search for how to fix a high DIO and the usual answer is “carry less inventory”, applied as a cut in purchasing across the board. We disagree with aiming that cut at the average. An average of 90 days is almost never 90 days for every product, and a blanket cut lands first on the items that sell, because those are the ones being reordered.
Split the example wholesaler’s stock. Say $90,000 of the $360,000 is in models with no sale in the last 180 days, and the remaining $270,000 produces nearly all of the $4,000 daily COGS. The stock that sells is running at 67.5 days ($270,000 ÷ $4,000). The other quarter of the warehouse has no DIO worth calculating, it just sits. Cut purchasing by 25% everywhere and you get stockouts on the grinders customers want while the aged espresso machines stay exactly where they were.
The fix belongs to sales and is aimed at that pile. Give reps a named list of aged models, a floor price and an end date. In the example, selling the $90,000 at cost brings in $90,000 of cash with zero gross margin on those deals, and once it’s gone the same sales pace runs on $270,000 of stock: DIO 67.5 days, cycle 82.5. Report clearance margin on its own line, or the monthly margin dips and someone bans the discount that was fixing the cash problem. Bundles, pre-orders and the risk of training customers to wait for clearance are covered in how to improve inventory turnover from the sales side.
What your CRM holds, and what it doesn’t
Ask a rep which products haven’t sold since spring and you’ll get a guess. The CRM can answer part of that question if deals carry products or line items (the feature name varies by CRM): which product was on each won deal, in what quantity, at what price and discount, and on what date. From those four things you can build units won per month for each product and the date of its last won deal. Open deals add a forward view, since a quote with twelve units of a model is demand that hasn’t reached the warehouse yet.
Stock on hand is missing. So are unit cost, receiving dates and purchase orders, everything that happens before the product meets a customer. Those live in the inventory or accounting system, which means a CRM can’t calculate DIO, and a dashboard that claims to is dividing by something else. What the CRM supplies is the reason behind the number. Maybe there are no deals, maybe the deals are small, maybe they’re stuck at quote.
The join between the two systems is the product code. If the warehouse calls it GR-200 and the CRM product is “Grinder 200 (new)”, fix that first.
A monthly check: slow-moving products against open deals
Once a month take two exports. From the inventory system (or the accountant, if that’s where stock is kept), pull every product with its quantity on hand, its value at cost and the date it was received. From the CRM, pull won deals by product for the last 90 days and open deals by product with quantity and stage.
Sort the stock list by value and look only at products where the value is high and the won-deal count for 90 days is zero or close to it. For each of those, the open-deal column tells you what to do. Open deals that cover most of the stock mean the product has buyers and the question is why those deals haven’t closed, which is a pipeline conversation with a named rep. No open deals at all means nobody is offering it, and the product goes on the clearance list with a floor price that week. A handful of old open deals with no next step is the worst case, since the stock looks spoken for and isn’t.
That last case depends on how honest the open deals are. SalesBond’s free CRM audit looks at the last 30 days of your CRM and sends a PDF report covering money at risk, deal health, the pipeline bottleneck and what to fix, and a second PDF arrives seven days later showing what changed. Your warehouse stays outside its view. The deals you’re counting as demand that have gone quiet show up in it. Check your CRM with SalesBond.
Keep the result short enough to read out at a sales meeting: five products, the cash in each, one owner per product.
What is a good DIO? When a high number is fine
There is no single good DIO; compare your figure with the same period last year and with companies in your own industry. CFI’s DIO page makes the industry point with its own example, food companies at around 6 days against steel at around 50, and its DSI page adds that a high figure can mean a company is holding stock to meet high customer demand.
Seasonal businesses build stock ahead of the selling months. Measure DIO in late October at a garden-furniture importer and it looks alarming; measure it in July and it looks heroic. Compare the same month year on year. Long lead times do something similar. If, say, a supplier ships by sea and an order takes ten weeks to arrive, running lean means running out, and a lost deal costs more than the shelf space. Wholesalers and distributors hold breadth because availability is what the customer pays for.
Was the stock bought against a plan, and is it selling at the planned pace? That’s the test in each case. High DIO with a plan behind it belongs in the working capital budget. High DIO made of models nobody has quoted since last year belongs on the the clearance list.
FAQ
Is DIO the same as DSI?
Yes. Days inventory outstanding, days sales of inventory and days in inventory all describe inventory divided by cost of goods sold per day, as CFI’s pages on DIO and DSI show.
How do you calculate days sales of inventory?
Divide average inventory by cost of goods sold for the period and multiply by the days in that period. In the example above, $360,000 ÷ $1,460,000 × 365 = 90 days.
How does DIO relate to inventory turnover?
DIO equals 365 divided by the annual inventory turnover ratio; the inventory turnover guide covers the ratio itself.
Can I calculate DIO from CRM data?
No. The formula needs inventory value and cost of goods sold, and those don’t live in the CRM; they’re in the inventory or accounting system. The CRM adds units sold by product and open deals by product, which explain why a product’s days are high.
Does a discount on old stock lower DIO?
It lowers DIO if the stock sells and isn’t replaced with more of the same. It also lowers gross margin on those deals, so decide the floor price before reps start quoting.


