
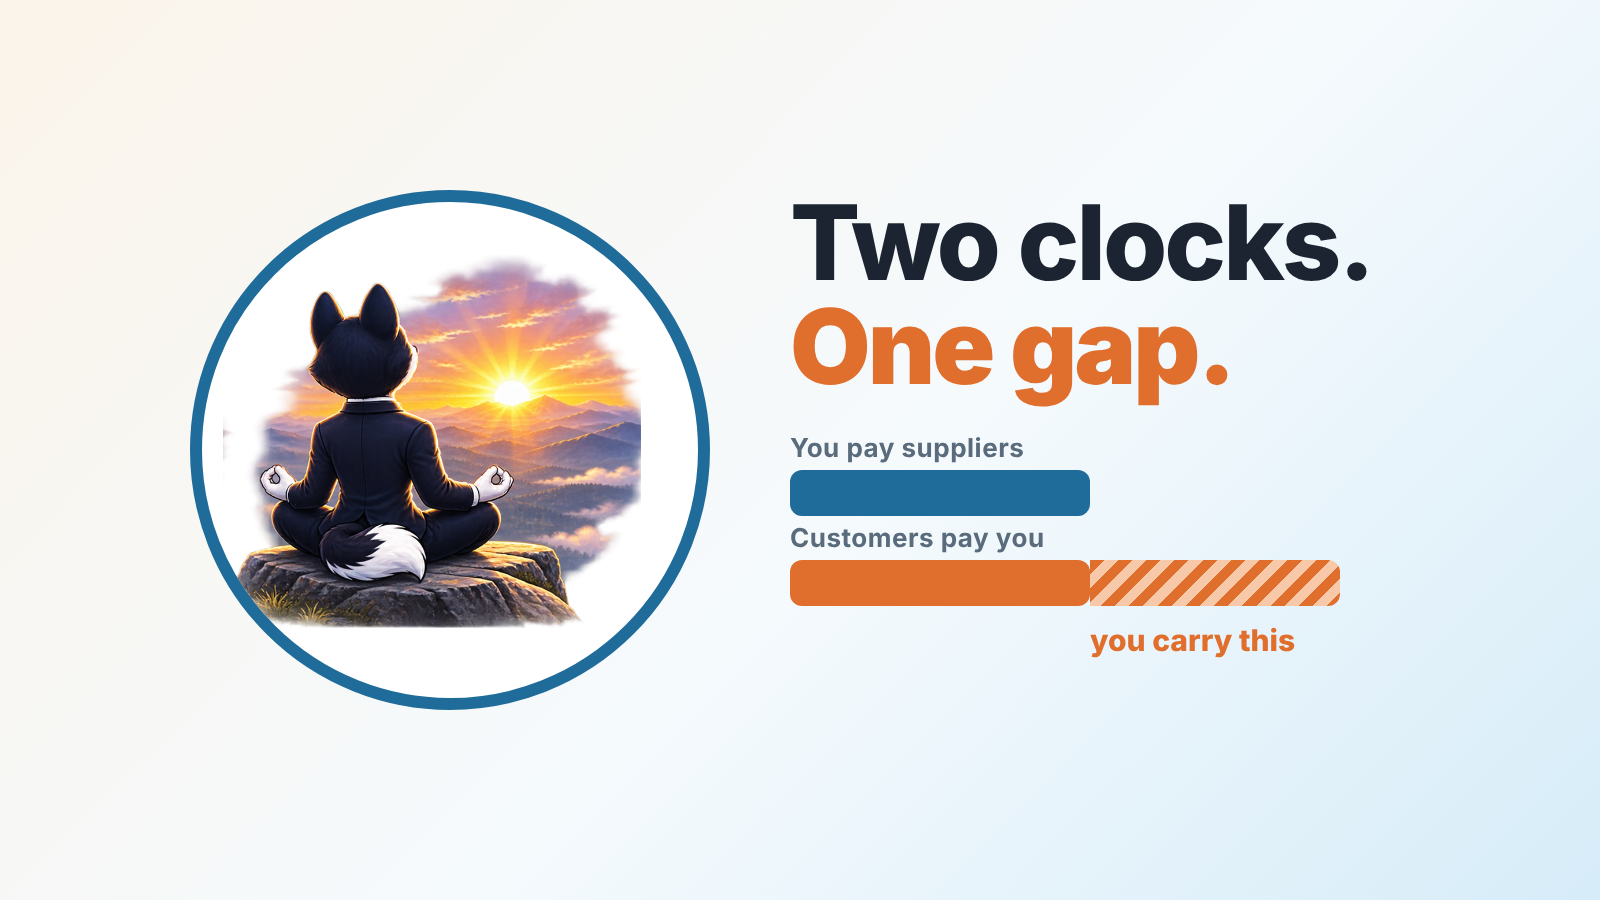
Days payable outstanding (DPO) is the average number of days a business takes to pay its suppliers. The formula is DPO = average accounts payable ÷ cost of goods sold × days in the period. A higher DPO means you hold supplier cash longer, and a DPO stretched too far puts supplier terms and early-payment discounts at risk. Read it next to DSO, the days customers take to pay you, because the difference between the two is the stretch of time you finance yourself.
This guide is written for an owner with a sales team. In that kind of business, customer terms get promised inside a deal and supplier terms get agreed somewhere else entirely, usually by someone else.
The days payable outstanding formula, piece by piece
Three inputs, all from your books.
Accounts payable is what you owe suppliers for goods and services already received. Wall Street Prep’s DPO guide (updated Dec. 9, 2024) writes the formula as “(Average Accounts Payable ÷ Cost of Goods Sold) × 365 Days” and lets you use either the average or the ending balance (Wall Street Prep, checked November 2026). Wikipedia’s version divides ending AP by “purchase per day”, which it calculates as yearly cost of goods sold divided by 365 (Wikipedia: Days payable outstanding, checked November 2026). Same idea with two slightly different numerators, and in the worked example below they end up five days apart.
Cost of goods sold sits in the denominator because it tracks what you buy from suppliers. Suppliers bill you at cost. Wall Street Prep’s guide treats this choice as one distinction between DPO and DSO (“COGS is used instead of revenue”), since COGS is the closer proxy for what you spend with vendors. Not sure what belongs in COGS for your business? The gross margin formula article walks through it with deal data, line by line.
Days in the period is 365 for a year, 90 for a quarter, 30 for a month. The AP balance and the COGS figure have to cover the same period.
A worked example: one quarter at a 12-person distributor
This is an illustrative example with made-up numbers. Say a 12-person distributor, five of them reps, closes a 90-day quarter like this:
| Line | Figure | How it’s calculated |
|---|---|---|
| Revenue for the quarter | $900,000 | from the P&L |
| Cost of goods sold | $540,000 | 60% of revenue |
| Accounts payable, start of quarter | $150,000 | from the balance sheet |
| Accounts payable, end of quarter | $210,000 | from the balance sheet |
| Average accounts payable | $180,000 | (150,000 + 210,000) ÷ 2 |
| COGS per day | $6,000 | 540,000 ÷ 90 |
| DPO | 30 days | 180,000 ÷ 540,000 × 90 |
| Accounts receivable, start of quarter | $380,000 | from the balance sheet |
| Accounts receivable, end of quarter | $420,000 | from the balance sheet |
| Average accounts receivable | $400,000 | (380,000 + 420,000) ÷ 2 |
| Revenue per day | $10,000 | 900,000 ÷ 90 |
| DSO | 40 days | 400,000 ÷ 900,000 × 90 |
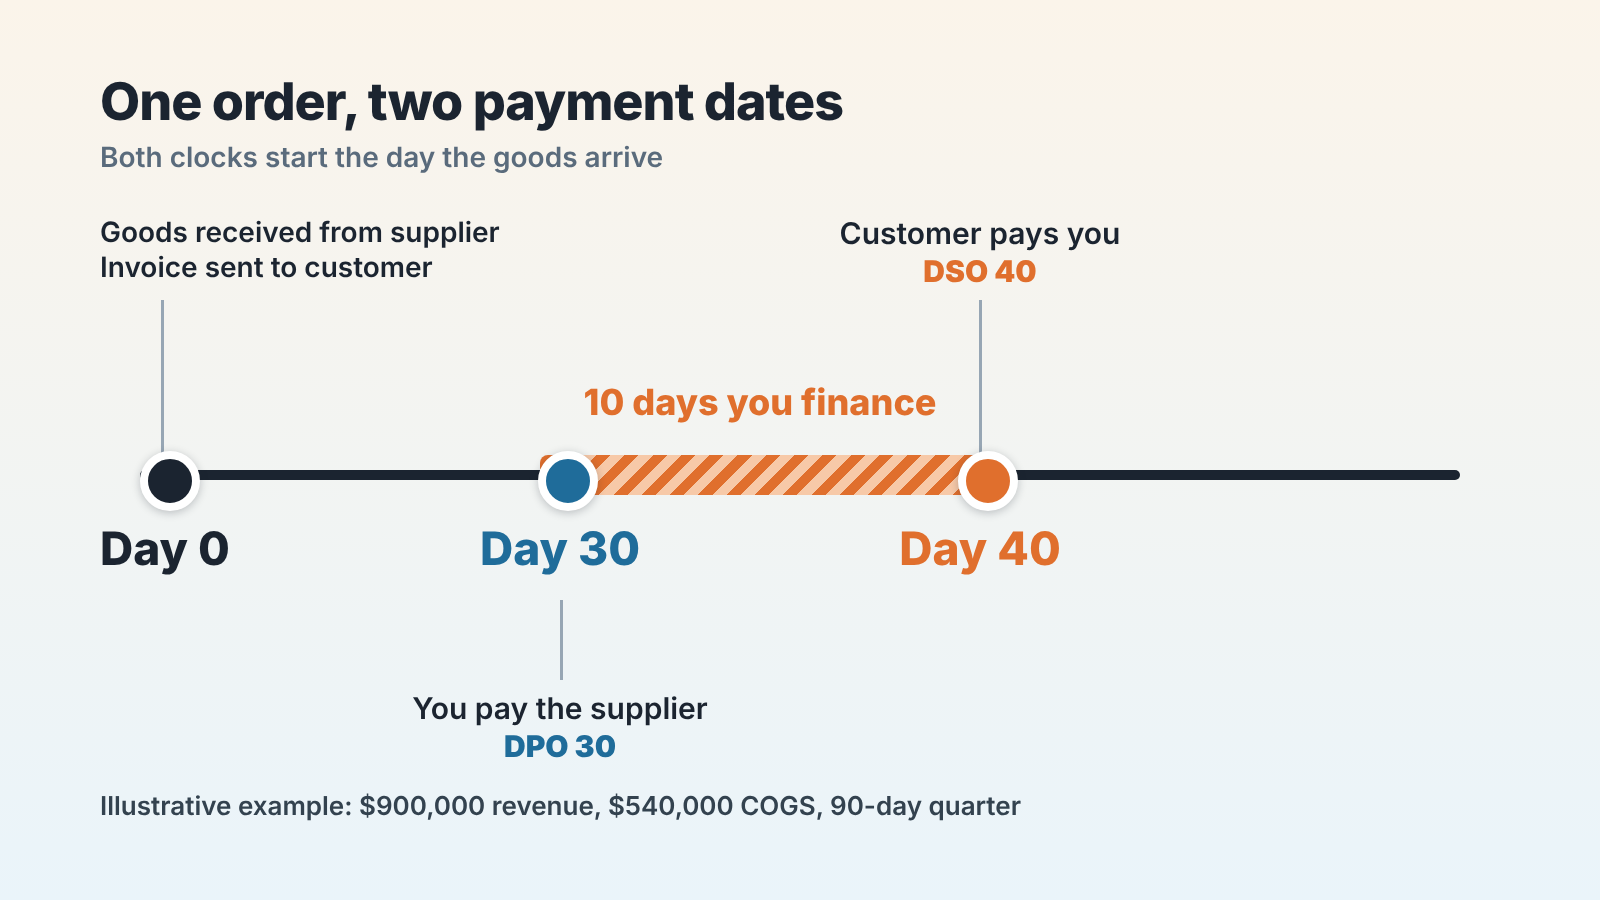
So this business pays its suppliers after about 30 days and waits about 40 days for its customers, which leaves a 10-day gap between the two.
Run the same quarter with the ending AP balance, the way Wikipedia writes the formula, and you get 210,000 ÷ 540,000 × 90 = 35 days. That’s five days of difference from the method alone, in a quarter where payables grew. Pick one method and keep it from period to period.
Is 30 days a good DPO for a small business?
The number alone won’t tell you, and we couldn’t find an open, dated benchmark for small businesses that we’d be willing to repeat here. Wall Street Prep’s guide gives no target figure either. Its one company example is Apple, with a DPO above 100 days from 2017 to 2019, and the same page explains where a number like that comes from: the more a supplier relies on one customer, the more room that customer has to negotiate.
A 12-person distributor doesn’t have Apple’s weight with suppliers. So what do you compare against?
Your own supplier terms, first. If most of your suppliers invoice on Net 30 and your DPO is 30 you’re paying on time. A DPO of 45 on Net 30 terms means bills are going out late. Wikipedia’s article warns that a high DPO “may reflect strong bargaining power with suppliers, but it may also indicate payment delays or financial stress.”
Then your own trend. A DPO that drifts from 30 to 38 over three quarters while supplier terms stayed the same is a question for your bookkeeper this week.
And then your DSO.
DPO vs DSO: the 10 days you finance yourself
DSO minus DPO is the number of days you carry your customers with your own money. DPO counts the days you take to pay suppliers and DSO counts the days customers take to pay you. Wall Street Prep’s DSO guide (updated Jul. 1, 2026) gives DSO as “(Average Accounts Receivable ÷ Net Revenue) × 365 Days” (Wall Street Prep: DSO, checked November 2026). Wikipedia’s cash conversion cycle article puts both into one line: inventory conversion period plus receivables conversion period minus payables conversion period (Wikipedia: Cash conversion cycle, checked November 2026). Leave inventory aside for a moment and what remains is DSO minus DPO.
In the example that’s 40 − 30 = 10 days. In dollars, customers owe the business $400,000 on average while open supplier bills average $180,000. The other $220,000 sitting in receivables has to be funded from margin already earned, the company’s own cash or a credit line.
The usual advice at this point is to pay suppliers as late as you can. For a sales-led business we’d start on the customer side, for two reasons.
The math first. One day of DPO in the example is worth $6,000 (COGS per day). One day of DSO is worth $10,000 (revenue per day). Stretching suppliers by five days frees 5 × 6,000 = $30,000. Collecting three days sooner frees 3 × 10,000 = $30,000 as well. Revenue is usually the bigger number, so a day won back from customers tends to be worth more than a day squeezed out of suppliers.
The second reason is control. Your team writes the customer terms. A rep who offers Net 60 to close a deal faster has just moved your DSO, often without telling anyone, and the Net 60 article shows how to price that request before saying yes. Supplier terms you have to negotiate, and you can lose that negotiation. Customer terms can sit in a field in your own CRM, if you’ve added one. The DSO and payment terms article covers that side in detail, and the working capital article shows how open deals feed into it.
Where payment terms live in your CRM, and what the CRM can’t show
DPO itself comes from accounting. Your CRM doesn’t hold an accounts payable balance or a COGS total, and no setting will change that. What a CRM can hold is the set of promises that later turn into DSO. Most CRMs let you add custom fields to a deal, so treat the names here as suggestions.
The field that matters most for this article is payment terms: a dropdown on the deal with fixed options (Net 15, Net 30, Net 45, Net 60, prepaid), so nobody types “30 days-ish”. Next to it, two date fields for invoice date and paid date. The gap between those two dates is the the real collection time for that deal. The supplier side of a deal, meaning expected cost and supplier due date, is covered field by field in the accounts payable article, so we won’t repeat it here.
With the payment terms field in place you can calculate the terms your team promised. Of the $900,000 won in the example quarter, say $630,000 closed on Net 30 and $270,000 on Net 60. The weighted average is (630,000 × 30 + 270,000 × 60) ÷ 900,000 = 39 days. Promised 39, collected in 40, supplier terms of 30. Now the conversation with the sales team has numbers in it. What would the quarter look like if the Net 60 deals had needed your sign-off?
The CRM can’t reach the supplier invoices themselves, the dates you actually paid them, or any bill that has nothing to do with a deal. Closed-won also says nothing about cash received , which is the subject of closed-won vs cash collected.
Fields only help if reps fill them in. SalesBond is a sales management layer on top of the CRM a team already uses, and its free CRM audit reads the last 30 days of your CRM and sends a PDF report with money at risk, a CRM score, findings and what to fix; seven days later a second PDF shows what changed. It doesn’t calculate DPO, since that needs your books. It is a quick way to see the state of your deal records before you add payment fields to them: Check your CRM with SalesBond.
Four ways stretching DPO goes wrong
Say a supplier offers a discount for paying early and you skip it to keep the cash. Wikipedia’s trade credit article uses the example of “net 30 and 2% discount if paid within ten days” (Wikipedia: Trade credit, checked November 2026). On $100,000 of purchases, paying on day 30 costs $2,000 more than paying on day 10. That’s 2% for 20 extra days of credit, and by our arithmetic (2 ÷ 98 × 365 ÷ 20) it works out to roughly 37% a year. Few credit lines cost that much. Ask your suppliers whether they offer such terms before deciding to pay later.
A rising DPO can also hide a late-payment problem. On paper it looks the same whether you negotiated longer terms or simply stopped paying on time, so check the aging report for bills past thier due date.
Then there are two calculation mistakes:
- revenue in the denominator, which in the example gives 180,000 ÷ 900,000 × 90 = 18 days and makes the business look like it pays in under three weeks when the real figure is 30;
- average AP one quarter and ending AP the next, which produced a five-day swing in the example with no change in behavior at all.
There’s a quieter cost too. Wall Street Prep’s DPO guide points out that a supplier who doesn’t depend on a customer may cut that customer off or require upfront payment. A small business is usually that customer. Would five extra days be worth it if your main supplier moved you to prepayment?
FAQ
How do you calculate DPO?
Three steps. Take average accounts payable for the period, divide it by cost of goods sold for the same period and multiply by the number of days in it. With $180,000 of average AP, $540,000 of COGS and a 90-day quarter, DPO is 30 days. Some sources use the ending AP balance instead of the average; either works if you use the same one every period.
What’s the difference between DPO and DSO?
Direction. DPO counts the days you take to pay suppliers and runs on cost of goods sold, while DSO counts the days customers take to pay you and runs on revenue (average accounts receivable ÷ revenue × days in the period). If your DSO is 40 and your DPO is 30, you’re funding 10 days yourself. Accounts receivable turnover is the same customer-side data expressed as a ratio.
Is a higher DPO always better?
No. It keeps cash in your account longer, but it’s also what you’d see with missed discounts, late fees or a supplier who tightens your terms. Compare DPO with the terms on your supplier invoices before calling it good or bad.
Can a CRM calculate DPO?
It can’t, because accounts payable and COGS live in your accounting system. A CRM can show the payment terms promised to customers, invoice and paid dates, and the expected cost of each deal.
This article is general information for owners and sales managers. It isn’t accounting or tax advice, so check your own figures with your accountant.


