
Accounts receivable turnover is net credit sales / average accounts receivable for the period, and it shows how many times a business collects what customers owe it. The accounts receivable to sales ratio looks at the same money from the other side, accounts receivable / net sales × 100, and a higher figure means more of your sales are still tied up in receivables (Inymbus glossary, checked November 2026). For a sales owner, the useful part is what moves both numbers: payment terms and invoice dates agreed in deals, which the CRM can show before an invoice goes overdue.
Both ratios are readouts from the books. What the accountant cannot tell you is why they moved, because the causes were decided months earlier, by a rep, in a deal.
The accounts receivable turnover formula
The accounts receivable turnover ratio in full is net credit sales / ((opening receivables + closing receivables) / 2). Net credit sales are the sales you made on credit in the period (invoiced, not paid upfront), minus returns and allowances. Average accounts receivable is usually the balance at the start of the period plus the balance at the end, divided by two (AccountingTools: accounts receivable turnover ratio).
The result is a plain number: how many times over the period the business turned its receivables into cash. A turnover of 6 means you collected the average balance six times in the year. A turnover of 3 means you collected it three times, so customers held your money twice as long. Receivables also sit inside the current ratio and the quick ratio, so the slower collection shows up there too.
Net credit sales is the part people trip on. Cash sales and prepaid deals do not create a receivable, so they do not belong in the numerator. If half your deals are paid upfront and you still divide total revenue by receivables, the ratio flatters your collections.
An accounts receivable turnover example, and the same ratio in days
Numbers for example only. Say the business invoiced $1,200,000 on credit terms over the year, with no cash sales.
- Customers owed it $180,000 on January 1 and $220,000 on December 31, so the average receivable balance is
(180,000 + 220,000) / 2 = 200,000, or $200,000. - Turnover is
1,200,000 / 200,000 = 6. - The accounts receivable to sales ratio uses the year-end balance,
220,000 / 1,200,000 × 100 ≈ 18%, so about 18% of the year’s sales were still unpaid on December 31.
Now turn it into days. Divide 365 by the turnover and you get the average number of days a customer takes to pay; accountants call this the collection period or days sales outstanding (AccountingTools: collection period and DSO). In the example, 365 divided by 6 is about 61 days. So on average an invoice from this business waits about two months before the money lands. Our DSO article covers that number from the sales manager’s side.
We prefer the days version in conversation with reps and managers. “Sixty-one days” means something to a person who agreed to net 30 on a quote. “Six times a year” does not.
Inventory has its own days figure, days inventory outstanding, which counts the wait before the sale instead of after it.
What counts as a “good” number
A good ratio is the one that matches the terms you actually give. If your standard terms are net 30 and the days version comes out near 30, customers are paying on time and the ratio is doing its job. If your terms are net 30 and the days version comes out near 60, you are financing your customers for a month that nobody agreed to, deal by deal.
So we do not publish a target number here, and we would be careful with any article that does. The ratio depends on the industry, on whether your customers are small businesses or procurement departments, and on how much of your revenue is prepaid. Compare it with your own previous periods and with your own terms. The working capital article shows what the same gap does to the cash you have to run the business.
What sales decides that moves the ratio
Finance blogs tend to stop at the formula, yet four decisions in the deal shape the ratio long before accounting sees an invoice.
Three of them are deal terms, and the DSO article walks through each one as a HubSpot deal property. Longer payment terms (“net 60” to close a slow buyer) grow the average receivable and pull turnover down, even if collections work as hard as ever. Prepayment, through a deposit or a pro forma invoice, takes that part of the deal out of receivables entirely. An early-payment discount speeds collection and cuts net sales at the same time, so the ratio goes up while the margin goes down; the contribution margin per deal article is where that second half lives.
The fourth decision, the date the invoice goes out, gets less attention. Closed-won on the 3rd, invoiced on the 24th, is three weeks in which the money is owed in practice but nobody tracks it, because it never appears on an aging report. The clock only starts when the invoice exists. Small companies lose a lot of time here, and it’s the easiest gap to fix, because it is a handoff problem rather than a customer problem. The quote-to-cash handoff article describes the handoff that stops it.
Where each input lives in the CRM
The CRM is not the ledger and will not compute the ratio. What it can do is hold the deal-level cause of every number in it, so that when the accountant says “turnover fell this quarter”, you can open a filter instead of asking around. The fields are custom in every CRM we work with, and the names below are suggestions.
The same goes for the inventory turnover ratio on the stock side.
Net credit sales starts with the deal amount plus a “Payment terms” dropdown (prepaid, net 14, net 30, net 60). Split won deals by month and by terms, and prepaid deals drop out of the numerator.
The receivable starts on the “Invoice date”, blank until the invoice is sent. The owner’s view: won deals with an empty invoice date, by rep.
It should end on the due date, which is either its own field or terms plus invoice date. Filter open deals past that date and group them by customer.
It actually ends when the money arrives. A “Payment status” field (unpaid, partly paid, paid) with a “Paid date” lets you count the days from invoice to payment, by customer and by rep.
Then there is the share you never wait for: a prepayment amount on the deal, or a pro forma stage before delivery. Its share of won revenue never becomes a receivable at all.
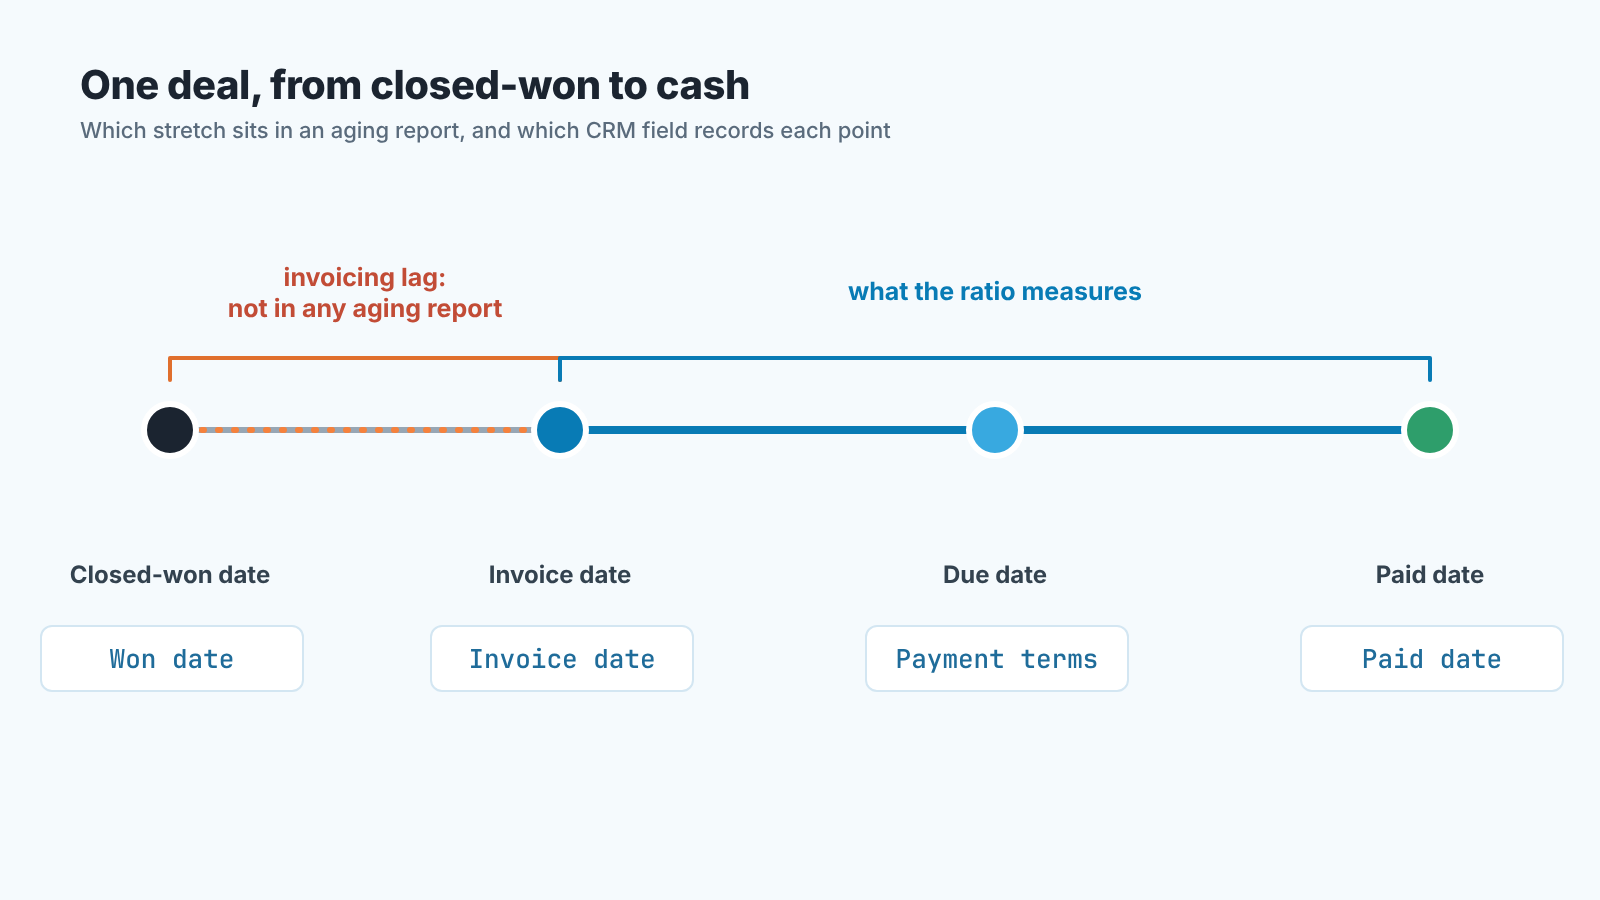
Who fills these fields, and why the rep should own terms while the office owns invoice and payment dates, is covered in the accounts receivable article on closed-won versus cash. We will not repeat it. The person who negotiated a value records it.
The weekly check that moves next quarter’s ratio
The ratio is a period figure. It moves slowly and it reports late, which is why the closed-won versus cash article argues that a small team does not need it weekly. What you track weekly is the two lists that will decide it.
First, won deals with an empty invoice date, older than a few days. Every one of these is a receivable that has not started its clock. Ask the rep why, and ask the the office why, because the answer is usually one of two: a PO number nobody chased, or a deliverable nobody confirmed. Both are fixable this week.
Second, invoiced deals past their due date, grouped by customer and read line by line. One customer who is thirty days late on three invoices needs a different conversation from three customers who are each a week late, and only a list per customer shows which of the two you have.
The deals that feed these lists need an amount and a close date to begin with, and that is where the check starts for us. In SalesBond, Deal Health checks every open deal against more than 20 rules in six categories, Data and Progression among them, and shows the specific violations with a recommended action for each, so fewer deals reach closed-won with a blank where the invoice data should go. It checks the deal side; it does not calculate receivables or read your accounting system.
Terms are agreed before the quote, not after
A pattern we have seen in several companies: the quote goes out with standard terms, the buyer says yes, and during contracting the buyer’s procurement team sends back net 60 or net 90. The rep accepts, because the deal is “already closed” in thier head and in the CRM. Finance finds out when the invoice is set up. The ratio finds out a quarter later.
The fix is a sequence of steps. Terms are a field on the deal from the qualification stage, the rep confirms them with the buyer before the quote is built, and a change to terms after the quote is treated like a change to price: it needs the same approval. The quote versus invoice versus estimate article lays out which document carries terms at which stage. The revenue versus profit article shows where that money lands on the owner’s side.
One sentence for Monday’s meeting: “If you need longer terms to close it, bring it to me before the quote, and bring the margin with it.”
Before you build the filters
None of the above works if the fields are empty. It helps to know first how many won deals in your CRM have no amount or no close date, and how much money sits in deals that have stalled. That is what the free CRM audit from SalesBond does: it reads the last 30 days of your connected CRM and sends a PDF report with money at risk, a CRM score, the top findings, managers, deal health and the pipeline bottleneck. Seven days later a second PDF shows what changed. It does not compute your receivables or touch your books; it tells you whether the deal data behind the ratio is there to be read.
Check your CRM with SalesBond and start with the report.
FAQ
What is the formula for the accounts receivable turnover ratio?
Net credit sales for the period divided by average accounts receivable for the same period, where average receivables is usually the opening balance plus the closing balance, divided by two (AccountingTools). Leave cash and prepaid sales out of the numerator.
What is a good accounts receivable turnover ratio?
The one that matches the payment terms you actually give. Convert it to days (365 divided by the ratio) and compare that with your standard terms and your previous periods. A published industry number tells you less than the gap between your own terms and your own days.
Is a high receivable turnover ratio good?
Usually. A higher ratio means customers pay sooner, which is good for cash. The two caveats: it can be high because sales are refusing credit to buyers who would have paid, and it can look high because prepaid deals were counted as credit sales. Check the numerator before you celebrate.
How do you calculate average accounts receivable?
Add the receivables balance at the start of the period to the balance at the end and divide by two. If your balances swing a lot from month to month, averaging all twelve month-end balances gives a fairer number; just use the same method every period.