

The asset turnover ratio is net sales divided by average total assets. It shows how many dollars of revenue the business produces for each dollar of assets it holds. Sales can push the top number up. The bottom one comes from the balance sheet in your accounting system, and you won’t find it in any CRM field.
What does the asset turnover ratio tell an owner?
The asset turnover ratio tells an owner how hard the assets are working. A ratio of 2.0 means every dollar tied up in the business (cash, receivables, stock, vans, equipment) produced two dollars of sales during the period. Wikipedia’s entry on asset turnover, as read in November 2026, also calls it total asset turnover or asset turns, writes the formula as net sales revenue over average total assets and describes it as a measure of how efficiently a company uses its assets to generate sales revenue.
Most explanations of this ratio are written for an investor comparing public companies. You sit somewhere else. You already know the business, so the useful question is narrower: did this year’s dollar of assets bring in more sales than last year’s dollar? And if it didn’t, which side of the fraction changed?
Profit doesn’t enter the formula at all. A company can turn its assets quickly on thin margins and still earn very little, so owners usually read the ratio next to a margin figure.
How to calculate the asset turnover ratio: formula and example
Start with the numerator. Net sales are gross sales minus customer discounts, returns and allowances, according to Wikipedia’s entry on sales in accounting (November 2026), and it’s the figure your income statement already reports on its top line. Take it from there. Our guide to which P&L lines a sales CRM feeds shows how that line is built.
Then the denominator. The same Wikipedia entry on asset turnover defines average total assets as total assets at the beginning of the period plus total assets at the end, divided by two. Both numbers sit on the balance sheet. For Year 1 below that’s $1,100,000 plus $1,300,000, halved, or $1,200,000.
Here is a worked example with made-up figures. Say a twelve-person commercial HVAC service company closes two years like this:
| Year 1 | Year 2 | |
|---|---|---|
| Net sales | $2,400,000 | $2,760,000 |
| Total assets, start of year | $1,100,000 | $1,300,000 |
| Total assets, end of year | $1,300,000 | $1,900,000 |
| Average total assets | $1,200,000 | $1,600,000 |
| Asset turnover | 2.00 | 1.73 |
Year 1 is $2,400,000 divided by $1,200,000, which gives 2.00. In Year 2 sales grew 15%, a good year by any sales meeting’s standard, and the ratio still fell to about 1.73 ($2,760,000 divided by $1,600,000). Assets grew faster than sales did. In this example the company added $250,000 of vans and equipment, and receivables rose by $350,000 because the team offered net-60 terms to win larger commercial contracts.
A word on the average. Wikipedia’s entry warns that the two-point method “can produce unreliable results for businesses that experience significant intra-year fluctuations.” If your receivables or stock swell every summer, a start-and-end average will miss the peak, and the entry advises using another formula for such businesses. Averaging the twelve month-end balances is one option. The entry also notes that some people use ending total assets alone; with that method Year 2 comes out at 1.45 ($2,760,000 divided by $1,900,000). Pick one method and keep it. Switch methods between years and your comparison mostly measures the switch.
What the sales team moves and what it doesn’t
Look at the Year 2 numbers again and ask who caused what.
The 15% growth in net sales belongs to the sales team. More won deals, larger deals and repeat orders all land in the numerator. Discounts cut it. Every discount a rep gives lowers net sales (a 5% concession on a $40,000 maintenance contract takes $2,000 straight off the top line), so a team that closes the same number of deals with smaller discounts raises the ratio without a single extra customer.
The vans belong to the owner. So does the decision to hold more cash, buy a building or finance new equipment. Those calls move the denominator however the the quarter went.
Two asset lines sit in between, and this is the part worth raising at your next pipeline review. Receivables are an asset. When a rep agrees to net-60 to close a deal, the revenue shows up now and the unpaid invoice sits on the balance sheet for two months, which is exactly what happened in the example. We cover that mechanism in the article on accounts receivable turnover. Stock works the same way for companies that sell goods: inventory bought against deals that slipped stays in total assets until it sells, and the inventory turnover guide goes through it.
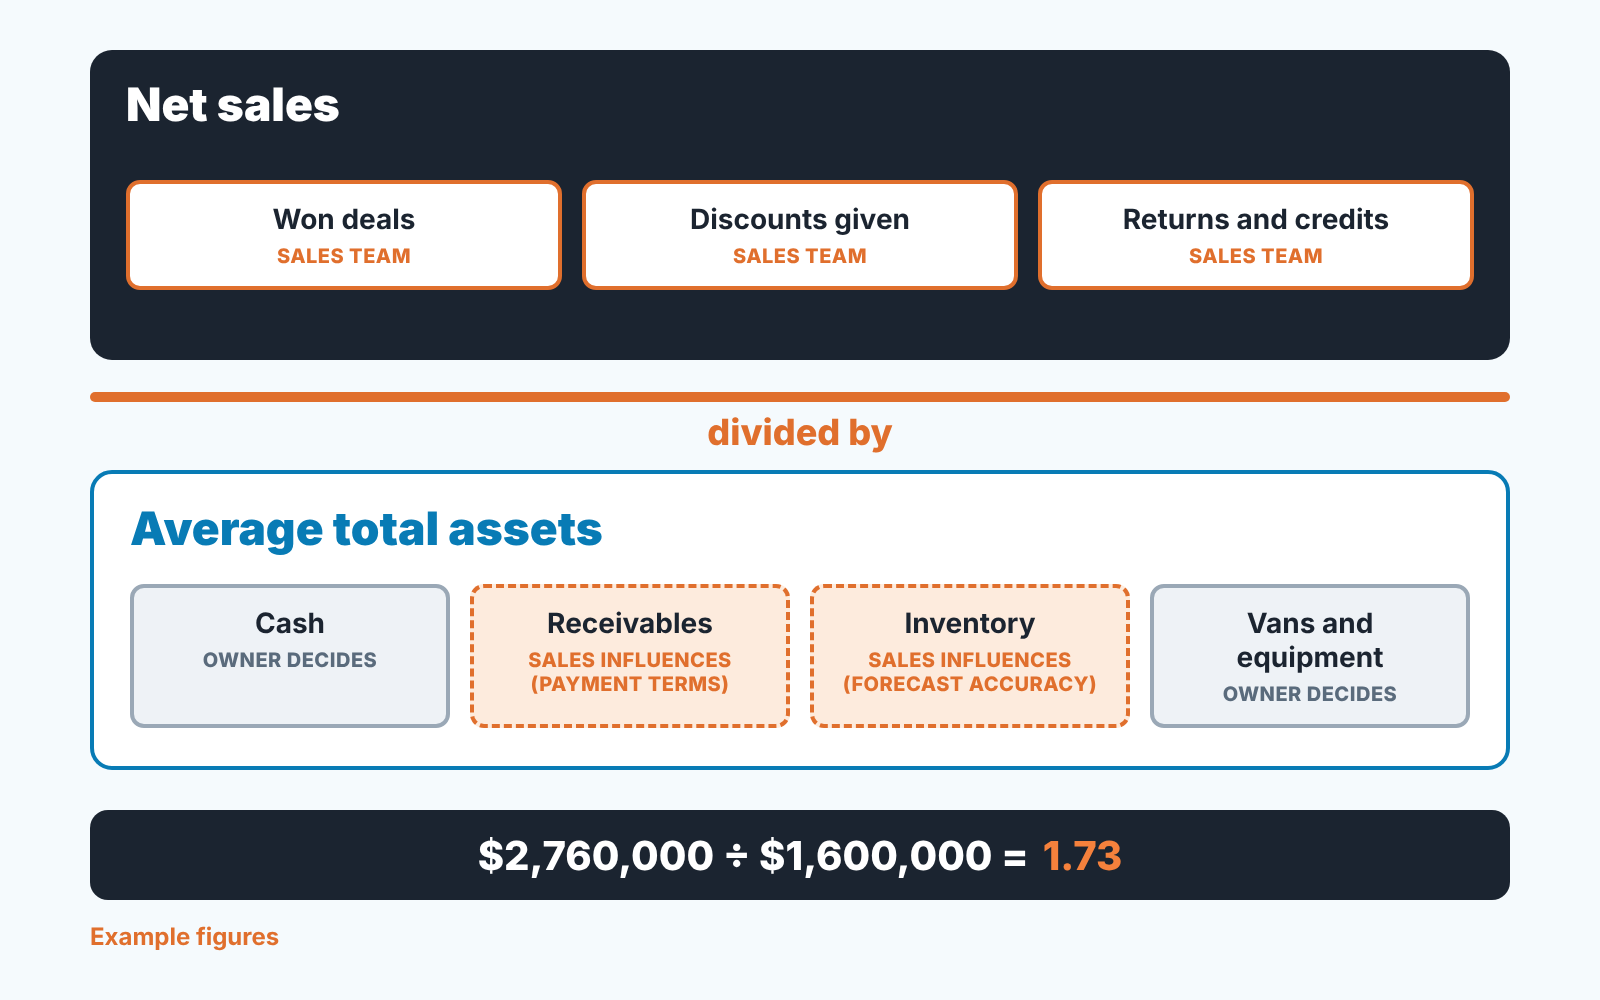
Most guides tell you to compare your ratio with an industry average. We’d skip that for a small company. Wikipedia’s entry notes that companies with low profit margins tend to have high asset turnover and those with high margins have low turnover, so the “right” number depends on a business model you may share with nobody in the benchmark table. Picture a competitor that subcontracts its installs. It carries fewer vans and tools than a company that owns its fleet, and with identical sales the two ratios will sit far apart. Your own figure, calculated the same way each quarter, tells you more. Is it rising or falling, and which line moved?
How it differs from ROA and inventory turnover
People mix these three up because they share parts. Return on assets keeps the same denominator and puts net income on top, according to Wikipedia’s entry on return on assets (November 2026), so it asks about profit per dollar of assets where asset turnover asks about revenue. Wikipedia’s DuPont analysis entry links them in one line: ROA equals net margin times asset turnover. Our return on assets article works through the profit side, and this one stays with revenue. Inventory turnover, per Wikipedia’s entry on inventory turnover, divides cost of goods sold by average inventory, so it watches one asset line and can improve in a year when total asset turnover falls.
Where the numbers live: CRM for revenue, accounting for assets
Open your CRM and filter won deals by close date for the year. You’ll get something close to gross sales. It’s rarely equal to the net sales on your income statement, because credits issued after the sale, refunds and early-payment discounts get recorded in accounting and usually never touch the deal record. In Year 1 of the example the CRM might show $2,520,000 of won deals while the books show $2,400,000 after $120,000 of credits and discounts.
Use the accounting figure in the formula. The CRM then explains it. It can show which reps, customers and product lines the revenue came from, how much discount each deal carried and what payment terms were promised. Those last two fields are often free text or missing entirely. If payment terms aren’t a required field on your deals you can’t trace a jump in receivables back to the deals that caused it.
Total assets never appear in a CRM. They come from the balance sheet, and our piece on what a CRM feeds into the balance sheet and what it can’t show draws that line in detail. For how all three statements connect to deal fields, see the three financial statements and which CRM fields feed each.
SalesBond works on the CRM half of this; bookkeeping and the ratio itself stay in your accounting system. Its free CRM audit looks at the last 30 days of your connected CRM and sends a PDF report with findings, managers, deal health, your top-10 clients and what to fix, then a second PDF seven days later showing what changed. If you plan to explain your numerator with won-deal data, that’s a quick way to see how complete the data is. Check your CRM with SalesBond.
FAQ
What is a good asset turnover ratio?
There’s no single number. Per Wikipedia’s entry, retail companies tend to run very high ratios and high-margin businesses run low ones. For a small company the useful comparison is your own ratio against last year’s, calculated with the same method.
What’s the difference between total and fixed asset turnover?
Fixed asset turnover divides net sales by average net fixed assets only, according to Wikipedia’s entry on fixed-asset turnover (November 2026). It suits equipment-heavy businesses. Total asset turnover also counts cash, receivables and inventory, which is where your sales team’s payment terms show up.
Can I calculate it quarterly?
Yes. Use net sales for the quarter and the average of total assets at the start and end of that quarter. A quarterly ratio will be roughly a quarter of the annual one, so compare quarters with quarters.
Is a higher ratio always better?
No. The ratio ignores profit, so a year of heavy discounting can push volume up and margin down while the ratio looks fine. ROA, which puts net income on top, catches that.
Does my CRM show asset turnover?
It doesn’t. A CRM holds the sales side (won deals, amounts, discounts, close dates) and has no record of what the company owns. You’ll always need the balance sheet for the bottom of the fraction.


