
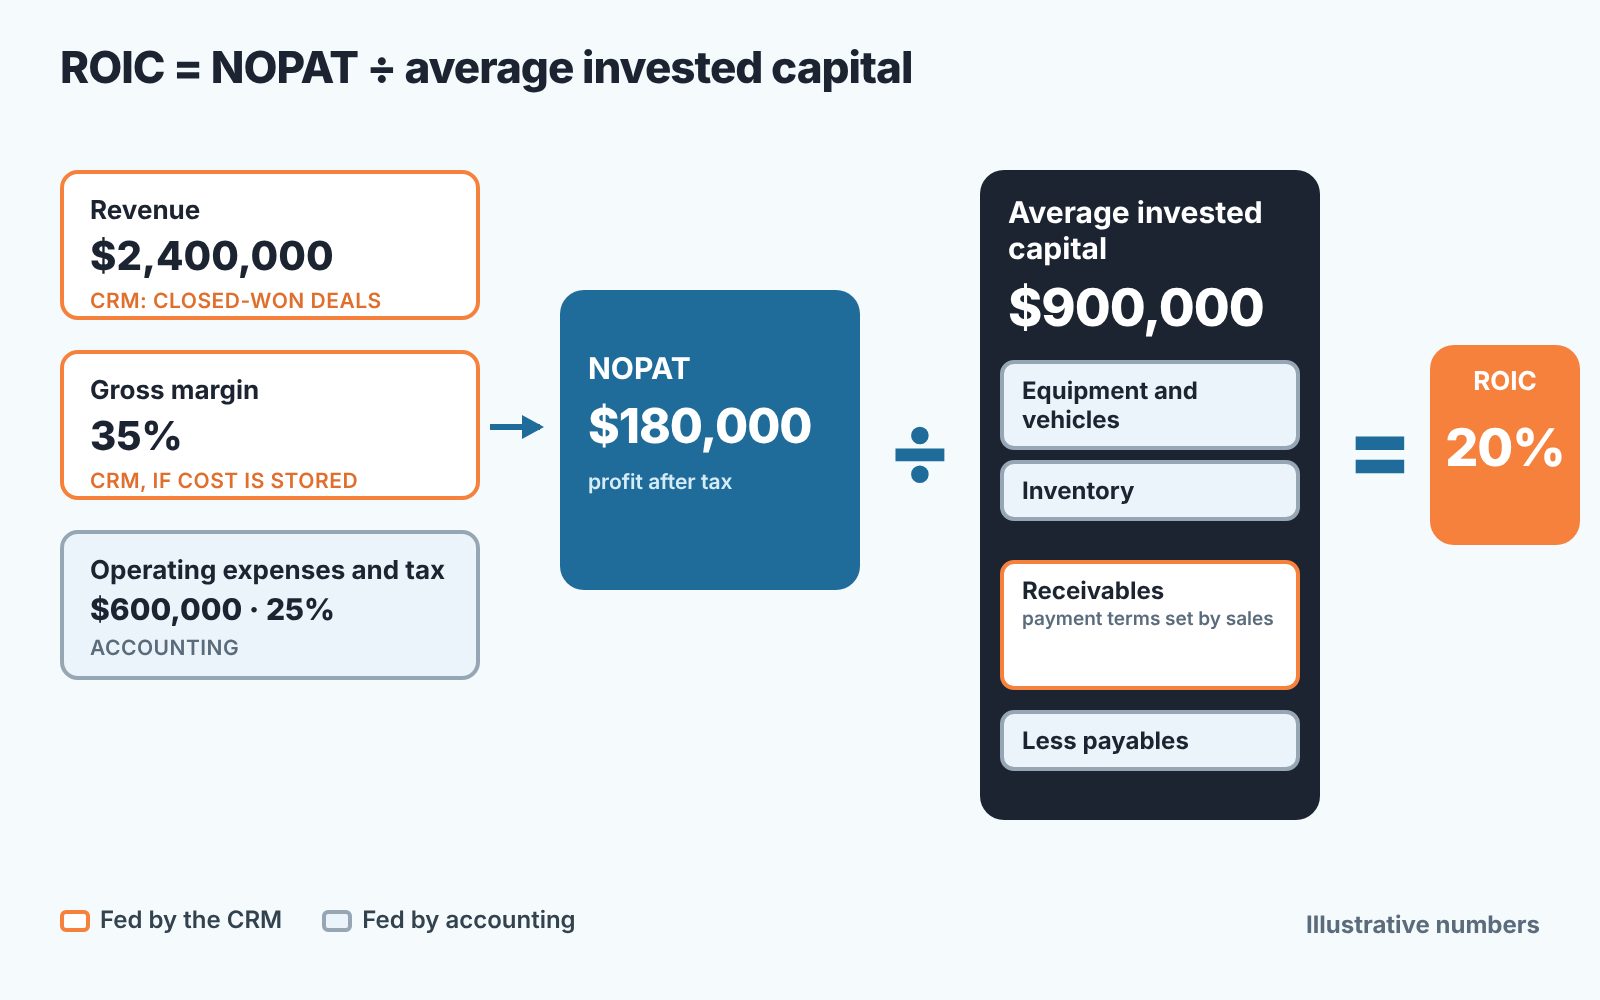
ROIC, return on invested capital, shows how much operating profit after tax a business earns on the capital it has put to work: ROIC = NOPAT ÷ average invested capital. It uses operating profit after tax where ROA and ROE use net income, so interest on a loan doesn’t change the result and the financing mix stays out of the numerator. Sales feeds the top. Revenue and margin from closed deals flow into NOPAT, while the capital underneath (equipment, stock, unpaid invoices) comes from the balance sheet and your accounting system.
This one is for the owner of a sales-led small business, the person who signs off on discounts and payment terms but rarely sees them in a capital report. Investors have plenty elsewhere. It’s general education, so your accountant or tax adviser still has the final word.
The ROIC formula, piece by piece
Open two references and you get one formula. ROIC stands for return on invested capital, and the two sources we checked in November 2026 write it the same way. Wikipedia’s Return on capital entry divides NOPAT by the average book value of invested capital, and Wall Street Prep’s ROIC guide gives NOPAT ÷ average invested capital.
Two terms need unpacking.
NOPAT stands for net operating profit after tax. Take operating profit (revenue minus cost of goods sold minus operating expenses, before interest) and multiply it by one minus your tax rate. Interest is left out on purpose, which is why a loan doesn’t move the number.
Invested capital is the money locked inside the operation so it can run. Think equipment, vehicles, inventory and what customers owe you, less what you owe suppliers. Most of it never feels like money. “Average” means you add the figure at the start of the year to the figure at the end and divide by two. Profit is earned across the whole year and capital moves during it, and the Wikipedia entry names this start-and-end average as the usual shortcut.
The asset turnover ratio looks at the same assets from the revenue side.
In practice that’s three small sums. Multiply operating profit by (1 − tax rate) to get NOPAT. Add invested capital at the start of the year to invested capital at the end and halve it. Then divide the first result by the second.
A worked example: a five-rep distributor
Say a five-rep distribution business closes $2,400,000 of deals in a year at a 35% gross margin. The numbers are illustrative and describe no real company. The 25% tax rate is an assumption too, so swap in your own effective rate.
| Line | Amount |
|---|---|
| Revenue (closed-won deals, invoiced) | $2,400,000 |
| Gross profit at 35% | $840,000 |
| Operating expenses (salaries, rent, software, commissions) | $600,000 |
| Operating profit | $240,000 |
| Tax at an assumed 25% | $60,000 |
| NOPAT | $180,000 |
Now the capital side, at the start and the end of the year.
| Invested capital | Start of year | End of year |
|---|---|---|
| Equipment and vehicles | $310,000 | $300,000 |
| Inventory | $360,000 | $400,000 |
| Receivables (unpaid customer invoices) | $320,000 | $400,000 |
| Less payables to suppliers | −$140,000 | −$150,000 |
| Total | $850,000 | $950,000 |
Average invested capital is ($850,000 + $950,000) ÷ 2 = $900,000. ROIC is $180,000 ÷ $900,000 = 20%.
Every dollar held in the business for the year earned twenty cents of after-tax operating profit.
The example gets useful when you change one sales habit at a time. Suppose the reps give a 5% discount across the board to close the same deals. Revenue drops by $120,000 while costs stay where they were, so operating profit falls to $120,000 and NOPAT to $90,000. Leave capital at $900,000 and ROIC is now 10%. A discount that looked small on each quote cut the return in half.
Or leave prices alone and look at payment terms. Monthly revenue here is $200,000, so end-of-year receivables of $400,000 equal two months of sales, roughly what net-60 terms produce when customers pay on time. Suppose customers had paid within a month all year, so receivables sat near $200,000 at both ends. Capital would be $730,000 at the start and $750,000 at the end, an average of $740,000. With the same $180,000 NOPAT, ROIC comes to about 24.3%. That assumes nothing else on the balance sheet moves, which is the point of changing one thing at a time.
What counts as invested capital in a small business
A small company rarely has an audited balance sheet with tidy labels, so owners tend to count the obvious things and stop. Start with what you’d have to buy again if you opened the same business tomorrow.
- Equipment, vehicles, fit-out and tools, at their current book value (the capex vs opex guide covers how these get onto the balance sheet).
- Inventory sitting in the warehouse or with a contractor.
- Receivables. Every invoice a customer hasn’t paid yet is your money working in their business.
- Deposits and prepayments you’ve made, such as a rent deposit or annual software paid upfront.
- Minus payables: supplier invoices you haven’t paid yet reduce the capital you need.
Leave out cash that sits idle in a savings account and isn’t needed to run operations. It distorts the picture of what the operation itself earns.
You can check the total from the other side of the balance sheet. Wall Street Prep’s ROIC guide describes invested capital as the capital contributed by equity and debt providers and notes that the two routes end up at the same figure because of double-entry accounting. For a small business that means interest-bearing debt plus the owner’s equity, minus the idle cash you left out above. If that sum lands far from your list, something is missing from one of them.
Which line do owners forget most easily? Receivables. It’s also the one the sales team controls. A rep who agrees to net-60 to win a deal has made a capital decision. So has a rep who promises a customer that stock will be held for them “just in case”. Neither choice shows up in the revenue report, and both raise the bottom of the ROIC formula. The working capital guide goes through payment terms and open deals in detail.
A service business with no stock and little equipment can show a very high ROIC simply because there’s little capital to divide by. Then the ratio tells you less and margin per person or CAC payback will tell you more.
What is a good ROIC?
A good ROIC is one that sits above your cost of capital: the rate on your loan and the return you’d want on your own money if you put it somewhere else.
Most guides add a threshold percentage. We don’t give one, and we’d treat any single number with suspicion. Thresholds come from public-company data, and a five-rep distributor with a leased warehouse has little in common with the companies in those samples.
Investors make the same comparison in a more formal way. Wall Street Prep’s ROIC guide describes comparing ROIC with the weighted average cost of capital (WACC), and Wikipedia’s Return on capital entry says the gap between the two is sometimes called a firm’s “excess return” or economic profit. An owner without a finance team can use the plain version. If ROIC sits above both your loan rate and the return you want on your own money, the capital is earning its keep. If it sits below the loan rate, growth funded by borrowing costs more than it brings in.
The second comparison is with yourself. Calculate ROIC for last year and the the year before using the same method. Did it rise because profit grew, or fall because receivables and stock grew faster than profit?
ROIC vs ROA vs ROE
All three ratios look at the same business and ask different questions. ROIC divides NOPAT by average invested capital, so it shows what the operation earns on the capital it uses, and debt doesn’t touch it because interest is excluded. ROA divides net income by total assets and asks what everything on the balance sheet earns; interest sits inside net income, so a loan nudges it. ROE divides net income by shareholders’ equity and shows what the owner’s own stake earns, which makes it the one that moves most when you borrow.
We’ve covered the other two separately, with their own examples: return on assets for a sales-led owner and return on equity, including how borrowing moves it. If the statements behind these ratios are unfamiliar, start with the guide to the three financial statements and the CRM fields that feed each.
Where the sales numbers come from in your CRM
Open the won-deals report for the year. That total, filtered by close date, is your starting point for revenue. Check it against invoiced revenue in accounting before you use it, because a deal marked won in December may be invoiced in January.
Margin is harder. Does your deal record know what the goods cost you? A CRM gives you gross margin only if deals carry product line items with a cost, or a custom field (say, “Margin %”) that the rep fills in when the deal is won. Without that the CRM knows the price and nothing else, and margin has to come from accounting.
Add three more fields. The first is the discount on each deal, since the worked example shows what 5% does. Then make payment terms a field with fixed options (net 30, net 60, prepayment) so that at year end you can pull won value by term and see how much of the receivables line your reps agreed to. Expected and actual payment dates are the third, if your CRM or invoicing integration stores them.
Operating expenses, tax, equipment, inventory and payables never reach the CRM. The whole denominator and half the numerator live in the accounting system (or in your bookkeeper’s spreadsheet), so you’ll always need two sources. For the return on sales spending specifically, the ROI formula for a sales team is the closer tool.
All of this assumes the deal data is reliable: amounts filled in, close dates real, won deals actually marked won. SalesBond’s free CRM audit checks that layer. It looks at the last 30 days of your connected CRM and sends a PDF report with findings, money at risk and what to fix, then a second PDF seven days later showing what changed. The audit stops short of ROIC itself. What it gives you is a read on whether the revenue figure you’re about to put into the formula can be trusted. Check your CRM with SalesBond.
FAQ
Is ROIC the same as ROI?
No. ROI measures the return on one specific investment, such as a campaign or a new hire. ROIC measures the return on all the capital the operation uses over a period.
Is a 10% ROIC good?
It depends on what your capital costs. Compare it with your loan rate and with the return you’d want on your own money. In the worked example above, a 5% discount pulled ROIC from 20% to 10%, and if the loan costs more than that, growth funded by borrowing loses money.
Can ROIC be negative?
Yes. If operating profit is negative, NOPAT is negative and so is ROIC. The business consumed capital that year.
How often should a small business calculate it?
Once a year is enough for the full calculation, since it needs closed books. Receivables and discount levels, the two parts sales can move, are worth a look every month.
Does a sales team have its own ROIC?
A sales team doesn’t have a balance sheet of its own, so a team-level ROIC would be an estimate at best. What you can measure per rep is what feeds the company number: won revenue, margin, average discount and the payment terms they agree to.


