
ROI (return on investment) = (gain − cost) ÷ cost × 100: the net profit on an investment as a percentage of what it cost. For a sales team, take the gain from closed-won deals in your CRM, ideally the profit on those deals rather than the deal amount, count every cost including the months a new rep spends ramping, and compare over a period at least as long as your sales cycle.
The arithmetic is the easy part. Owners get ROI wrong because of what goes into the two boxes, and three decisions show it best: hiring a rep, paying for a tool, running a campaign. The numbers are made up to show the mechanics. Your CRM has the real ones.
ROI formula in one line
The textbook case: an investor puts $2,000 into shares and sells them two years later for $3,200. ROI = (3,200 − 2,000) / 2,000 × 100 = 60% (Sage: how to calculate ROI). Wikipedia defines it the same way, as the ratio of net income or profit to the investment (Wikipedia: return on investment). In a spreadsheet, with the cost in B1 and the gain in B2, the cell is =(B2-B1)/B1 with percentage formatting.
Note the word profit. The investor’s profit is $1,200, because the first $2,000 of the $3,200 was their own money coming back.
So what is a good ROI? There is no universal number. For a sales decision, a good ROI is one that is still positive after a full sales cycle and beats what the same money would have earned on your next-best option, whether that was a second rep or a bigger campaign. And the percentage hides the size of the bet: 20% on a $100,000 hire and on a $5,000 campaign are different conversations.
How to calculate ROI for a sales decision, step 1: the gain is closed-won × margin
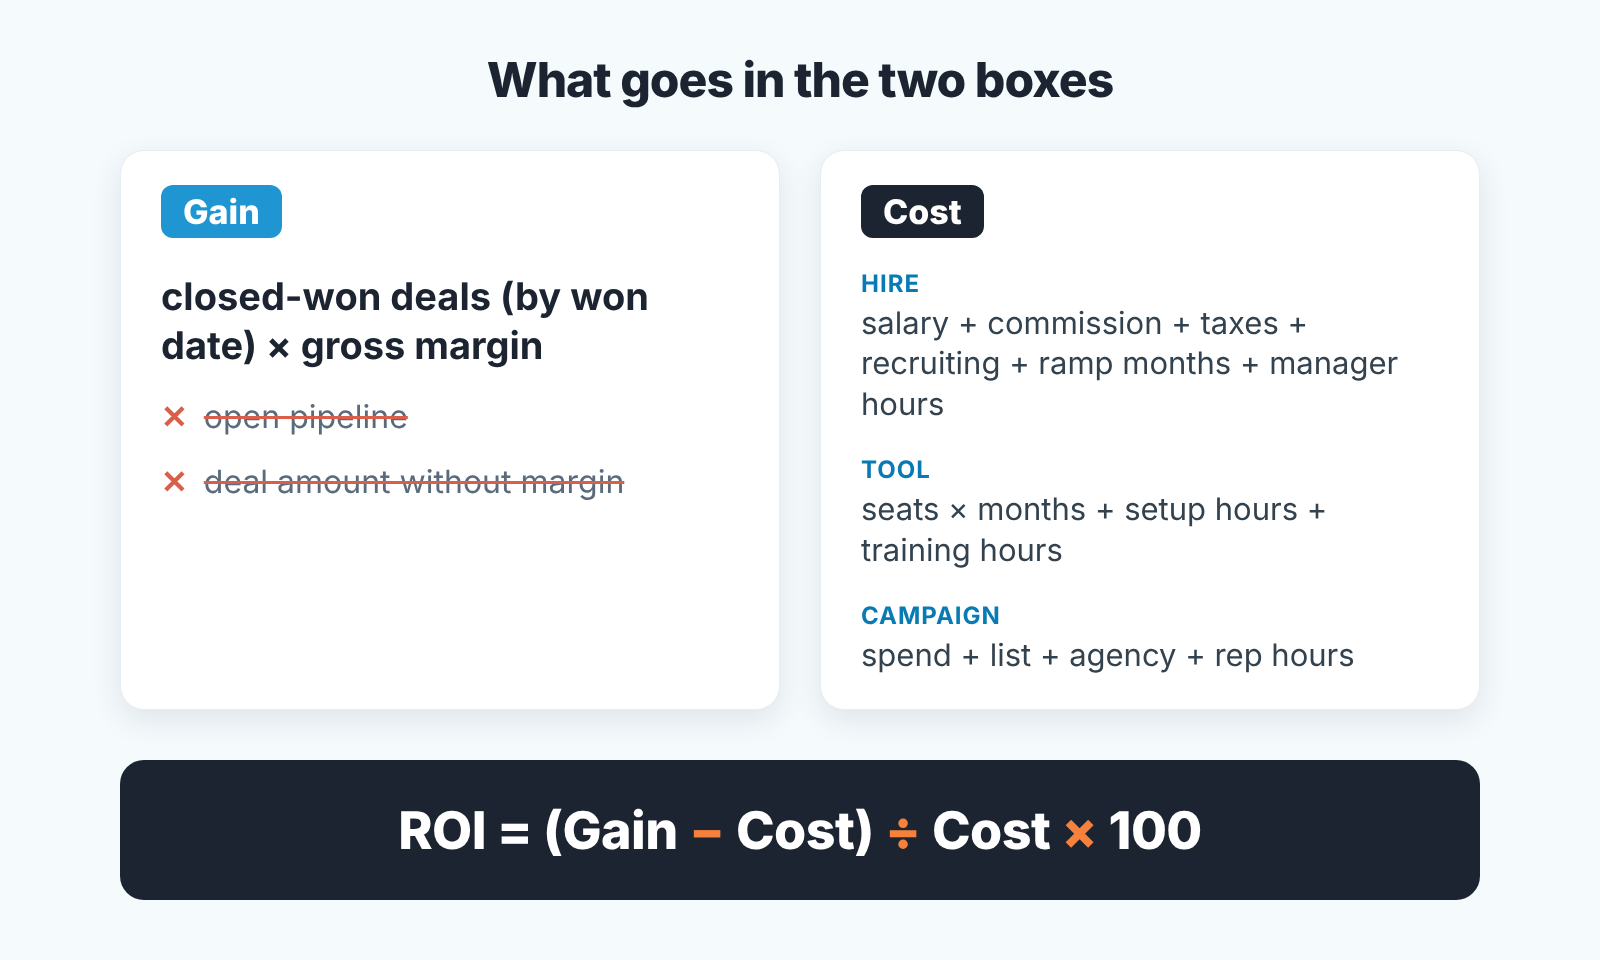
The gain lives in one place: closed-won deals in your CRM, filtered by the date they were won. For a new rep, filter by owner. For a campaign, filter by the source or campaign field; most CRMs have one, under different names. If those fields are patchy, SalesBond’s free CRM audit is a quick check: it reads the last 30 days of the CRM and sends a PDF report on money at risk, deal health and the top-10 clients, with a second report a week later showing what changed.
Then multiply by margin. A $10,000 deal at 40% gross margin brought the business $4,000. Revenue is what sales gets paid on, but ROI is a profit formula. Put revenue into it and the gain is overstated two and a half times at 40% margin, while the ROI is overstated by far more, as the hire example shows. The margin comes from finance, per product line or as one blended rate. We covered where a gross margin figure comes from, and why reps confuse it with markup in markup vs margin for a sales manager.
Open pipeline does not count. A $50,000 opportunity is not revenue until it closes; at a 25% close rate it is $12,500 of expected revenue (La Growth Machine: how to calculate sales ROI), and that is a forecast. Show it on a separate line labelled expected, with the win rate you used.
Step 2: count the full cost, ramp and your own time included
Sage warns against two mistakes: leaving out associated costs, and comparing unlike figures, such as cash invested against returns reported as revenue (Sage). The second is the margin problem above; the first looks like this in a sales team:
- A rep is not their salary. Add commission actually paid, employer taxes and benefits, recruiting fees, the laptop and tool seats.
- Ramp months carry full salary and a slice of the manager’s week before the rep closes anything.
- For a tool, count the hours to set it up, migrate data and train the team.
- Campaigns: add the list, the designer, the agency and rep hours to the spend.
Your own time is the cost owners skip most often (Sage’s example is an investor in a bicycle shop who spends weekends helping out for free: that time belongs in the cost). A $59 seat that takes you twenty hours to configure is not a $59 decision.
Worked example 1: a new sales rep (illustrative numbers)
Say you hire a rep in January. Base $60,000, commission paid over the year $24,000, taxes and benefits $12,000, recruiting fee $8,000, tools $3,000. The manager spends four hours a week for the first three months onboarding and shadowing calls; at $120 an hour that is about $6,000. Full first-year cost: $113,000.
Now the gain. In the CRM, filter deals by owner = the new rep, status = won, won date between January 1 and December 31. Suppose the total is $400,000 in deal amounts, nothing in the first three months. At a 35% blended gross margin the gain is $140,000.
ROI = (140,000 − 113,000) / 113,000 × 100 = 24%.
For a hire who needed a quarter to produce anything, that is a decent first year. With revenue as the gain you get (400,000 − 113,000) / 113,000 = 254%, the kind of figure that gets a second hire approved on a Friday and regretted in Q3.
Before you trust the 24%, ask how much of that $400,000 came from accounts another rep handed over: that part is not new gain. For headcount planning, how long a rep takes to reach full capacity matters as much as the ROI, and the OTE for a first sales hire decides the cost side.
Worked example 2: a CRM seat or sales tool
A tool is the hardest of the three to measure honestly, because its effect is spread across every deal and mixed with with everything else that changed that year. Vendors show revenue growth. We think that is the wrong gain.
Six seats at $59 a month for a year: $4,248. Setup and data migration, twenty hours of the sales manager at $50: $1,000. Training, six reps for four hours at $40: $960. Total: $6,208.
The first honest route is a saving. Sage calls this technical ROI, where the gain is total savings rather than new income (Sage). If each rep really stops spending two hours a week on manual data entry, that is 6 reps × 2 hours × 46 working weeks × $40 = $22,080, and ROI = (22,080 − 6,208) / 6,208 = 256%. Saved time counts only if it was measured before and after and went into selling, so show the hours and the rate.
The second route compares outcomes: closed-won margin per rep for the twelve months before the tool and the twelve after, same reps, same territory. If rep productivity moved and nothing else did, you have a case. If you also hired two people and changed pricing, the honest answer is “we cannot isolate it”.
Pick one route and say which. Mixing them double counts: the hours saved and the deals closed in those hours are the same gain.
Worked example 3: a campaign
Campaigns are the easiest to measure, if the CRM was set up before the campaign started. The field that matters is source (or campaign, or lead origin, depending on your CRM), set on every lead when it is created, because by teh time the deal closes nobody remembers.
The campaign cost $12,000 in ad spend, list and design. Reps spent forty hours on the leads at $50 an hour: $2,000. Total cost $14,000.
Ninety days later filter deals by source = this campaign, status = won. Nine deals, $86,000 in deal amounts, at 40% margin: $34,400 of gain.
ROI = (34,400 − 14,000) / 14,000 × 100 = 146%.
Another $50,000 of open deals came from the same source; at a 25% win rate that is $12,500 of expected revenue. Report the 146% with that pipeline as a footnote. Counting the whole open pipeline at margin would lift the figure to 289%, and the first person in finance who asks which deals closed will take it apart. For an event, see trade show ROI in Pipedrive.
For a marketing ROI to be credible, the program’s effect has to be isolated from other influences (Wikipedia: return on investment). Some of those nine deals you might have won anyway. A region that did not get the campaign is the clean comparison; last year’s same period is the usual one.
Why the first month always looks bad: sales cycle and timing
Measure the campaign above at day 30 instead of day 90. Cost: $14,000, all of it spent. Closed-won: $0, because your average cycle is 90 days. ROI = (0 − 14,000) / 14,000 = −100%.
Nothing went wrong. The window was shorter than the cycle.
The same happens to the rep. Month three of the hire example: cost to date roughly $33,000, closed-won zero, ROI −100%. At the quarter mark you are measuring your sales cycle plus ramp, and the hire barely shows yet. The formula has no time in it, so 60% over two years and 60% over two months look identical; Wikipedia notes the user picks the length of the calculation freely (Wikipedia). Comparing decisions measured over different windows? Put both on a per-year basis first.
Our rule: the window for a sales ROI is at least one full sales cycle after the cost was incurred, and for a hire it is cycle plus ramp. Check your win rate and cycle length before you pick it, and write it on the report. Write it as “ROI 146% over 90 days”, since a bare “ROI 146%” leaves the reader to guess the window.
Two ways to fool yourself with an honest formula
Attribution. The deal was in the pipeline before the campaign. The rep inherited a warm account. The tool went live the same month as a price rise. The formula still gives a clean percentage, and it is wrong. Before you present an ROI, write one sentence on what else changed; if it runs long, label the number “not isolated” or drop it.
Revenue as gain. A CRM vendor’s published example counts $25,000 of software plus $20,000 of training and maintenance over two years as a $45,000 investment, and $120,000 of extra revenue as the return, for an ROI of 166.7% (Salesmate: ROI of CRM). Those inputs and that result are the vendor’s. The recalculation is ours, with a margin we assumed for illustration: at a 40% gross margin the $120,000 is $48,000 of gain, and (48,000 − 45,000) / 45,000 comes to under 7%. Only the number in the top box changed.
If you already compute CAC and LTV from CRM data or the CAC payback period, you have most of these inputs. Where to start? Take one decision from last year and rerun it with closed-won margin by won date and every hour you put in. If its lower than the number you remember, that is the decision to look at first.


