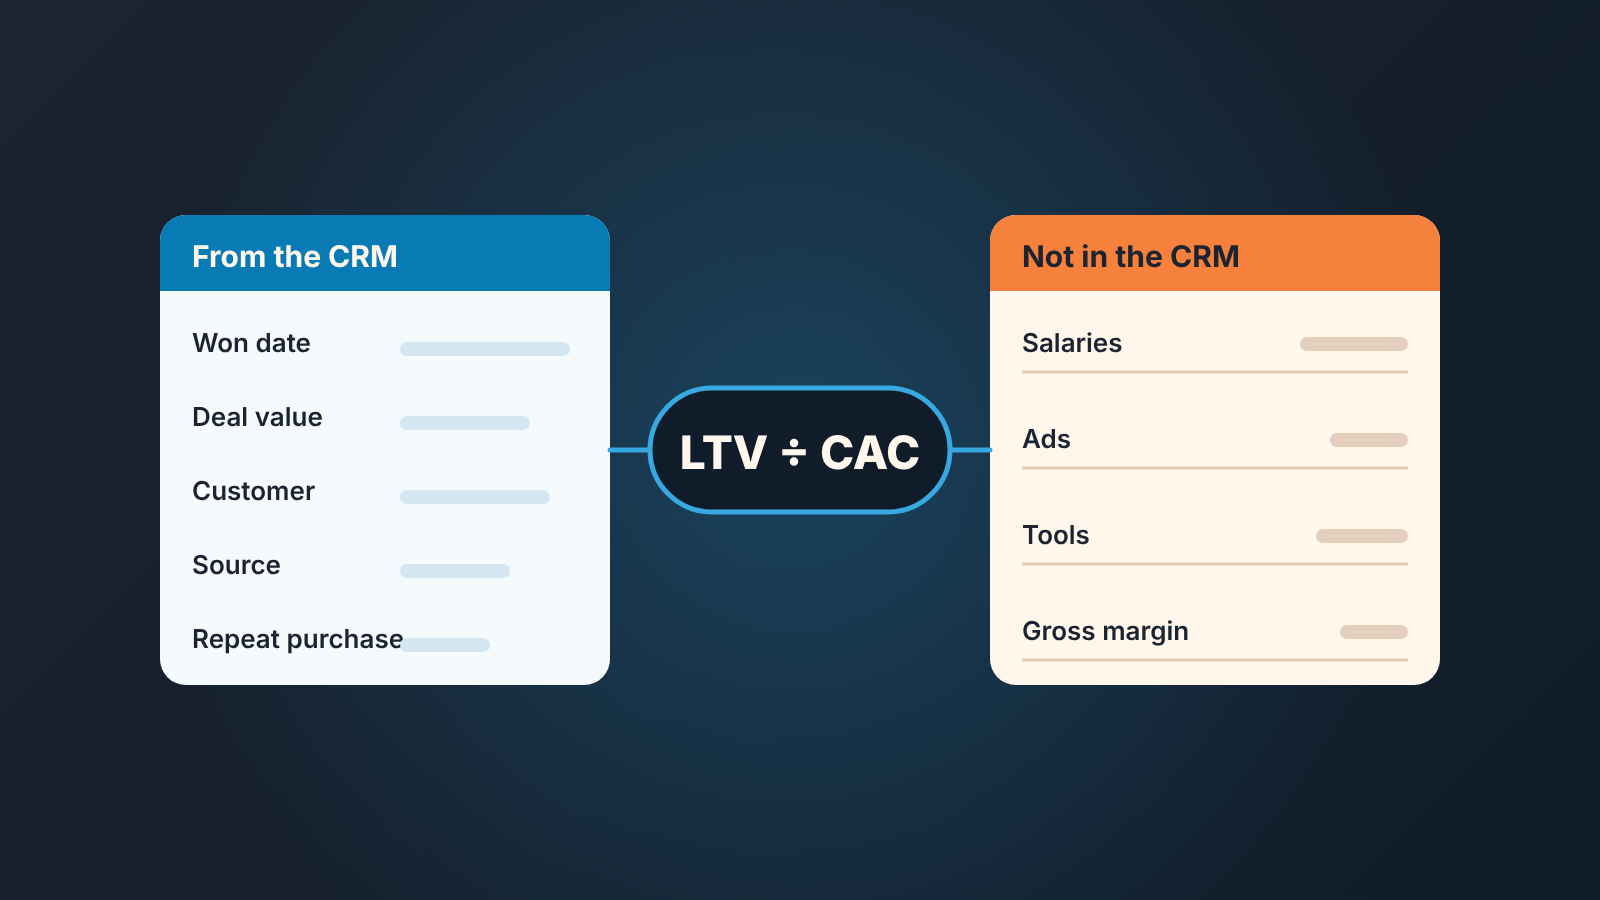
The LTV to CAC ratio compares the gross profit a customer brings over their lifetime with what it cost to win them. The formula: (average monthly revenue per customer × gross margin ÷ monthly churn) divided by (sales and marketing spend ÷ new customers won). Gong and Improvado both put a healthy ratio at about 3:1 (Gong, Improvado). Your CRM holds part of each side: how many new customers you won, what they paid, where they came from and whether they bought again. It does not hold salaries, ad spend, tool costs or gross margin. Those live in finance, and someone types them in by hand. Below we go through the CRM half, mark the finance half honestly, and run the whole thing on made-up numbers to show which input moves the result most.
Where everyone’s “3:1” comes from
A good LTV:CAC ratio is usually put at around 3:1, and almost every article on the subject repeats it. The definitions behind it are simple. CAC is sales and marketing spend divided by the new customers it brought in; Gong’s example is $10,000 of spend and 100 customers, so $100 each (Gong). The ratio is lifetime value divided by that cost, and “CAC LTV” or “LTV CAC” is the same division. A customer worth $1,000 who cost $500 gives you 2.0.
Gong’s scale: below 1 you spend more than you get back, 2 to 4 is the sweet spot, and 5 or above may mean you are under-investing in growth. Improvado draws the lines in nearly the same place: under 3:1 often means overspending on acquisition or losing customers fast, above 5:1 you may be leaving growth on the table (Improvado).
We read those as two vendors’ opinions, and we would not run a team by them. The reason is in Gong’s own small print: since CAC counts only sales and marketing, a company at 1.0 is probably still losing money once rent, support and product are paid. The benchmark is only as honest as the two numbers you feed it, and most small teams feed it a CRM export and a guess. So before arguing about 3 versus 4, find out which parts of the formula you actually have.
Half the formula lives in your CRM. The other half doesn’t
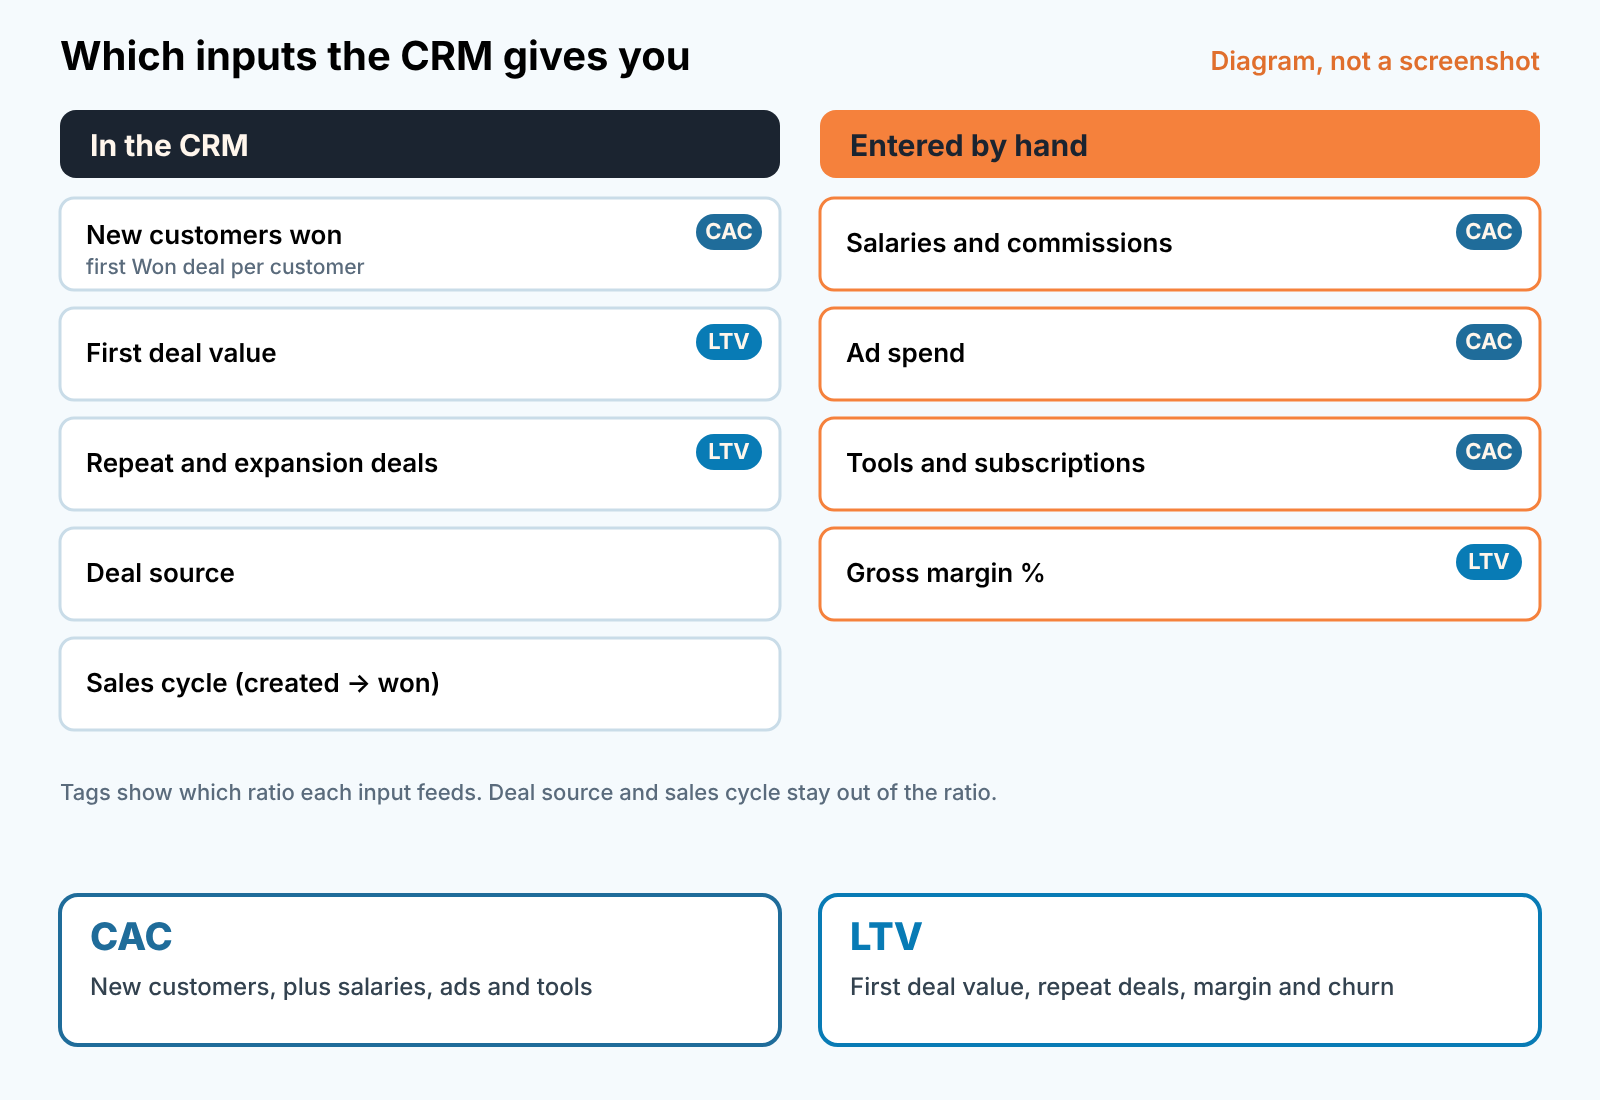
This is the split we use when a founder asks for “our LTV to CAC by Friday”. It works in any CRM that has a won stage, a won date, a deal value, a customer record and a source field.
| Input | Where it comes from | How far to trust it |
|---|---|---|
| New customers in the period | CRM: deals in a Won stage, won date inside the period, first Won deal for that customer | High, if every deal is linked to a customer record. Unlinked deals turn one customer into three |
| Average first-deal value | CRM: deal value of those first Won deals | Medium. Deal value may be a contract total, an annual or a monthly figure depending on who entered it (see ACV vs deal value) |
| Monthly revenue per customer (ARPA) | CRM if deals carry a recurring field; otherwise billing | Medium to low. Improvado lists billing or CRM as the source and warns that without a shared customer ID the calculation drifts (Improvado) |
| Repeat and expansion deals | CRM: second and later Won deals on the same customer | High for the count, medium for the value (same deal-value caveat) |
| Deal source | CRM source field | Only as good as the discipline behind it. Blank source means “unknown”, not “organic” |
| Sales cycle | CRM: created date to won date | High. Useful for cash planning, not in the ratio itself (see sales cycle length) |
| Sales and marketing spend | Finance: payroll, commissions, ads, tools, agency fees | Not in the CRM at all. Someone enters one number per period |
| Gross margin | Finance | Not in the CRM. Improvado takes it from finance; so do we |
| Churn | Customer cohorts built from CRM Won deals, or billing | Medium. See the GRR article below for the CRM version |
Read honestly, the table says the CRM gives you the denominator of CAC and the raw material for LTV. It never gives you CAC itself, because the numerator is money the CRM has never seen.
CAC for a small team: what to include, what to leave out
The CAC formula: all sales and marketing spend in the period ÷ new customers won in the same period. Gong and Improvado both define it this way, and we keep that definition even when you cannot fill it in completely.
For a team of two to six reps the spend side is shorter than it sounds. Salaries and commissions of everyone who sells or markets, including a share of the founder’s time if the founder closes deals. Ad spend. The CRM subscription, the dialler, the email tool, the data provider. An agency or freelancer if you pay one. That’s usually the whole list, and it takes an afternoon with the accountant, not a data warehouse.
What to leave out is more interesting. Customer success and support cost money, but they are not acquisition, and folding them in lets the ratio drift toward whatever story you want. Same for product and engineering. And leave out “we would have hired a marketer if we could”, which is a plan, not a cost.
Two things on the CRM side will bite you:
- Count customers, not deals. A customer who signed three deals in the quarter is one new customer if their first Won deal is in the quarter, and zero if their first Won deal was last year. Filter Won deals by won date, then keep only those where the customer has no earlier Won deal.
- Match the period. Q2 spend, Q2 customers. With a long sales cycle part of Q2 spend produces Q3 customers. That lag is a known weakness of the metric and the cure is a longer period, not a cleverer formula.
LTV without the illusions
A deal value is not a lifetime value.
The simplest LTV, the one Gong uses, is the revenue a customer brings over their lifetime, with no margin and no churn in the formula. It overstates what a customer is worth, because revenue is not what you keep. Improvado’s version is the one we use: monthly revenue per account × gross margin ÷ monthly revenue churn. Their example is $5,000 a month at 70% margin with 3% monthly churn, which gives $116,667 (Improvado).
Dividing by churn quietly turns a monthly figure into a lifetime. At 3% monthly churn the average customer stays about 33 months, and the formula multiplies monthly gross profit by that. So the whole LTV rests on one number you probably don’t have with confidence yet.
Where the three inputs come from in a small team:
ARPA. If your CRM carries a recurring-revenue field on the deal, use it. In Pipedrive, for example, recurring products compute MRR, ARR, ACV and TCV on the deal on the Growth plan and above; the values are not available to formula fields, and a subscription with no end date is counted as 12 months for MRR and ARR (Pipedrive: recurring products). On any plan a custom “monthly revenue” field works, with annual contracts divided by 12 (Pipedrive blog). Other CRMs have there own equivalents. The principle is the same: a monthly number on the deal, not a contract total. Unsure which revenue figure belongs here? Bookings, billings and revenue sorts the three out.
Gross margin. From the accountant. One percentage for the company, or one per product line if the lines differ a lot. Don’t guess 70% because an article used 70%.
Churn. The cleanest CRM-based input is gross revenue retention: take last year’s customers and see how much of their revenue is still here. Revenue lost, divided by what you started with, spread over the months, is your revenue churn. It is coarse and it needs at least a year of Won deals to mean anything.
That is where we take a position. With less than 12 to 24 months of customer history, a five-year LTV is fiction with a decimal point. Payback and a rough ratio on real customers are worth more than a precise number built on churn measured over one quarter.
A worked example: CAC, LTV, ratio and payback
Every figure below is invented to show the mechanics. Replace all of them.
Three reps, one quarter.
- Sales and marketing spend for the quarter, from finance: $30,000 (payroll, commissions, ads, tools).
- New customers won in the quarter, from the CRM: 25 customers whose first Won deal closed in the quarter.
- CAC = $30,000 ÷ 25 = $1,200.
Now the value side.
- Average monthly revenue per customer, from the recurring field on those 25 deals: $350.
- Gross margin, from finance: 70%.
- Monthly revenue churn, from last year’s GRR spread over 12 months: 5%.
- LTV = $350 × 0.70 ÷ 0.05 = $4,900.
- Ratio = $4,900 ÷ $1,200 ≈ 4.1.
Payback is the question a small team should actually care about, because it is tied to cash. Improvado’s formula is CAC ÷ (ARPA × gross margin), in months.
- Payback = $1,200 ÷ ($350 × 0.70) = $1,200 ÷ $245 ≈ 4.9 months.
Improvado’s own payback example puts ARPA where CAC should be and gets a wrong number, so run the formula on your inputs rather than copying theirs. Their reading of the result still helps: under 12 months they call healthy, over 18 a cash-flow risk (Improvado).
Now watch what one input does. Drop the margin and use revenue, Gong-style: LTV becomes $350 ÷ 0.05 = $7,000 and the ratio jumps to 5.8, which Improvado would read as under-investing in growth. Nothing changed in the business. Or move churn from 5% to 8% because you measured it over a bad quarter: LTV falls to $3,063 and the ratio to 2.6, which the same benchmarks call overspending. Same team, same spend, same customers.
That’s why we trust payback more than the ratio in year one. It uses only CAC, ARPA and margin, and churn, the shakiest input, is not in it.
Four ways the number lies to you
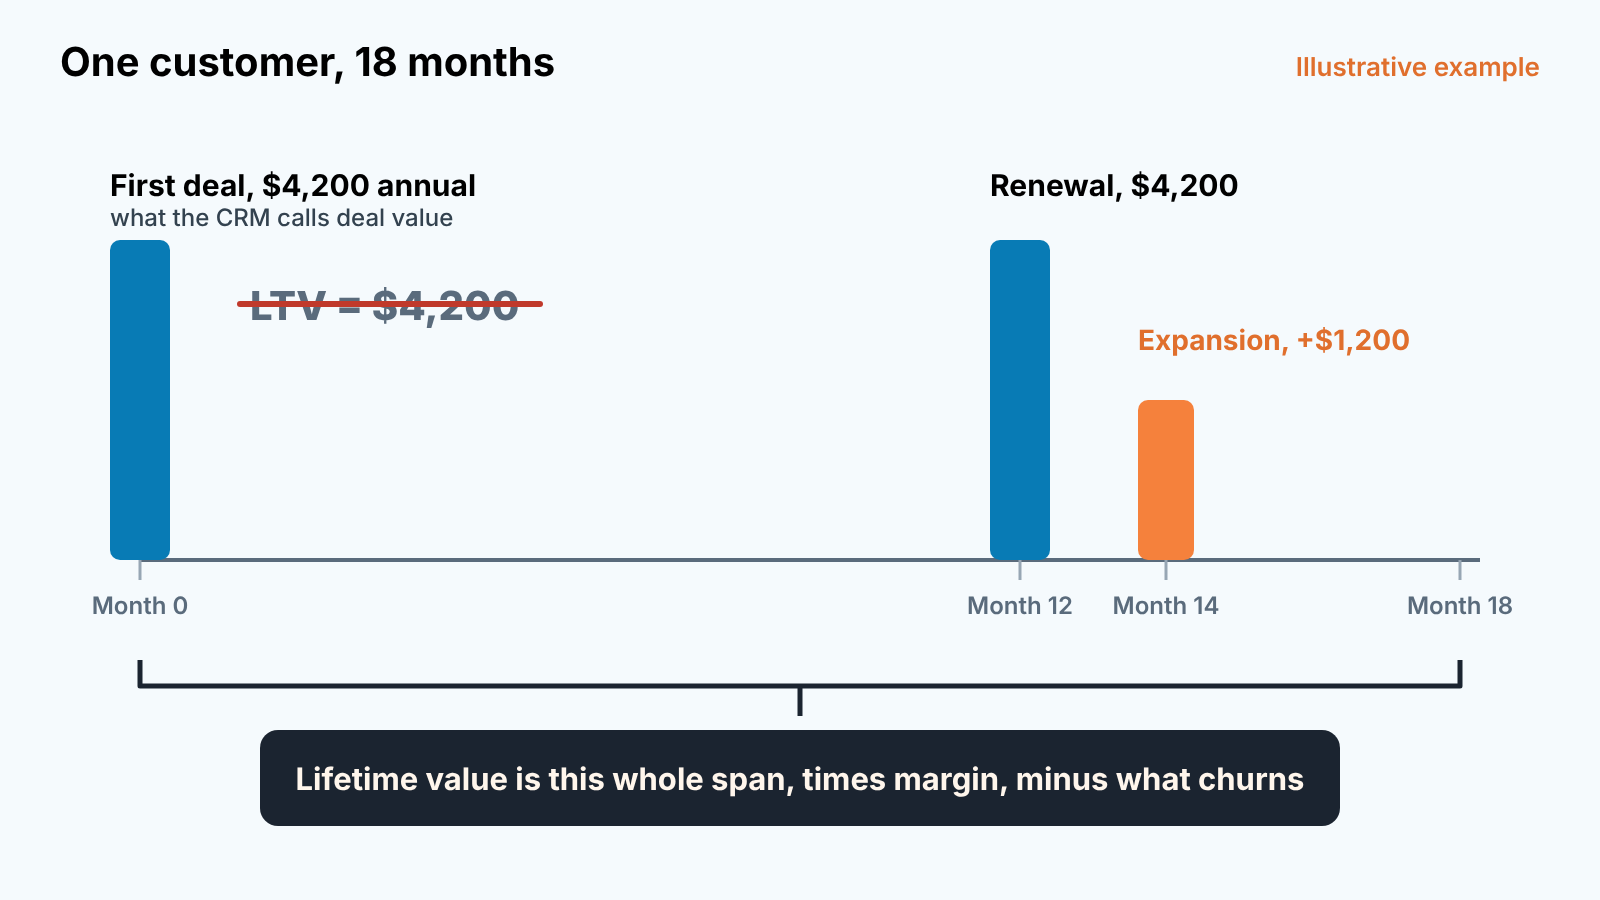
Deal value is not LTV. The first Won deal is the first purchase, nothing more. Treat it as lifetime value and you undercount customers who renew and overcount the ones who churn in month two. For a subscription business the first deal is the start of the span, not the span.
Repeat and expansion deals are revenue, not new customers. A second Won deal on an existing customer raises their ARPA and their lifetime. It must not land in the “new customers” count that divides CAC. The filter is “first Won deal per customer”, and it only works if reps link every deal to the the existing customer record instead of creating a fresh one. This is the part a sales manager can fix on Monday: merge the duplicate organisations and set a rule that no deal is created without a customer.
A customer with no second deal is not necessarily churned. They may be on a contract that renews in billing without a CRM deal, or a one-off buyer in a business that mixes one-offs with subscriptions. Decide before you count: either every renewal creates a Won deal, or churn comes from billing. Mix the two and it’s easy to end up showing an investor a churn rate nobody on the team can explain.
Six months of history is not a lifetime. If the oldest customer in your CRM was won in March, you cannot observe annual churn, you can only extrapolate it. Say so. “Payback 5 months on 25 customers, churn not yet observable” is a sentence a board can work with. “LTV to CAC 4.1” with invented churn is not.
Repeat purchases are also where we spend a lot of our own time. We build SalesBond, a sales management layer for teams on Pipedrive, HubSpot, Salesforce and Zoho CRM. Its Customer Health section shows a historical LTV per customer: the actual sum of all their Won deals, with first-purchase date and average order value. That is the raw material for the repeat-deal and churn questions above. It doesn’t know your margin or your ad spend either; no CRM layer does. If you want to see what your Won deals say about repeat purchases before you build the spreadsheet, check your CRM with SalesBond.
What to do with the number
The first time you calculate LTV to CAC from CRM data, treat it as a data audit rather than a metric. It tells you whether deals are linked to customers, whether deal value means the same thing on every deal, and whether anyone has written the quarter’s spend down in one place. Fix those and run it again next quarter.
After that, payback is the number we would put on the wall for a small team. It answers a plain question, how many months until a new customer has paid for their own acquisition, and it moves when you change something you control: price, discounts, ad spend, how many customers a rep closes a month. The ratio can wait until you have two years of customers and a churn rate you measured rather than assumed. Keep it apart from pipeline coverage, which tells you how much pipeline you need to hit a plan. This one tells you what a customer costs and what they bring back.