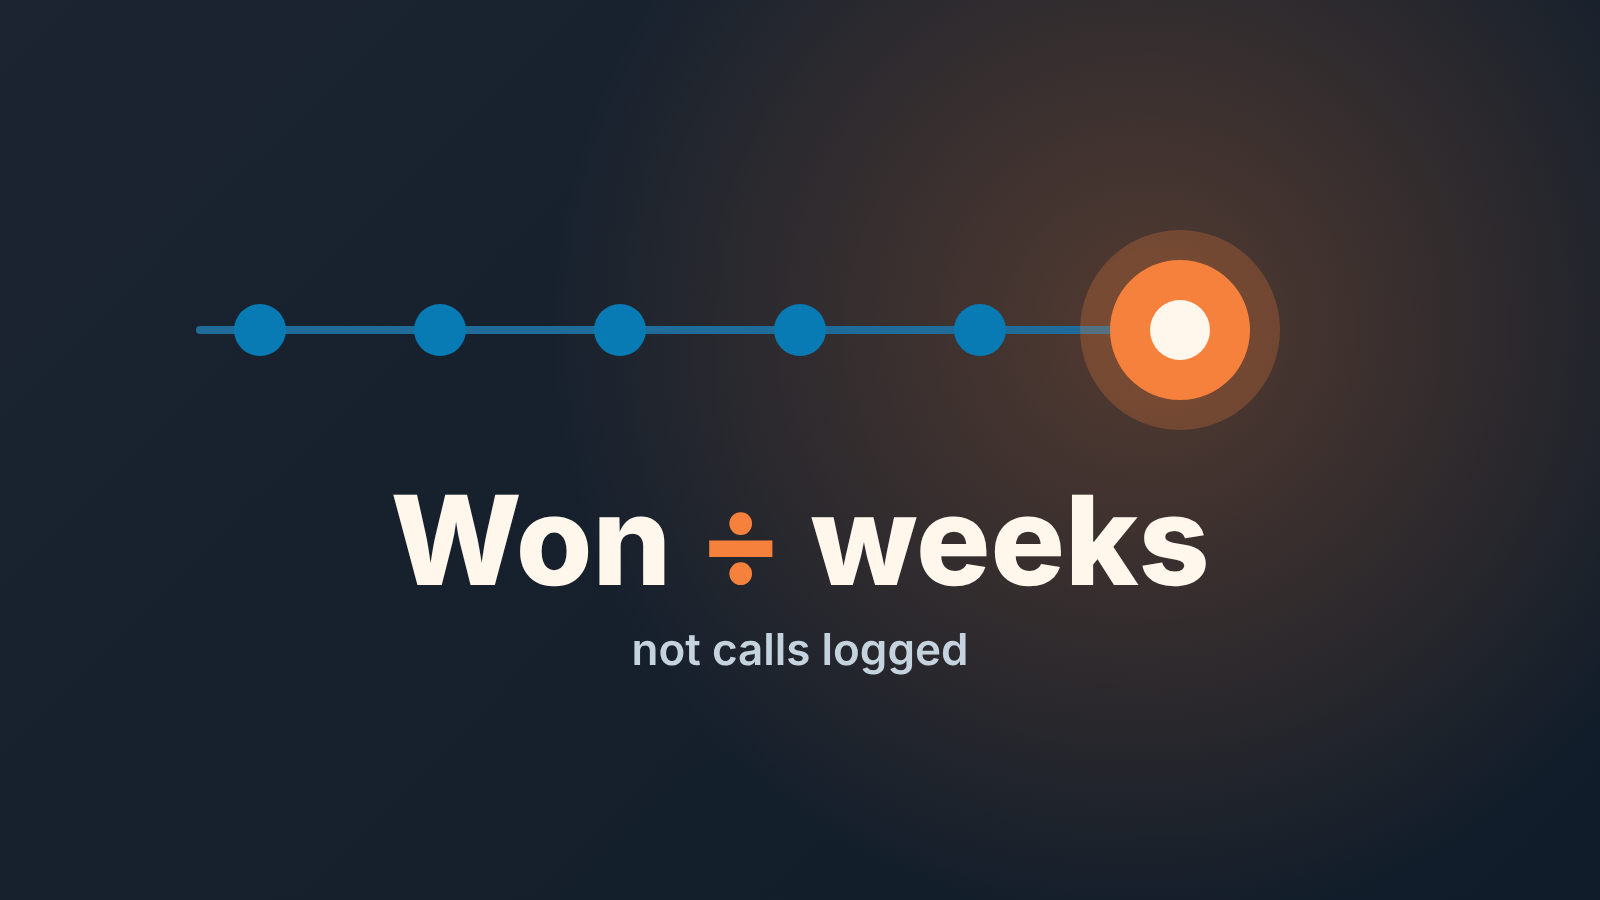
Sales rep productivity is closed revenue (or qualified deals) divided by the time a rep actually spends selling. Your CRM gives you a solid numerator from deal fields and a weak denominator from activity logs, so measure each rep against their own previous quarter and treat call counts as a habit signal, not a result.
That is the whole article in one sentence. The rest is about why a small team gets this wrong, and which CRM fields to trust when you stop counting calls.
The rep with 60 calls and no deals
Picture a Monday report for a team of six. One rep, call him Tom, logged 60 calls last week. Another, Priya, logged 14. If you read nothing else, Tom looks like the hardest worker on the team and Priya looks like a problem.
Now open the deals view. Priya moved two deals into the proposal stage and closed one that had been sitting at the verbal-yes point since August. Tom moved nothing. His 60 calls were mostly dials into a cold list, each one logged with a one-line note, each one ending nowhere.
Nobody is lying in this report. Tom really did make the calls. The report is still misleading, because it answers “who did the most things” when the question you care about is “who produced the most with the hours they had”. Those are different questions, and most CRM dashboards are built to answer the first one, since that is the data they have in abundance.
We have watched managers of three-to-ten-person teams run a whole quarter on the first question. The usual result: the team learns that logging wins, and the rep who closes quietly starts to wonder why the loud one gets the praise.
The sales rep productivity formula: two honest inputs
The formula that circulates for this is simple enough to be right: sales productivity is output divided by input, where output means revenue, won deals or qualified opportunities, and input means the time, effort and resources that went in (SalesScreen). We agree with it, and we think almost everyone applies it badly on the input side.
The output side is easy to get right because the CRM already has it. A won deal has a value and a date. A deal that reached your qualified stage has a stage-change timestamp. These are facts a rep cannot inflate without committing something visible in the pipeline, which a manager will see within a week.
The input side is where it falls apart. “Effort” is not a field. So teams reach for the nearest thing that looks like effort, which is the count of logged activities, and they put that in the denominator or, worse, they drop the denominator entirely and just rank reps by activity count. At that point the formula has quietly become “output ÷ nothing” or “activity as the output”, and neither version tells you who is productive.
Our position: the denominator is time, and time comes from the calendar, not from the CRM. We count it in selling weeks: working weeks minus leave, training and onboarding days. A rep who sold four days a week because the fifth went to onboarding a new hire had 80 percent of the selling weeks of a colleague who sold five. Divide by that. It is coarse, but it is honest, and honest and coarse beats precise and wrong.
What your CRM can supply
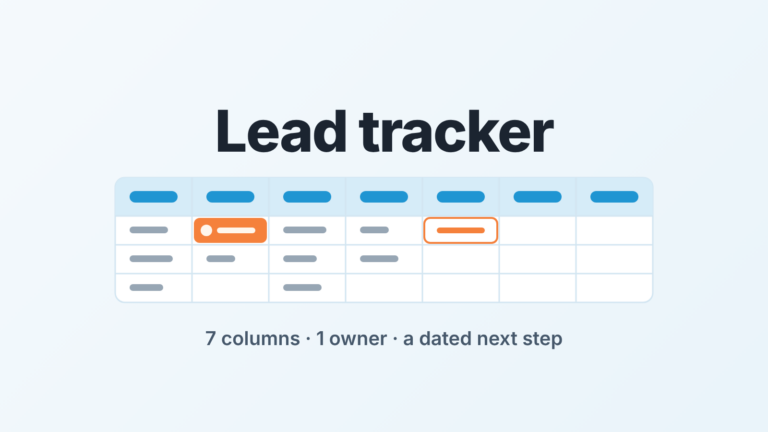
The numerator comes from deal fields: won value, deals that reached the qualified stage, won deal count. The denominator, selling weeks, comes from the calendar. Here is what we actually pull. The list is deliberately uneven: the numerator deserves more lines than the denominator, because that is where the CRM is strong.
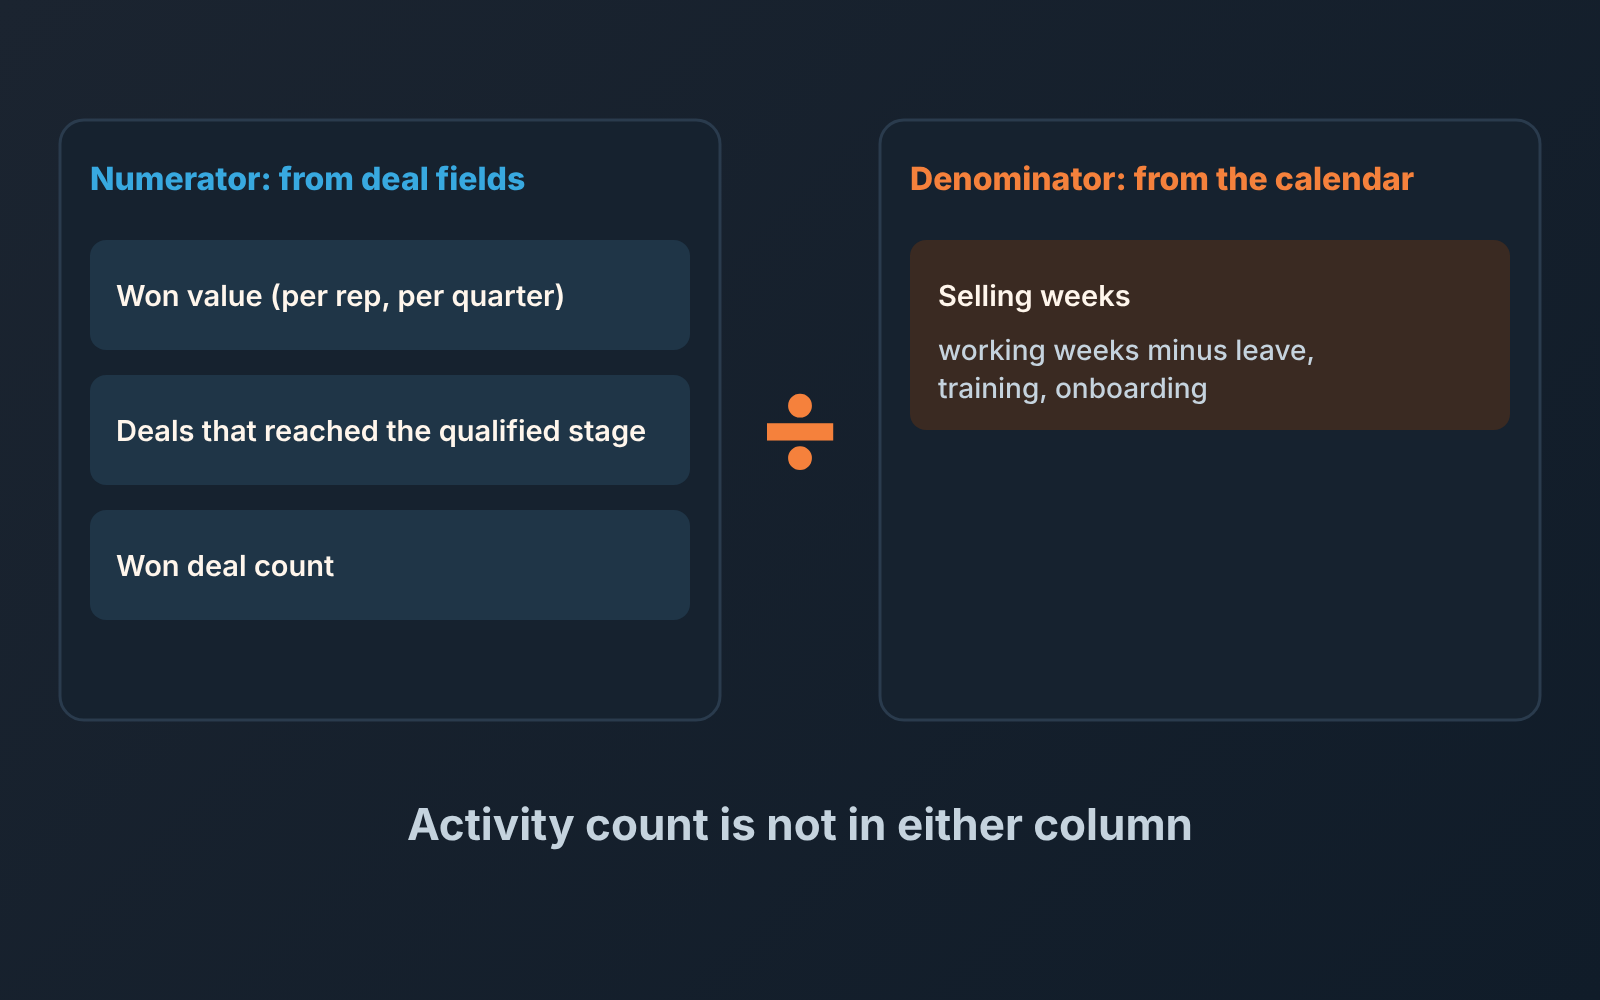
For the numerator, from the deal record:
- Won value per rep for the period. Every CRM on our list stores a deal amount and a close or won date: in HubSpot it is the Amount and Close date properties on the deal (HubSpot: default deal properties); in Pipedrive, Salesforce and Zoho CRM it is the equivalent value field plus the date the deal was marked won. Filter won deals by owner and by that date, sum the value. This is the primary output number for anyone past ramp.
- Deals that reached your qualified stage in the period. Pick the one stage in your pipeline that means “a real buyer with a real need”, and count deals per rep that entered it. Every CRM on our list records when a deal changed stage, so the count is available without any extra discipline from reps. This is the better output number for new reps and for long sales cycles, where won revenue lags the work by months.
- Won deal count, as a secondary check. Won value alone lets one large deal hide a quiet quarter. The count tells you whether the revenue came from one lucky whale or from steady work.
- Optional: average days from qualified stage to won, per rep. Not a productivity number by itself, but it explains why one rep’s revenue arrives in lumps.
For the denominator, from the calendar:
- Selling weeks in the period, counted as above; events count as non-selling days too. Keep it in a spreadsheet next to the CRM export. Nobody has to log anything; you already know who was out.
That is it. Won value and qualified deals over selling weeks, per rep, per quarter. If you want the per-activity view as well, our piece on which activity metrics are worth tracking in a small team covers that. Keep it separate from the productivity number.
Where activity counts lie
A logged activity is not a unit of effort. It is a record that someone, or something, wrote a row in the CRM. Once you look at it that way, the ways it misleads become obvious.
The first is habit. In a CRM where reps log their own calls, the number of calls measures how diligently each person logs. One rep logs every dial including the voicemails. Another logs only conversations that went somewhere. The second rep will show a third of the activity and may well have done the same work. You are comparing thier note-taking, not their selling.
The second is batching. Reps who know the weekly report exists learn to log in bulk on Friday afternoon. The timestamps cluster, the notes get thin, and the the count still goes up. A manager who notices this usually responds with a rule about logging promptly, which produces a lot of promptly logged rows and no additional selling.
The third is automation, and it cuts the other way. Connected inboxes log email automatically, or reps BCC a logging address so the CRM captures the thread (HubSpot: log email with the BCC or forwarding address). Once that is on, a rep who writes long email chains with one prospect will out-log a rep who does the same work on the phone. The activity count now measures channel preference.
Put the three together and the activity count is a blend of logging habit, report timing and which tools are connected. It is still useful as a signal: a rep whose logged activity drops to nothing for two weeks is worth a conversation. That is a habit signal, and it is the only thing we use the count for. It does not go into the productivity formula.
One number from outside the CRM is worth knowing here. Reps spend 28 percent of their week actually selling, per Salesforce’s State of Sales report (2022). The exact share on a team of six will differ, but the direction is the point: most of a rep’s week is not selling, and activity logs cover only a slice of the part that is.
Compare a rep with their own quarter, not with the leaderboard
A leaderboard makes a claim it cannot support: that the reps on it had the same inputs. In a team of six they almost never did. One rep inherited a renewal book, another is three months into ramp, a third covers a territory where the average deal is twice the size. Ranking their won value against each other tells you about territory design and tenure at least as much as about the people. Plain revenue per rep has the same flaw: a fine headline for the business, a poor verdict on one person.
So we compare each rep with themselves. Won value and qualified deals per selling week, this quarter against last quarter, for the same person. The question on the one-to-one is not “why are you fifth” but “your qualified deals per week fell from three to two, what changed”. The second question has an answer the rep can actually give. Maybe the inbound share dropped. Maybe a big account consumed the quarter. Maybe nothing changed and the quarter was simply slow, which the won count will show when it arrives.
Three practical rules for this comparison.
Look at a quarter, not a week. Weekly productivity for one rep in a small team is mostly noise, a single large deal closing on a Tuesday doubles it. A quarter has enough deals in it that the trend means something.
Give new reps a different output. For the first two quarters, qualified deals per week is the number, not won value. Revenue lags, and ranking a new rep on revenue in month two tells you only that they are new. We cover the ramp side of this in how many deals a rep can actually carry and in capacity planning for a small sales team.
Say the denominator out loud. When a rep’s number drops in a quarter where they spent three weeks onboarding the new hire, write that on the review. The number is per selling week precisely so that this is fair, and the rep should hear that it is.
If you insist on a cross-team view, show the trend lines side by side rather than a ranked list. Six lines on one chart, each rep against their own history, is a picture a team can look at together without anyone feeling ambushed.
A short note on tooling
A spreadsheet does all of the above. A CRM export of won deals and stage changes, one column for selling weeks, and you have the productivity number per rep per quarter in an afternoon. We would not buy anything to get that far .
Where a tool earns its place is the step after the number: finding out why one rep’s output moved. That means reading deals, not counters. We build SalesBond, a sales management layer on top of the CRM a team already uses, and the piece that matters for this article is Deal Health: it runs more than 20 rules against every deal and shows which ones have no next step scheduled and which carry other risk signals. A manager preparing a one-to-one gets a short list of the deals behind the dip instead of a bar chart of calls. If that would help, check your CRM with SalesBond. If a spreadsheet and a Friday hour are enough for your team, that is a fine answer too.
The number you can defend
The productivity number that survives a difficult one-to-one is the one with two honest inputs: output the rep cannot inflate and selling weeks nobody has to log. Won value and qualified deals come straight from the deal record. Selling weeks come from a calendar you already keep. Everything in between, the dials and the tasks and the logged emails, is a record of logging, and a good rep can be bad at it.
Next Monday, try reading the won and qualified columns before the activity column. Then ask whether the rep with 60 calls would have looked the same if you had never seen the calls at all.