Sales capacity planning answers one question: how many reps does your revenue target need? Divide the target by what one rep realistically closes (quota times median attainment), then discount new hires for ramp and the whole team for attrition. That gives you a headcount. With five reps, don’t stop there: check the number person by person against each rep’s last four quarters of closed-won in Pipedrive, because one departure moves the answer more than any average does.
The rest of this piece is the formula, where it misleads a team of three to eight, and the bottom-up version you can build in an afternoon from deal history you already have.
The top-down sales capacity formula everyone starts with
Every capacity-planning page you’ll find is a variant of one line. Forecastio states it as required reps = target ÷ (quota × attainment). ORM Tech writes rep capacity out in full: discounted capacity = quota × median attainment × ramp × attrition. Same idea in both. A quota is a hope, and the plan should run on what a rep actually delivers.
The discounts are where the vendors part ways, and the gap is wide. Forecastio assumes a seven-month ramp in which a new hire works at 25% of a seasoned rep, then 50%, then full; attrition of around 30%; and 65–75% of a rep’s time actually spent selling. ORM Tech quotes 15 to 18 months for ramp, more than double, and makes one point we’d underline twice: use median attainment, not average. One rep far above quota drags the average up for everyone. The median ignores her and reports what the rep in the middle did.
Those are the vendors’ assumptions, built for the orgs they sell to. Treat them as the range, not as your numbers.
If you want the quota side of the equation done properly first, our piece on setting quotas for a small team covers it; this article assumes a quota exists and asks how many people it takes to hit the total.
Where it falls apart at five reps
Run the formula on a large sales floor and it behaves. Attrition of around 30% means people leave through the year, hires are always ramping somewhere, and the blended discounts describe something real. Run it on five reps and every assumption turns into a discrete event.
Take attrition. Thirty percent of five is one and a half people. Nobody loses one and a half people. Either everyone stays and the discount was pure pessimism, or one person resigns on a Tuesday and a fifth of your capacity is gone that afternoon. If its your best rep, it’s more than a fifth. A blended attrition factor smears that cliff into a gentle slope, and the slope is what the plan ends up showing the board.
Ramp has the same problem. In a big org a single ramping hire disappears into the average. In a team of five, the quarter in which a new rep is at 25% is a specific quarter with a specific shortfall, and the plan has to say which quarter that is.
And median attainment of five people is one person’s number. That’s fine actually. It just means there is no stable “attainment rate” to plug in. There are five histories, and you may as well look at them directly.
There’s a quieter issue too. Small-team numbers are noisy: a single large deal landing in March or April changes a quarter’s picture, which we wrote about in why small-team forecasts wobble. A capacity model that reads one good quarter as the new normal will tell you to hire for a wave that was one deal.
Count it bottom-up from Pipedrive
Instead of a rate, use the deals. Pipedrive has every closed-won deal with its owner and the date it was won, which is all the model needs. The activities on those same won deals give you hours per won deal, which shows whether the smallest ones are worth the capacity.
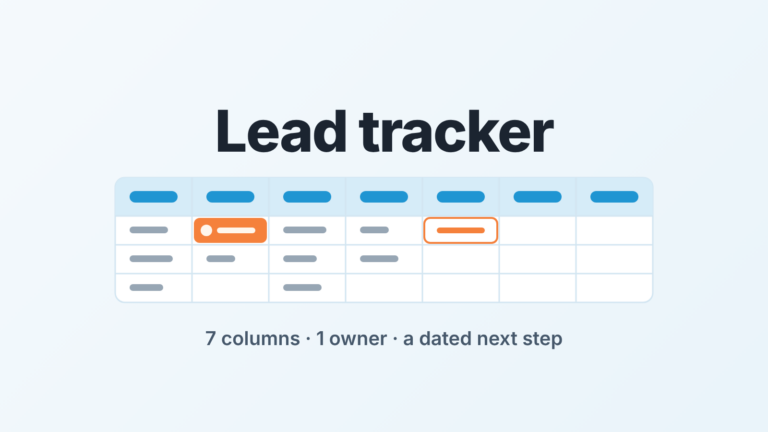
- Open the Deals list, filter it to won deals and keep only those with Won time in the last four full quarters. Copy Owner, Won time and Value for each deal into a sheet. If you’d rather stay in Pipedrive, a deal performance report in Insights, viewed by won time and segmented by owner, gives the same grid.
- For each rep, write down four quarterly closed-won totals. Only full quarters count; a rep who joined mid-year gets fewer rows and a note saying so.
- Take each rep’s median quarter, the middle of the four, not the total divided by four. This is the ORM Tech principle applied to one person: a freak quarter shouldn’t set that rep’s expected output.
- Add the medians. That sum is your realistic quarterly capacity with the people you have, before anyone ramps or leaves.
- Compare it to the quarterly target. The gap divided by the median rep’s median quarter is the number of fully ramped reps you’re short, which is the honest input the top-down formula was trying to approximate.
Before hiring against that gap, make sure the target itself survives a bottom-up check from the deals reps can actually see.
Keep the per-person grid. It is the only artifact in this article that matters, and the the next section runs two tests on it. If you want output per hour of selling rather than per quarter, here is a rep productivity formula built on CRM data.
One check before you move on: if your quota was set sensibly, quota × attainment and the median quarter should land close to each other for most reps. When they’re far apart, the quota is usually the number that’s wrong, not the history. And if the medians are low because reps are carrying far too many or far too few open deals, that’s a workload problem, which we handle in how many deals one rep can work, and more headcount won’t fix it. If you’re not sure which one you have, start with whether it’s a rep problem or a pipeline problem.
Bring the result to the quarterly business review so the hiring decision gets an owner and a date.
The ramp haircut and the one-departure test
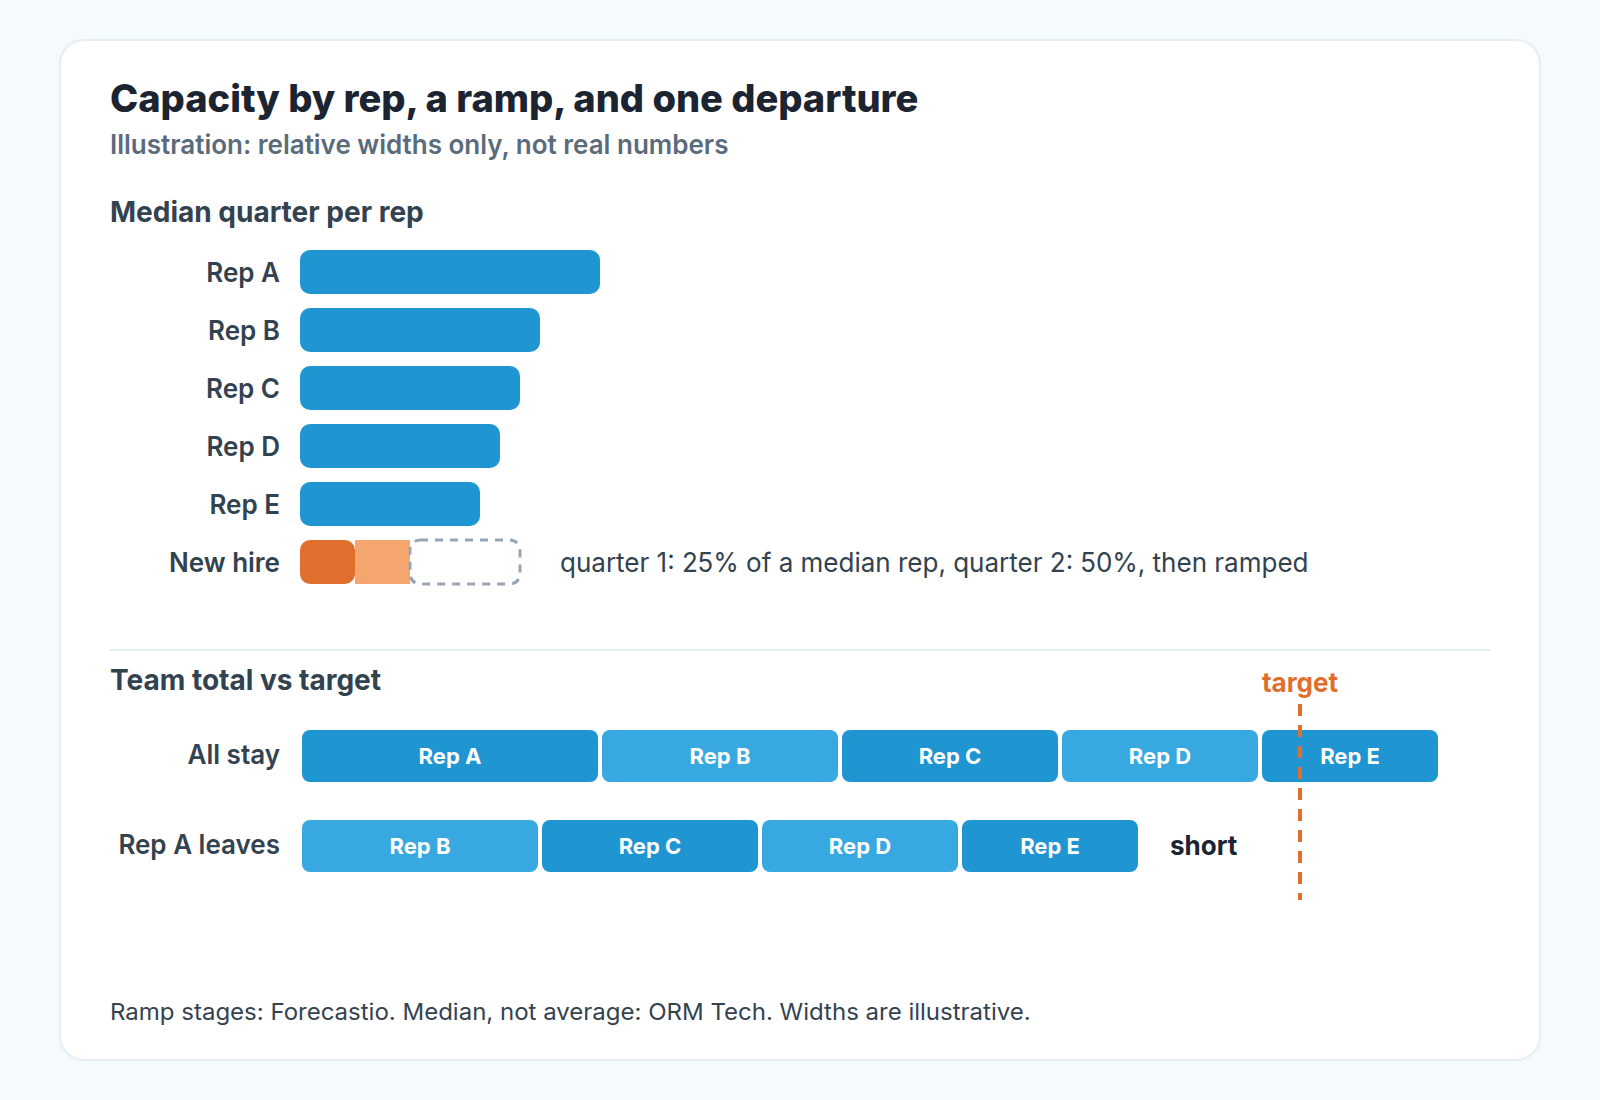
A new hire does not add one rep to the grid. On Forecastio’s ramp a hire adds roughly a quarter of a median rep’s output at first, then half, then the full amount after seven months. On ORM Tech’s figures, full output arrives at 15 to 18 months. Which end of that range you plan on depends on your sales cycle. Our position: if a deal takes longer than a quarter to close, the hire cannot have a full quarter of closed-won until the first pipeline she built has had time to move, so plan on the long end and treat anything faster as upside. The 30-60-90 onboarding plan is what you do to make the short end possible.
So the ramp haircut on the grid is simple. Add the new hire as a row, give that row 25% of the median rep for the first stage and 50% for the second, and look at the quarterly sums with the real dates on them. The plan now shows which quarters are short and by how much, instead of an annual number that averages the shortfall away.
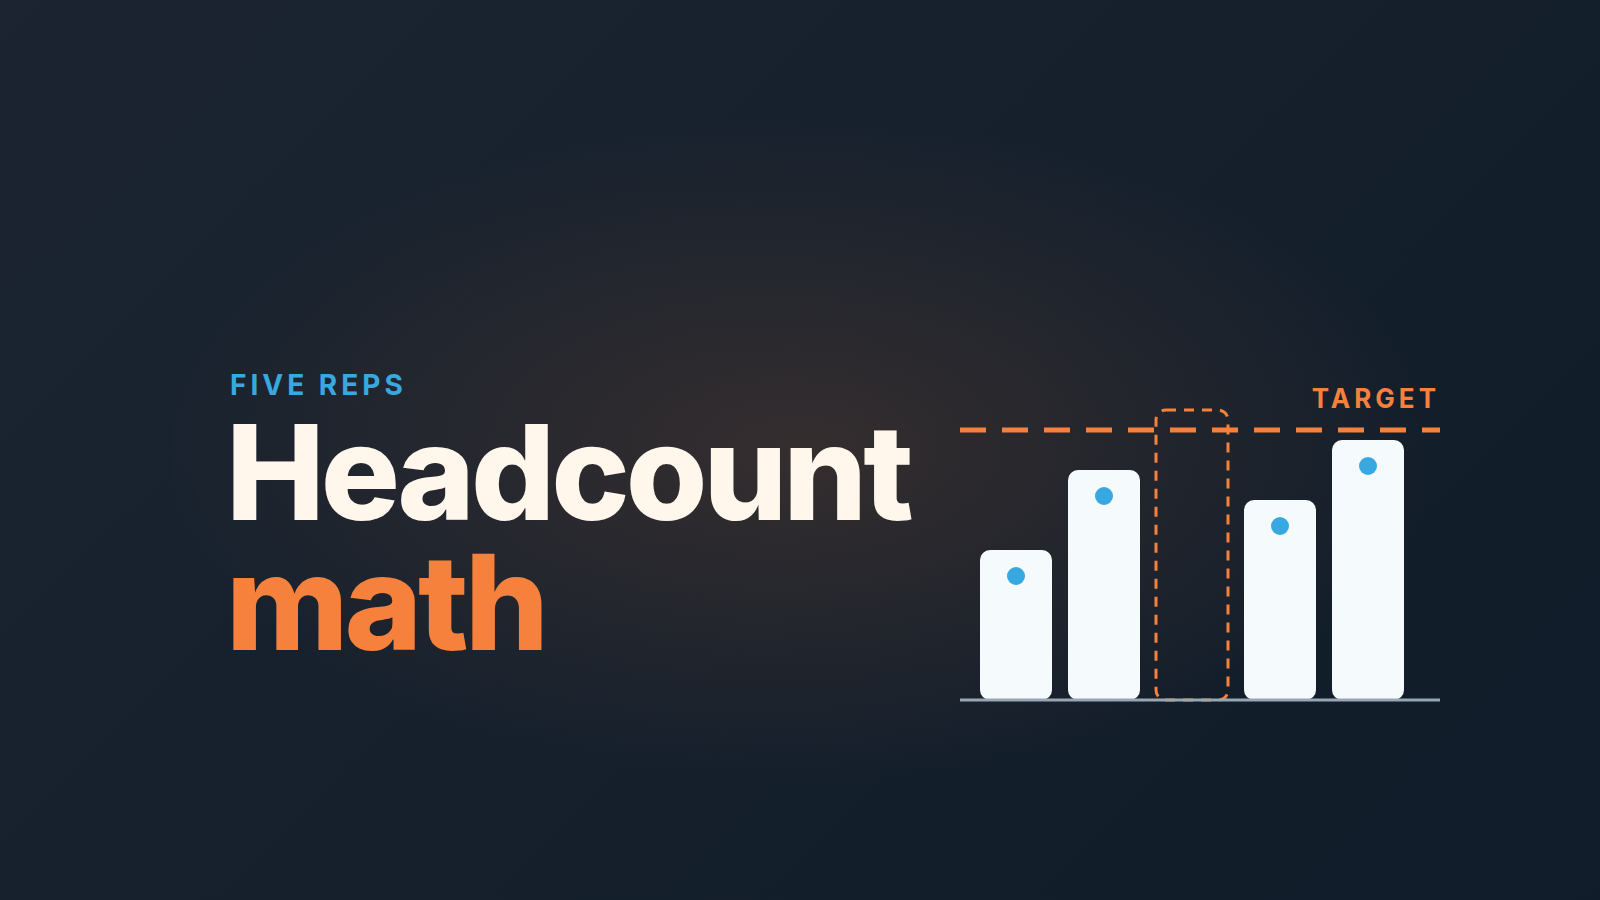
Then the departure test, which for a team this size matters more than ramp. Delete the top row of the grid. Does the remaining sum still clear the target? Now delete the median rep instead. The gap in each case is the real exposure, and it persists for the months it takes to hire plus the ramp, so for months the replacement closes a quarter to a half of what the person who left did.
The sentence this gives you for the planning meeting is short: “The number holds if nobody leaves. If our top rep leaves, we’re short by her median quarter minus a ramping replacement, for as long as hiring plus the ramp takes.” That’s a plan a founder can argue with. “We assumed 30% attrition” isn’t.
When a rep does leave, their accounts need new owners by a rule, not a scramble: a territory plan fits on one page.
A long absence opens a smaller version of the same gap; quota relief for vacation and leave covers how to adjust the target.
So when do you hire?
Hire when the sum of medians, with ramp haircuts applied to anyone still ramping, sits below the target even if everyone stays. That’s the formula answer, and the grid makes it visible by quarter rather than by year. If the hire you are planning is the first one, there are no rep medians yet, so start from a founder-led sales baseline instead.
The second trigger is the one the top-down models never surface: hire when the one-departure test fails and you couldn’t absorb it. For three to eight reps this is usually the decision that actually gets made, because losing one person is not a 30% risk spread across the year, it’s a single event that takes the year with it. Hiring ahead of the test costs you the on-target earnings of a rep through the ramp months; the OTE numbers for a first sales hire give the shape of that cost. Not hiring means one resignation letter and a missed number. Neither choice is wrong. Making it by accident is.
The test shows the gap; what to do the week a rep actually resigns is a different problem, and we covered it step by step.
We’d rather see a five-rep team hold a grid with real names and real quarters than a spreadsheet with an attrition rate borrowed from a vendor’s blog. The grid tells you whose resignation would hurt and when you’d feel it. The rate tells you that 1.5 people will leave, which has never once happened.
So before the next planning meeting, pull the four quarters, put a name on every row, and delete the top one. Whatever the sum does then is the conversation to have.