
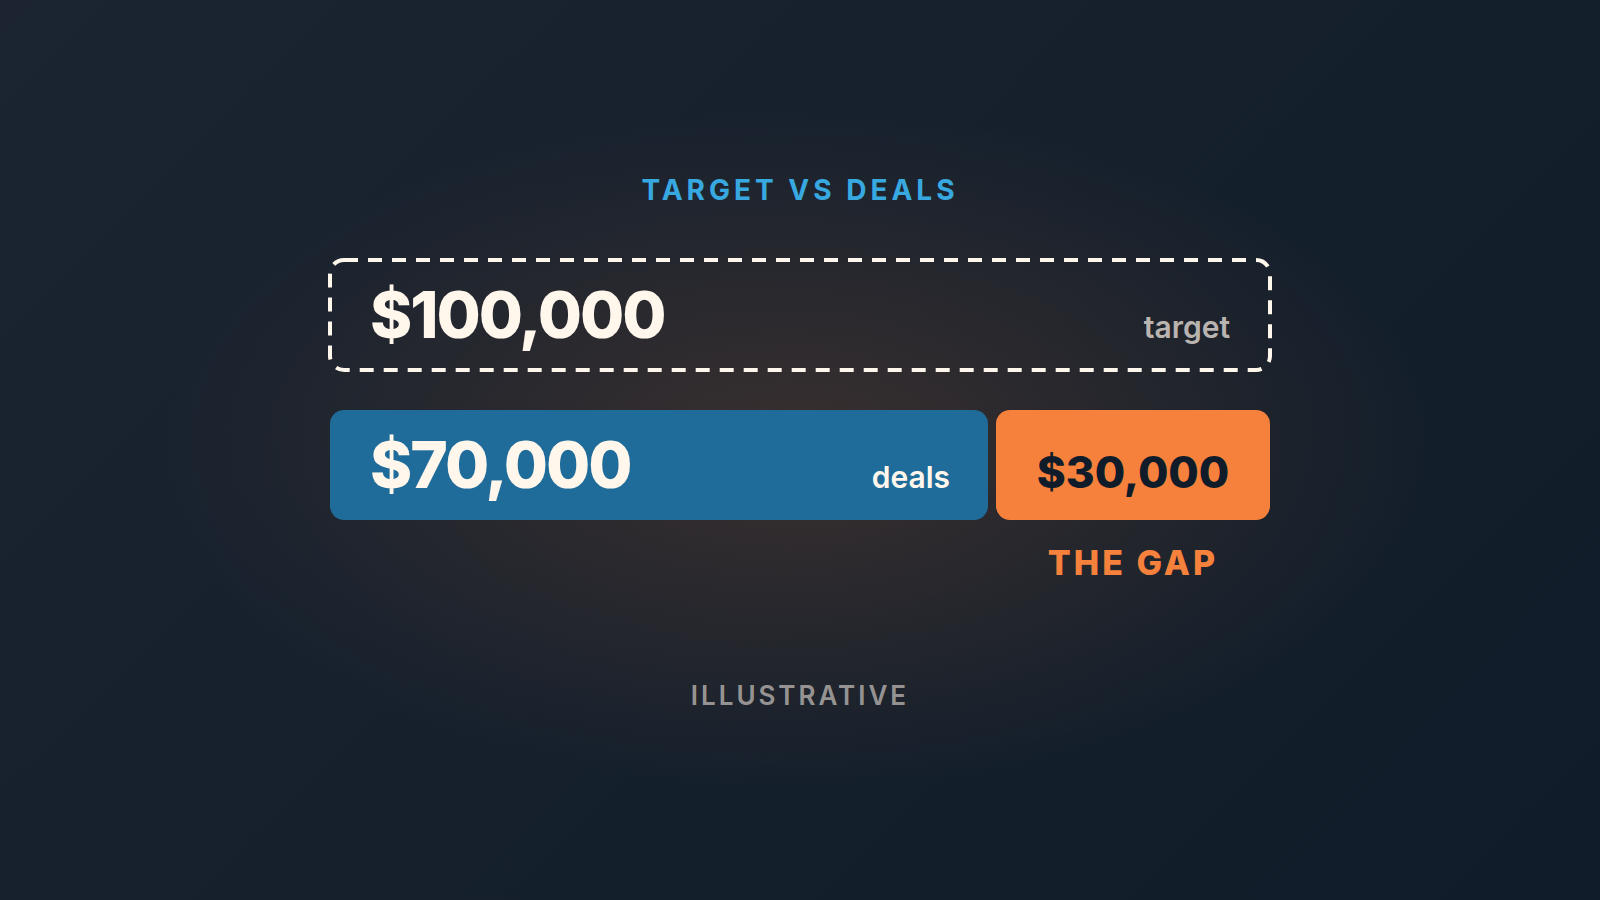
A top-down forecast starts from the revenue target and splits it across the team. Bottom-up forecasting adds up the deals each rep actually has, with a close date inside the period. The two numbers are supposed to disagree. The difference between them is not a reason to pick one and ignore the other; it is your pipeline plan for the rest of the period, written in money.
Most guides stop at the team-level gap. We take it rep by rep, and down to the three CRM fields that decide whether a deal counts at all.
Two numbers, one gap
Say the quarter’s target is $100,000. (Every figure in this post is an illustration, not a benchmark.) Five reps, $20,000 each. That per-rep share is the quota: the slice of the target a rep is expected to bring in. It’s the top-down number, and it was decided before the quarter started.
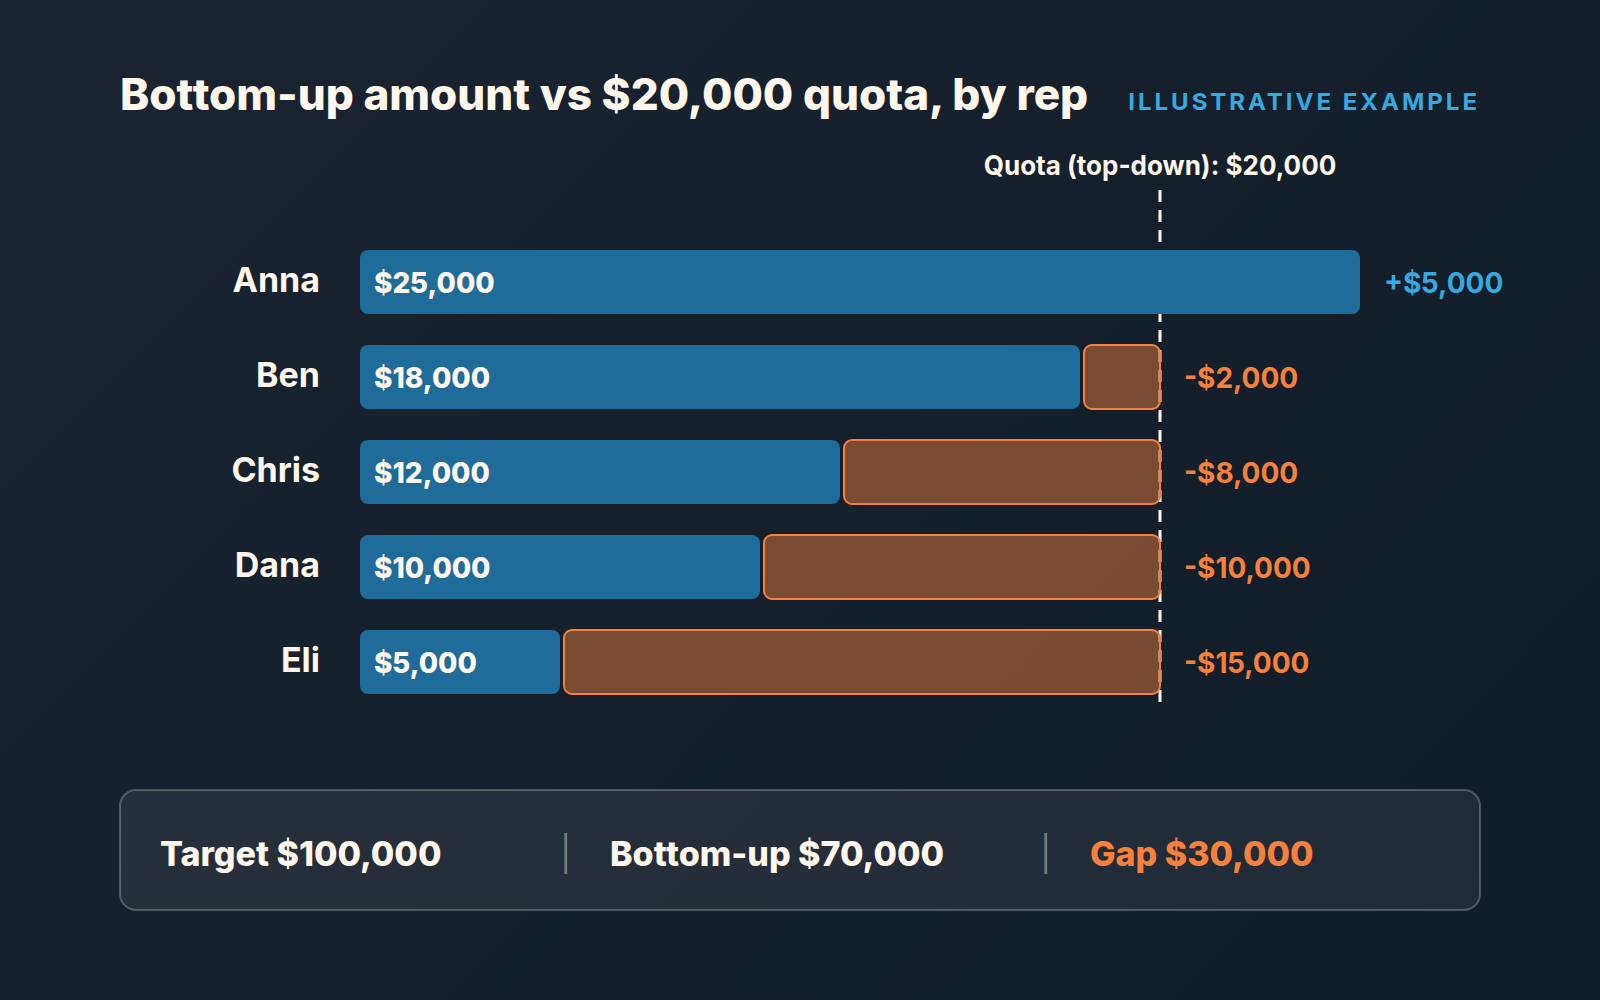
Now open the CRM, filter deals to an expected close date inside the quarter, and sum them rep by rep. Anna has $25,000. Ben has $18,000. Chris has $12,000, Dana $10,000, Eli $5,000. Total: $70,000. That’s the bottom-up number, and it changes every day.
So the team is $30,000 short on paper, with the quarter still open. What happens next?
Usually one of two bad things. The manager says “the target is the target” and the gap becomes pressure. Or the manager says “the pipeline says 70, so 70 it is” and quietly re-forecasts the quarter downward. Neither is reconciliation. Reconciliation is asking where the 30 comes from and which part of it the team can still close.
Top-down: where the target comes from
The top-down number is a decision, not a measurement. Somebody took last year’s revenue, a growth expectation and the cost of the team, and produced a figure the business needs. That figure was then divided by heads, by territory, or by last year’s share. If you want the mechanics of that division we wrote them up in how to set sales quotas for a small team, and the capacity side in sales capacity planning when you have five reps.
One property matters here: a top-down number doesn’t move when a deal slips. It can’t tell you anything about this quarter’s deals, because it was never built from them. That’s not a flaw. It’s the point. The target is the fixed line everything else gets measured against.
The mistake is treating it as a forecast. A target says what the business needs. A forecast says what the pipeline will produce. When a manager reports the quota to the owner as the expected result, the owner finds out about the shortfall in the last week, which is the most expensive moment to learn it.
Bottom-up forecasting: summing deals, and why it only works on clean data
Bottom-up is the sum of open deals, each counted at its value or at a discounted value, filtered to the period. Weflow’s guide describes it as reps submitting deal-level predictions that roll up into a company-wide forecast, weighted by stage probabilities, and warns that stale pipeline data produces stale forecasts (Weflow: bottom-up forecasting). We’d put it more bluntly: a bottom-up forecast is exactly as good as the three fields its built from.
Those fields, in Pipedrive, are the deal value, the expected close date and the next activity. If the value is a rep’s guess, the sum is a guess. If the close date is the day the deal was created plus thirty days, every month’s bottom-up number looks healthy on the first and collapses on the twentieth. And a deal with no next activity scheduled is a line in a report, not a deal.
So we only count a deal toward the period if it passes three rules, and we call the result the qualified bottom-up number. The value has to be one the buyer has seen, not one the rep estimated. The expected close date sits inside the period and has moved at most once. And there is a next activity with a date, scheduled with someone on the buyer’s side.
For recurring contracts, that value reads better as ACV instead of a mixed deal value.
A deal that fails any of these stays open and stays in the pipeline. It just doesn’t count toward the period’s number. That sounds harsh until you compare it with the alternative, which is a forecast you have to apologise for. Finance asks a different question of the same bottom-up list, not which deals close but when the money arrives, and a cash flow forecast built from your CRM pipeline answers it.
Whether you then weight each deal by stage is a separate choice, and stage percentages have their own problems, which we went through in why stage percentages lie in a weighted pipeline forecast. For the reconciliation below, start with the unweighted sum of deals that pass the three rules. Add weighting once you trust the raw list.
Reading the gap: coverage, cycle length, who is short
Back to the example. Target $100,000, qualified bottom-up $70,000, gap $30,000. Three questions turn that gap into a plan.
Is there enough pipeline behind it? The bottom-up number counts deals dated this quarter. Behind them sits everything else that’s open. If the total open pipeline is, say, $210,000 and the team has historically won about a third of what it opens, the raw material for $70,000 is there and not much more. If open pipeline is $400,000, the gap is a timing problem, not a volume problem. The pipeline coverage ratio is the quick way to read this, and your real win rate from Pipedrive is what makes the ratio honest rather than hopeful.
Can the gap still close in time? A deal created this week can’t close this quarter if the team’s cycle runs ninety days. So part of the $30,000 is already lost for this period and belongs to next quarter’s number. Knowing your sales cycle length tells you how much of the gap is still in play, and where the manager should stop pushing.
Who is short, and why? The team gap is $30,000, but it isn’t spread evenly.
| Rep | Quota | Bottom-up | Gap | What the deals say |
|---|---|---|---|---|
| Anna | $20,000 | $25,000 | +$5,000 | ahead; nothing to fix |
| Ben | $20,000 | $18,000 | -$2,000 | one deal away; a normal week |
| Chris | $20,000 | $12,000 | -$8,000 | two deals with close dates pushed twice |
| Dana | $20,000 | $10,000 | -$10,000 | thin pipeline, few new deals this quarter |
| Eli | $20,000 | $5,000 | -$15,000 | new rep, still ramping |
Illustrative numbers. The point of the last column is that the same dollar gap calls for different actions. Chris needs a deal review on two specific records. Dana needs prospecting time, and probably needed it a month ago. Eli is ramping, which means he’s new and still building the pipeline a full quota assumes; his gap was predictable when the quota was set, and the honest fix is to adjust his number rather than wait for a miracle. Ben is one ordinary week from target. Take those two out, and the part of the gap that needs a manager’s action this month is Chris’s and Dana’s $18,000.
Do this and the gap stops being a number the team feels bad about. It becomes three or four named actions, each with an owner.
A monthly routine in Pipedrive
Run it on the first working day of the month. For a team of five it’s a single sitting, not a project, and nothing in it needs a forecasting add-on.
Start from the deal list, filtered to open deals with an expected close date inside the current quarter, grouped by owner, with value, expected close date and next activity shown as columns. That view is the bottom-up number before any judgement is applied. Read it once as it is, then apply the the three rules from above. Deals that fail a rule get a note in the review, not a change in the report. Moving a close date to make the number look right is the one move that’s never allowed, because it hides the gap exactly when you need to see it.
Write the qualified bottom-up total next to the quota for each rep. Then ask the three questions in order. Coverage first, because if the pipeline isn’t there no amount of deal coaching fixes this quarter, and the conversation should turn to prospecting. Cycle second, so you stop spending review time on deals that can’t land before the period ends. Who last, so every remaining dollar of gap sits with a named rep and a named deal.
The output is short. One line per rep: quota, qualified bottom-up, gap, and the one thing that changes this month. Keep the file. Three months of these lines show you more about where your forecasts go wrong than any comparison of sales forecasting methods will, and they’re the input for tightening forecast accuracy on a small team.
A disclosure, since this is the part of the job we build software for: we build SalesBond, a sales management layer on top of the CRM a team already uses; we started with Pipedrive. Its Sales Plan keeps the target, the forecast and the gap between them side by side, with the deals most connected to the plan underneath, so the arithmetic above stops being a spreadsheet you rebuild every month. The judgement about Chris’s two deals is still yours. If you’d rather not rebuild that view by hand, check your CRM with SalesBond.
When bottom-up lies
A bottom-up number can be wrong in both directions, and the gap analysis only works if you know which way it’s leaning.
It runs high when close dates are optimistic by default. If most of your deals carry a date in the current period because that’s where the rep put it on day one, the sum looks like a forecast and behaves like a wish list. The tell: a bottom-up number that drops sharply in the last week of every period. The fix is the close-date rule, applied consistently, plus a look at how deals have actually moved through your stage conversion rates rather than how reps hope they will.
It runs low when reps sandbag. A rep who was burned last quarter keeps deals undated, or dated next period, until they’re certain. The number looks thin, the manager panics, and then three deals close in the final week that were never in the forecast. Here the tell is a team that beats its own bottom-up number every single period. Your commit and best case split catches this earlier, because it makes the rep name the one thing standing between a deal and the number.
And it runs nowhere at all when the data is stale. A deal with no activity in six weeks and a close date next Friday is not a forecast input. It’s a cleanup task, and it goes on the list before next month’s review.
FAQ
Is bottom-up forecasting more accurate than top-down?
It reflects the deals you actually have, so it’s closer to what will close, but only if value, close date and next activity are kept current. Top-down isn’t a forecast at all. It’s the target you measure against.
When should a small sales team use top-down vs bottom-up?
Use both every month. Top-down sets the number the business needs, bottom-up shows what the pipeline can deliver, and the gap between them is the plan.
What does a bottom-up forecast need from the CRM?
Three things per deal: a value the buyer has seen, an expected close date inside the period, and a scheduled next activity.