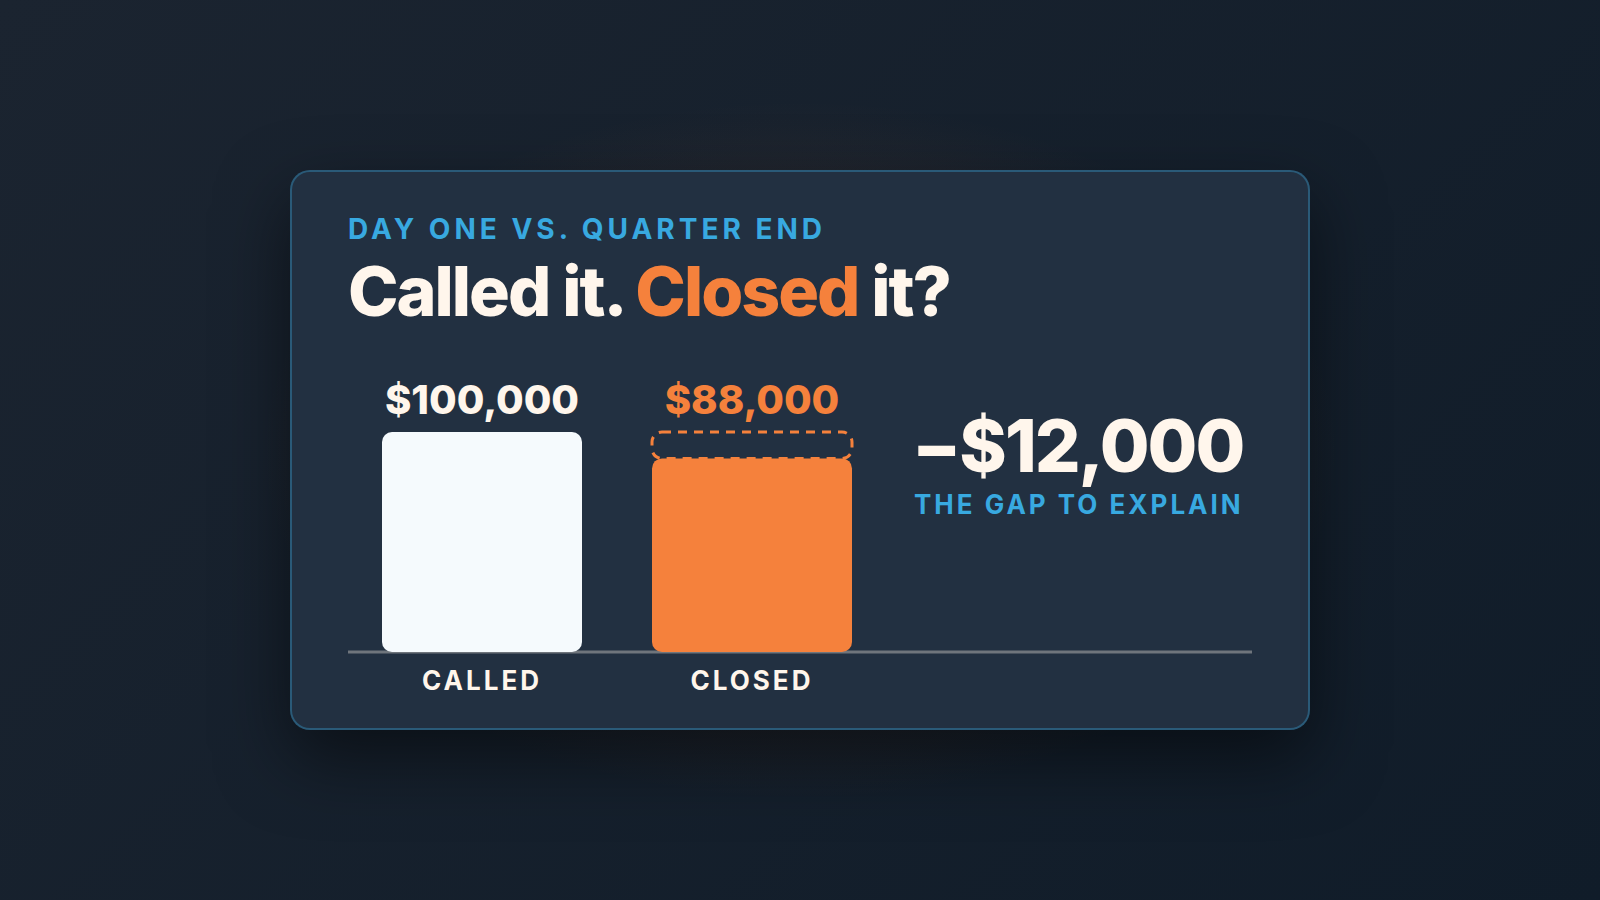
Sales forecast accuracy is how close the number you called on day one was to what you actually closed: 1 minus the absolute gap divided by the actual. A team that forecast $100,000 and closed $88,000 (hypothetical) was 86.4% accurate on that call. More usefully, it knows it over-called by $12,000.
That second part is the point. The percentage is for the slide. The $12,000, and the three or four deals behind it, are what you can act on. This piece is about grading a forecast after the quarter closes. If you still need to decide what goes into the number, start with commit versus best case or the weighted pipeline forecast and come back here in three months.
Freeze the forecast on day one, or there is nothing to grade
You cannot measure accuracy against a number that kept moving. A forecast updated every Monday will look right by week twelve, because by week twelve it is just a list of deals that closed. The only version worth grading is the one you had before anything happened.
So the first habit is dull: on the first working day of the quarter save the forecast somewhere it cannot be edited. Export your open deals from Pipedrive with an expected close date inside the quarter, keep the ones you are actually calling, and store that export as the frozen snapshot. Each row needs the rep, the deal name and ID, and the amount and expected close date exactly as they stand that morning; if deals come in more than one currency, write down the currency and rate with the snapshot. Add the category you put the deal in (commit, best case or not called), and write the team total as one number at the top of the sheet.
A spreadsheet tab named for the quarter works. So does a PDF. Either way, nobody touches it again. If someone wants to update the call, that is a new forecast with a new date, kept next to the old one and never over it. The frozen file is the exam paper; the rest of this article is marking it.
One more detail saves an argument later. Write down the rule you used for “commit” in the same file. Three months from now, when a rep says a deal “was never really commit”, you want the definition on the page and not in anyone’s memory.
The forecast accuracy scorecard: team and rep
At the end of the quarter, export won deals from Pipedrive for the same date range and put them next to the frozen snapshot, after checking that won time was not edited after the fact. The scorecard is a single table.
Here is a hypothetical four-rep team that called $100,000 and closed $88,000. Accuracy is (1 – |forecast – actual| / actual) x 100, the usual formula; for the team row that is (1 – 12,000 / 88,000) x 100 = 86.4%.
| Rep | Called on day one | Closed won | Gap | Accuracy | Direction |
|---|---|---|---|---|---|
| Anna | $30,000 | $27,000 | -$3,000 | 88.9% | over |
| Ben | $25,000 | $31,000 | +$6,000 | 80.6% | under |
| Carla | $25,000 | $18,000 | -$7,000 | 61.1% | over |
| Dev | $20,000 | $12,000 | -$8,000 | 33.3% | over |
| Team | $100,000 | $88,000 | -$12,000 | 86.4% | over |
Read the team row first, then stop trusting it. 86.4% sounds like a decent quarter. But the rep gaps add up to $24,000 in absolute terms, twice the team gap, because Ben’s $6,000 under-call hid a third of the $18,000 the other three over-called. A team number is a netted number. Two reps wrong in opposite directions will make the team look precise while both of them are guessing.
If you want one figure that doesn’t net out, divide the sum of absolute rep gaps by what closed: $24,000 / $88,000. Other guides call this weighted MAPE, or WMAPE. Here it puts the team at 72.7% instead of 86.4%, and the difference between those two numbers is exactly the guessing the team row hides.
Still, the rep view is where the work is. Dev called $20,000 and closed $12,000. That 33.3% is the row that needs a conversation.
Two notes on the arithmetic. The formula divides by actual, so a rep who closed nothing that quarter gets no percentage, only a gap; leave the cell blank and write the gap. And the percentage can go negative when the miss is larger than what closed. That’s fine. It still means what it says: the call was further from reality than reality was from zero.
Keep the table for at least four quarters, one tab each. The pattern across quarters is the product. A single quarter is weather.
Wrong deal, wrong date or wrong amount
A gap is a number. A miss is a deal. The table tells you how far off you were, and the the only way to learn anything is to go down the frozen list one deal at a time and ask what went wrong.
Take every deal you called in the snapshot and find it in the won export. If it is there at the same amount, it was a hit; move on. If it is not there at all, look at where it is now. A lost deal is a wrong-deal miss: the forecast said this would close and the buyer said no, so the question sits with qualification and discovery. A deal still open, with its close date now in the next quarter, is a wrong-date miss. The deal may well be real, but the timing was a guess, and the fix lives in how close dates are set and how often they slide. If pushed dates turn up more than once or twice in the same list, that is the pattern in pushed close dates in Pipedrive, and it deserves its own fix rather than a footnote here.
Grading is easier when you also froze a range up front, which is what we recommend when one deal is over a third of the forecast.
A deal that closed for a different amount is a wrong-amount miss. Most of the time the day-one amount was a placeholder, or a discount arrived at the end that nobody had budgeted for. With three packages on the table, good, better, best pricing is a common source of that placeholder.
Then do the reverse pass. Go through the won export and mark every deal that was not in the snapshot. Those are the late adds, deals that closed inside the quarter without being called on day one. In the example, Ben’s $6,000 under-call is probably one of these. Late adds are not a crime. But a rep whose quarter is made of them every time is either sandbagging or working a pipeline that stays out of the CRM until it is nearly done, and in both cases the day-one number was never really a forecast.
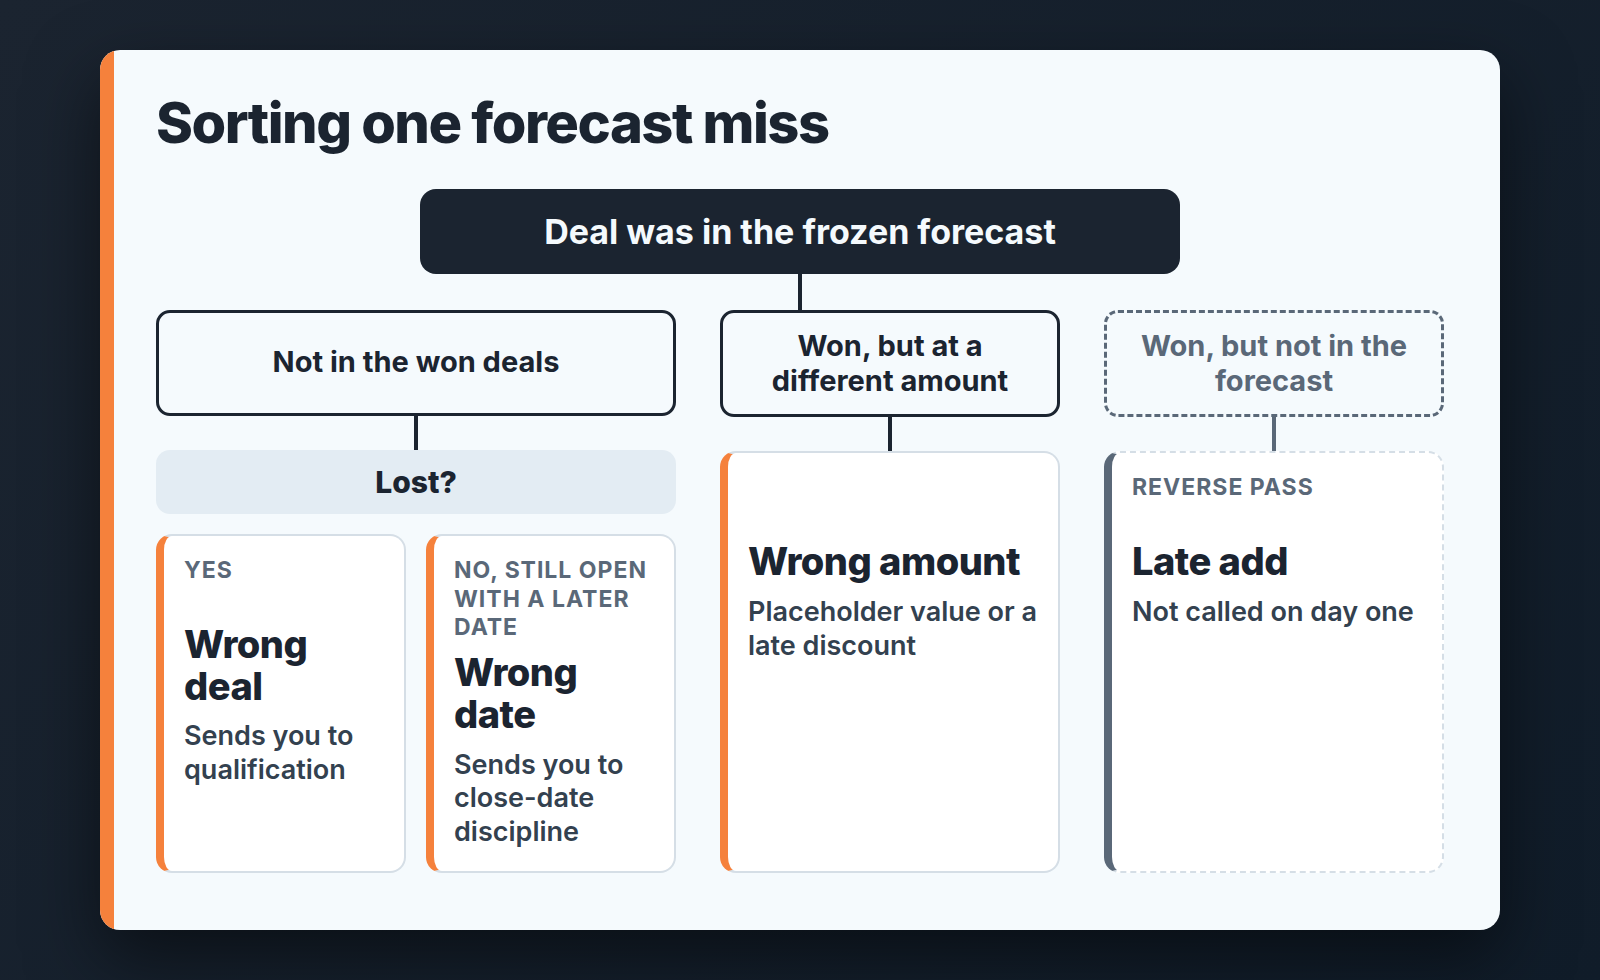
Write the category next to each deal on the scorecard tab. After one quarter you have a count of each type per rep, and the counts say more than the percentages. Four wrong-date misses and zero wrong-deal misses is a team that knows its buyers and cannot read a calendar. Flip the mix and you have a team that pushes everything to commit and hopes.
For the cycle-length side of wrong-date misses, see how we calculate sales velocity in Pipedrive.
Bias is a coaching problem, noise is a data problem
Bias is a miss in the same direction quarter after quarter. Noise is a miss that changes direction. Look at the Direction column across two or three quarters before you decide which one you have.
Carla and Dev both over-called. If they do it again next quarter, that is bias, and bias comes from the person’s habits. A rep who always calls high is listening to the hopeful half of every conversation, a rep who always calls low is holding deals back so the quarter looks like a win. Both are covered, with what to say in the one-on-one, in sandbagging versus happy ears.
Our rule for a small team: two misses in the same direction by the same rep, and that rep’s next forecast review is about judgement. Go through their commit list asking what the buyer has actually done. Adjust their calls together until the direction flips or the gap shrinks.
Noise looks different. A rep who was $7,000 over one quarter and $5,000 under the next is working from bad inputs. The amounts on their deals are placeholders, the close dates are whatever was typed at creation, the stage does not match what the buyer has done. You don’t coach that. You fix the fields. Q4 is where this goes wrong fastest, so forecast the year from deals with a hard deadline and put the rest on separate lines. The checks in revenue at risk in the pipeline catch stale amounts and dates before they land in a forecast; run them on day one, before you freeze, and much of the noise is gone from the next scorecard before it starts.
The team row can be noisy or biased too. A team that over-calls three quarters running has a commit definition that is too loose. Change the definition, rather than four people’s habits one by one.
What is a good forecast accuracy for a small team?
For a team closing a dozen deals a quarter, a good forecast is one whose team gap is smaller than its largest commit deal, and shrinks quarter over quarter.
We won’t give you a percentage, and we would rather say so than borrow one. Accuracy on a commit call depends on how many deals are in it. A team closing twelve deals a quarter has each deal worth something like a twelfth of the number, so one buyer going quiet in the last week moves the accuracy by that much on its own. A benchmark built on hundreds of deals a quarter does not transfer to that.
So set the bar against your own history. The first scorecard is the baseline, and nobody gets judged on it. From the second quarter on, ask two things: is the team gap smaller than last time, and is the biggest single miss smaller than the biggest single deal in the commit? If your largest commit deal is $15,000 and your team gap is $12,000, the forecast landed within one deal of reality. For a team this size that is a fair description of “good”. If the gap is bigger than any one deal, you are looking at a pattern rather than a surprise, and the classification pass will show which one.
If the misses keep coming from the method rather than the reps, check it against the sales forecasting methods a team with your deal count can actually feed.
Coverage is the other sanity check. A forecast that was hit by closing deals nobody called was lucky, and a quarter where commit was met out of a thin pipeline usually means the next one will not be. The pipeline coverage ratio belongs on the same sheet as teh scorecard, so a precise call on a half-empty pipeline reads as the warning it is.
Thinking a tool would grade this better? It can only grade what was frozen. AI forecasting for a small team covers what the data has to look like first.
The same goes for platforms sold as revenue intelligence: see whether your CRM data can support one before you buy.
Freeze on day one, grade on the last day, name every miss.
FAQ
How do you calculate sales forecast accuracy?
Take the forecast you froze on day one, subtract what actually closed, drop the sign, divide by what closed and subtract from 1. $100,000 called and $88,000 closed is 86.4% (hypothetical).
Should you track forecast accuracy by rep or by team?
Both, but trust the rep view. A team number nets over-calls against under-calls, so two reps wrong in opposite directions can make the team look precise.
How often should a small team measure forecast accuracy?
Once a quarter, against the snapshot frozen on its first working day. Keep at least four quarters side by side; one quarter says little.
Why is our sales forecast inaccurate?
Every miss is a wrong deal, a wrong date or a wrong amount, plus late adds that were never called. Count them per rep: same-direction misses point to coaching, random ones to bad CRM fields.