
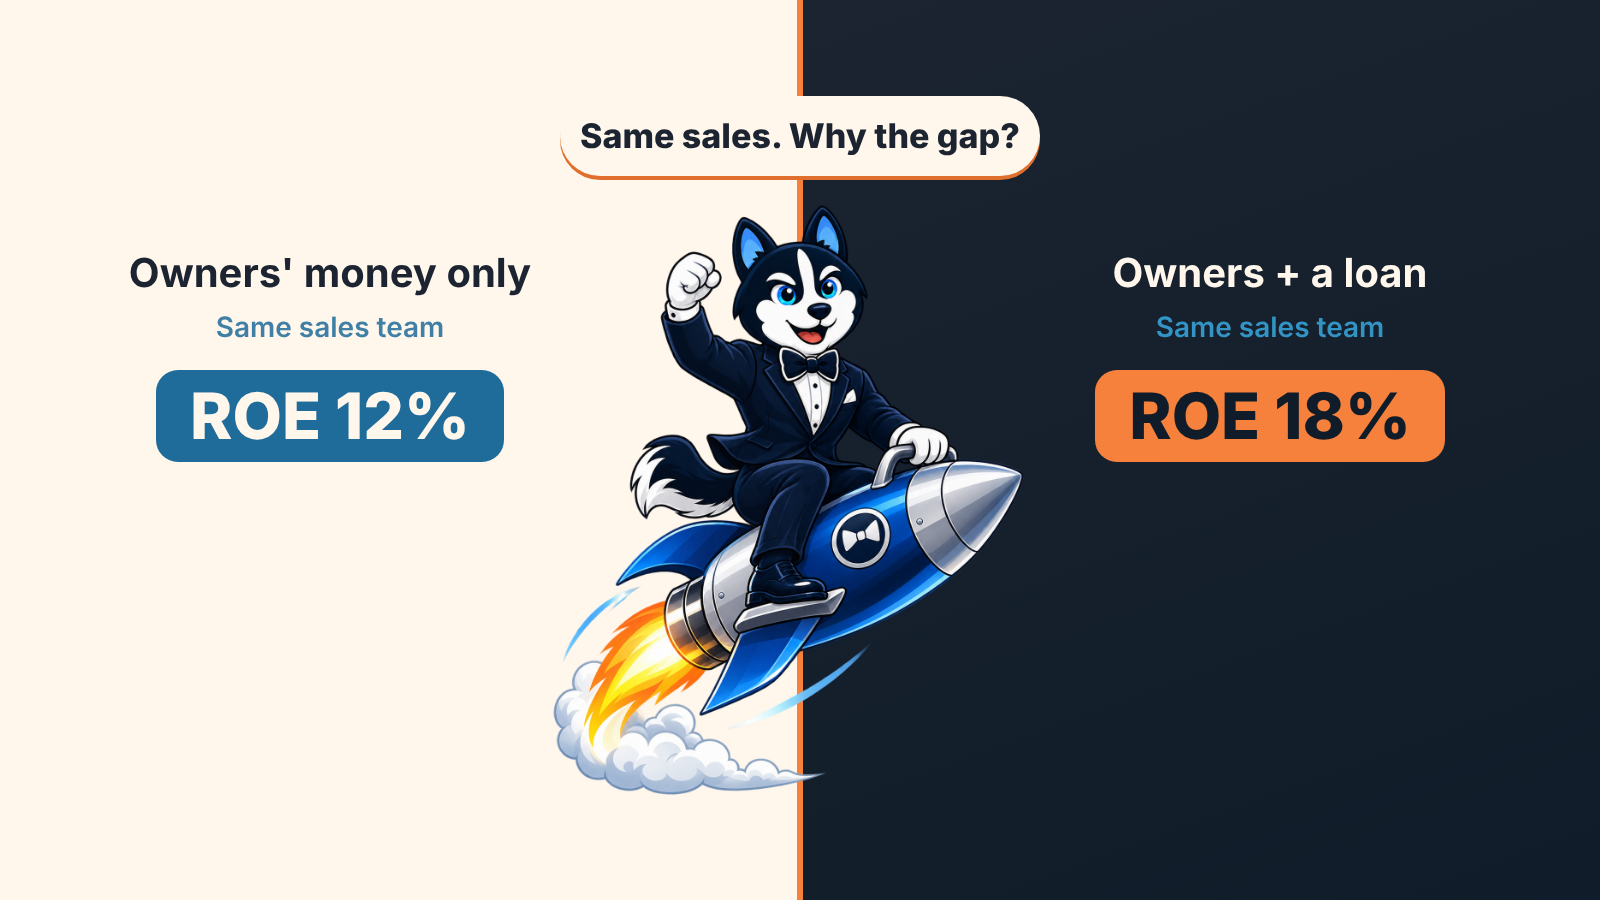
By the standard definition used by Wikipedia and CFI, return on equity (ROE) is net income divided by shareholders’ equity, shown as a percentage (Wikipedia: Return on equity; CFI: Return on Equity). It tells you how much profit the business earns on each dollar the owners have put in or left in the company. Debt moves it too. Read ROE next to return on assets and the debt-to-equity ratio (together they show how much of the result comes from borrowed money) before you draw a conclusion from it.
How to calculate return on equity
ROE = Net income ÷ Average shareholders’ equity × 100.
Average equity means opening plus closing equity for the year, divided by two. Wall Street Prep’s guide to ROE divides by that average balance (Wall Street Prep), and CFI notes that analysts also use the beginning or the ending number (CFI). We’d take the average for any company whose equity changed a lot during the year, and then keep the same method every year. A ratio you calculate one way in 2025 and another way in 2026 mostly tells you about the method.
What does the percentage mean? Wikipedia describes ROE as how many dollars of profit are generated for each dollar of shareholders’ equity (Wikipedia), so an ROE of 20% is 20 cents of net income a year on every dollar of owners’ money in the business.
Net income is the bottom line of the income statement, after cost of goods, salaries, rent, interest and tax. If the gap between that line and the one your team talks about is fuzzy, start with gross profit vs net profit. Equity comes from the balance sheet. Wikipedia’s article on ROE puts it this way: shareholders’ equity can be calculated by taking all assets and subtracting all liabilities, so ROE is also a return on assets less liabilities (Wikipedia). That’s the accounting equation solved for equity. With the numbers from Company A below: $60,000 of net income ÷ $500,000 of equity = 0.12, and 0.12 × 100 = 12%.
This is general information and not financial advice. Every company number from here on is an illustrative example made up to show the mechanics.
Same sales team, two balance sheets
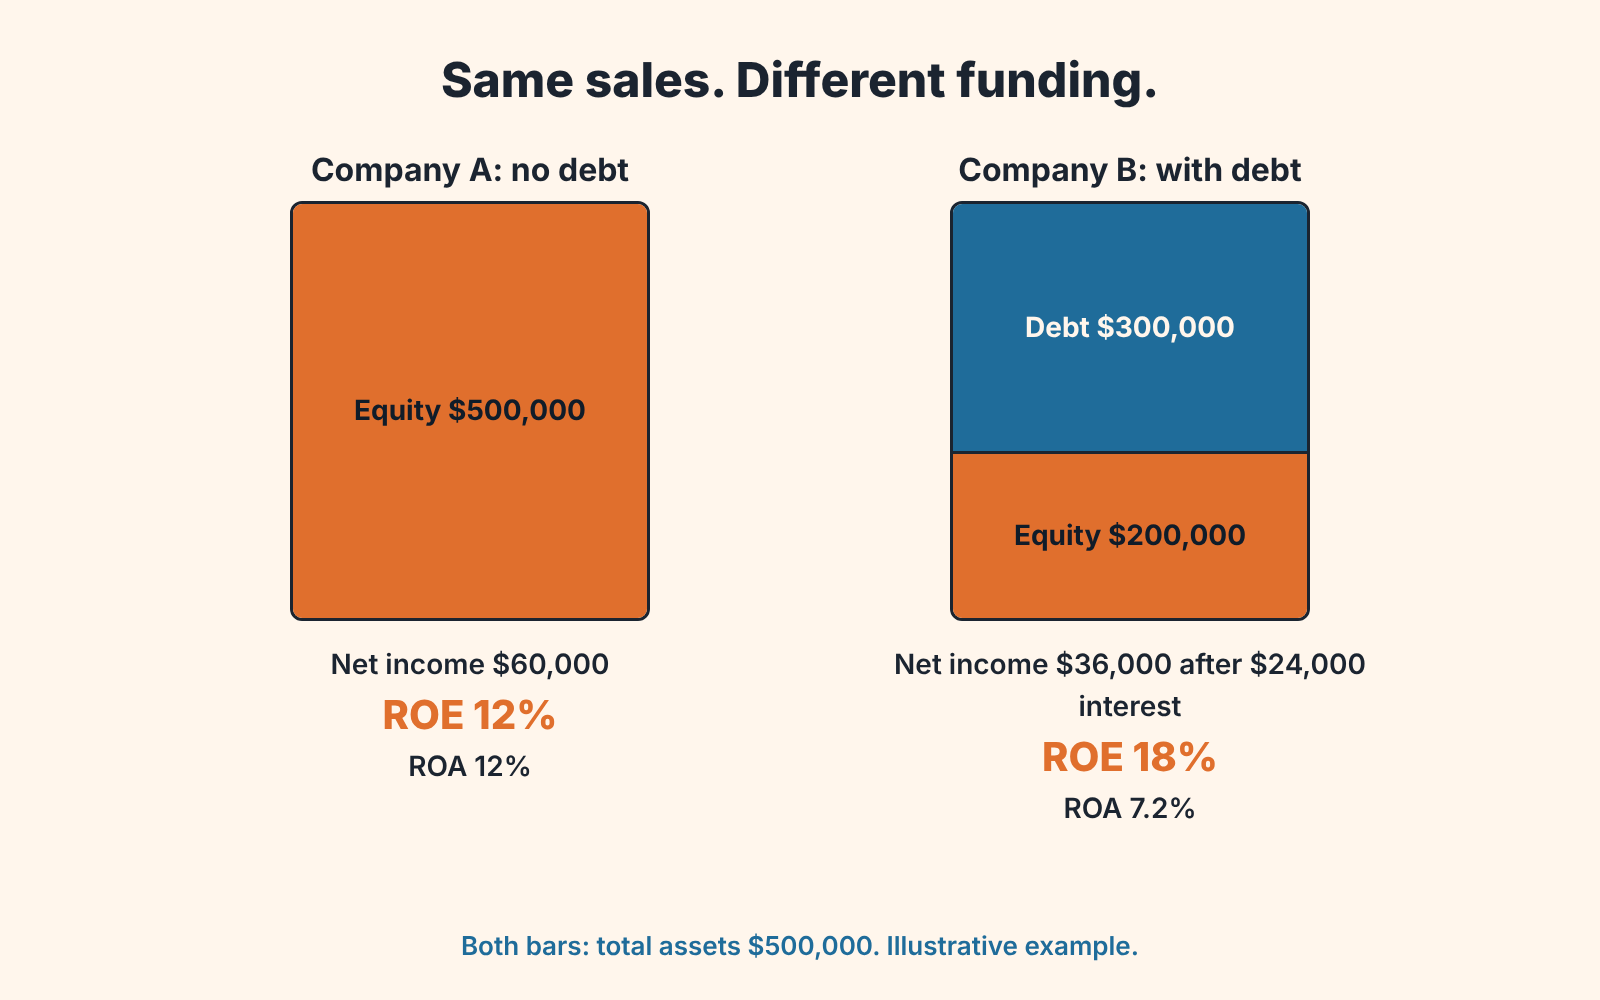
Say two companies are identical on the sales side. Same reps, same closed-won revenue, same costs, and the same $60,000 of profit before interest. Each runs on $500,000 of assets. Company A is funded entirely by its owners. Company B’s owners put in $200,000 and borrowed $300,000 at 8% (tax is left out to keep the arithmetic visible, and equity is held flat through the year so the average equals the year-end figure).
| Company A, no debt | Company B, with debt | |
|---|---|---|
| Total assets | $500,000 | $500,000 |
| Debt | $0 | $300,000 |
| Shareholders’ equity | $500,000 | $200,000 |
| Profit before interest | $60,000 | $60,000 |
| Interest at 8% | $0 | $24,000 |
| Net income | $60,000 | $36,000 |
| ROE (net income ÷ equity) | 12% | 18% |
| ROA (net income ÷ total assets) | 12% | 7.2% |
Company B earned less money and reports the higher ROE.
Its sales team did nothing better. The owners simply have less of their own money in the business, so a smaller profit gets divided by a much smaller base.
Now run a bad year through both. Profit before interest falls to $20,000. Company A’s ROE drops to 4% ($20,000 ÷ $500,000). Company B still owes its $24,000 of interest, ends the year with a $4,000 loss, and its ROE is −2%. The same loan that lifted the ratio in the good year turned the bad year into a loss.
ROE vs ROA: debt opens the gap
ROE divides net income by the owners’ equity and ROA divides the same net income by total assets, so the distance between the two ratios comes from the equity multiplier, which in a small company mostly means debt. Wikipedia’s description of DuPont analysis spells it out: ROE equals profit margin times asset turnover times the equity multiplier, and the equity multiplier (average total assets ÷ average total equity) shows how much of the business runs on borrowed money (Wikipedia: DuPont analysis). Margin times turnover is ROA, which leaves ROE = ROA × equity multiplier.
In the example Company B’s multiplier is $500,000 ÷ $200,000 = 2.5, and 7.2% × 2.5 = 18%. Company A’s multiplier is 1, which is why its ROE and ROA are the same number.
You can run this check on your own accounts in a minute. Divide ROE by ROA, and the result is how many dollars of assets the business runs on for each dollar of owners’ money. Loans push it up. So do supplier bills you haven’t paid and customer deposits you haven’t delivered against, because all of them are liabilities and every liability shrinks the equity share of the same asset total. To see where assets, liabilities and equity sit and how a sales team feeds each of them, read the balance sheet for a sales owner.
When a high ROE is a warning
What is a good ROE? Wikipedia’s article on return on equity (checked November 2026) gives the common benchmark that ROEs of 15–20% are generally considered good, citing Investopedia (Wikipedia). The usual advice then treats ROE as a score where higher is better. We don’t recommend steering a small, owner-run company by that band, because in a company like that the owner controls the denominator directly. Take profit out every year and equity stays thin. Pay yourself a low salary and net income looks bigger than the business really earns. Either choice raises ROE, and the sales team hasn’t closed one extra deal.
Put thin equity into numbers (illustrative again). A company runs on $500,000 of assets, carries $460,000 of liabilities and has $40,000 of equity left. It earns $30,000 of net income. ROE is 75% and ROA is 6%. That gives a multiplier of 12.5, so the owners fund 8 cents of every dollar the business uses.
CFI makes the same point from the investor’s side: a high ROE doesn’t fully show the risk associated with that return, since a company may rely heavily on debt to boost it, and too much debt brings high interest payments and an increased risk of default (CFI).
People mix ROE up with ROI alot. Return on investment is the ratio between the profit from an investment and what it cost (Wikipedia: Return on investment), so you’d use it for one decision, like a new hire or a trade show. ROE covers all the owners’ capital in the company at once.
When ROE looks impressive, ask:
- Is ROA also healthy, or is the multiplier doing the work?
- Did equity fall during the year (losses, large owner draws)?
- Would the business still show a profit after interest if sales dropped by a third?
And if equity is negative, stop. A loss divided by negative equity produces a positive percentage, and that number means nothing.
Which parts of ROE belong to the sales team
A head of sales who gets handed an ROE target should ask which part of it belongs to the team. Most of the numerator’s top half does, while equity and debt stay with the owner and the bank.
| Part of ROE | Does sales move it? | How |
|---|---|---|
| Revenue | Yes | Closed-won volume and deal size |
| Discounts | Yes | Every point given away comes straight off profit |
| Margin per deal | Yes | Product mix, services attached, what gets sold at list price |
| Payment terms | Partly | Long terms grow receivables, and receivables often get funded with a credit line |
| Overhead | No | Rent, admin salaries, software |
| Interest and debt | No | The owner and the bank decide this |
| Tax | No | Tax rules and the accountant |
| Equity | No | Owner contributions, draws and past retained profit |
The “partly” row deserves a second look. A rep who agrees to 90-day terms to close a deal has added to assets and, quite possibly, to borrowing. Revenue went up; ROA went down; ROE may have gone either way. If the difference between the top line and what’s left of it is still argued about in your meetings, revenue vs profit covers where each one lives.
ROE and retained earnings: the money you keep
Profit you leave in the business moves to the bottom of the formula. Retained earnings are reported in the shareholders’ equity section of the balance sheet (Wikipedia: Retained earnings), so every dollar you keep makes next year’s denominator bigger. We walk through that account in the retained earnings formula for a sales owner.
Go back to Company A. It earned $60,000 and the owners left all of it in, so equity at the end of the year is $560,000. If next year’s net income is $60,000 again, ROE on that closing equity slips to about 10.7%. Holding 12% takes $67,200 of net income, which is $7,200 more than last year. At an illustrative 10% net margin that’s roughly $72,000 of extra revenue.
Bring that number to the next sales planning meeting. Kept profit has to produce more profit, or ROE falls and the owners’ capital earns less each year, which turns retained earnings into a growth target for the team. The reverse reading matters too. Had Company A’s owners taken the whole $60,000 out, flat sales would have kept ROE at exactly 12%, and the the report would have looked fine while nothing was reinvested.
For the version that counts debt and equity together, see return on invested capital.
Should you keep the profit or take it out? That decision is yours. What ROE can tell you is whether last year’s retained money earned its place, and that’s a fair question to ask every December.
What the CRM can feed into ROE
ROE can’t be calculated from a CRM. Net income needs every cost in the business, and equity needs the balance sheet; both sit in the accounting system. What the CRM holds is the raw material for the top of the numerator: closed-won amounts by period, the discount on each deal, product or service mix, and (if your team fills it in) the expected payment date. That’s enough to see whether revenue and deal margin are heading up or down months before the accountant closes the year.
It only works if those fields are true. A pipeline with stale close dates and unrecorded discounts feeds a wrong revenue picture into every ratio built on top of it. The ROE calculation stays with your accountant, and SalesBond checks the deal data underneath it. The free CRM audit looks at the last 30 days of your connected CRM and sends a PDF report with money at risk, a CRM score and the top findings, then a second PDF seven days later showing what changed. Check your CRM with SalesBond.
A practical split for the next quarter: ask your accountant for three numbers (net income, average equity, total assets) and work out ROE and ROA yourself. Then pull closed-won revenue and average discount from the CRM for the same period. If ROE rose while revenue and discount stayed flat, where did the lift come from?


