
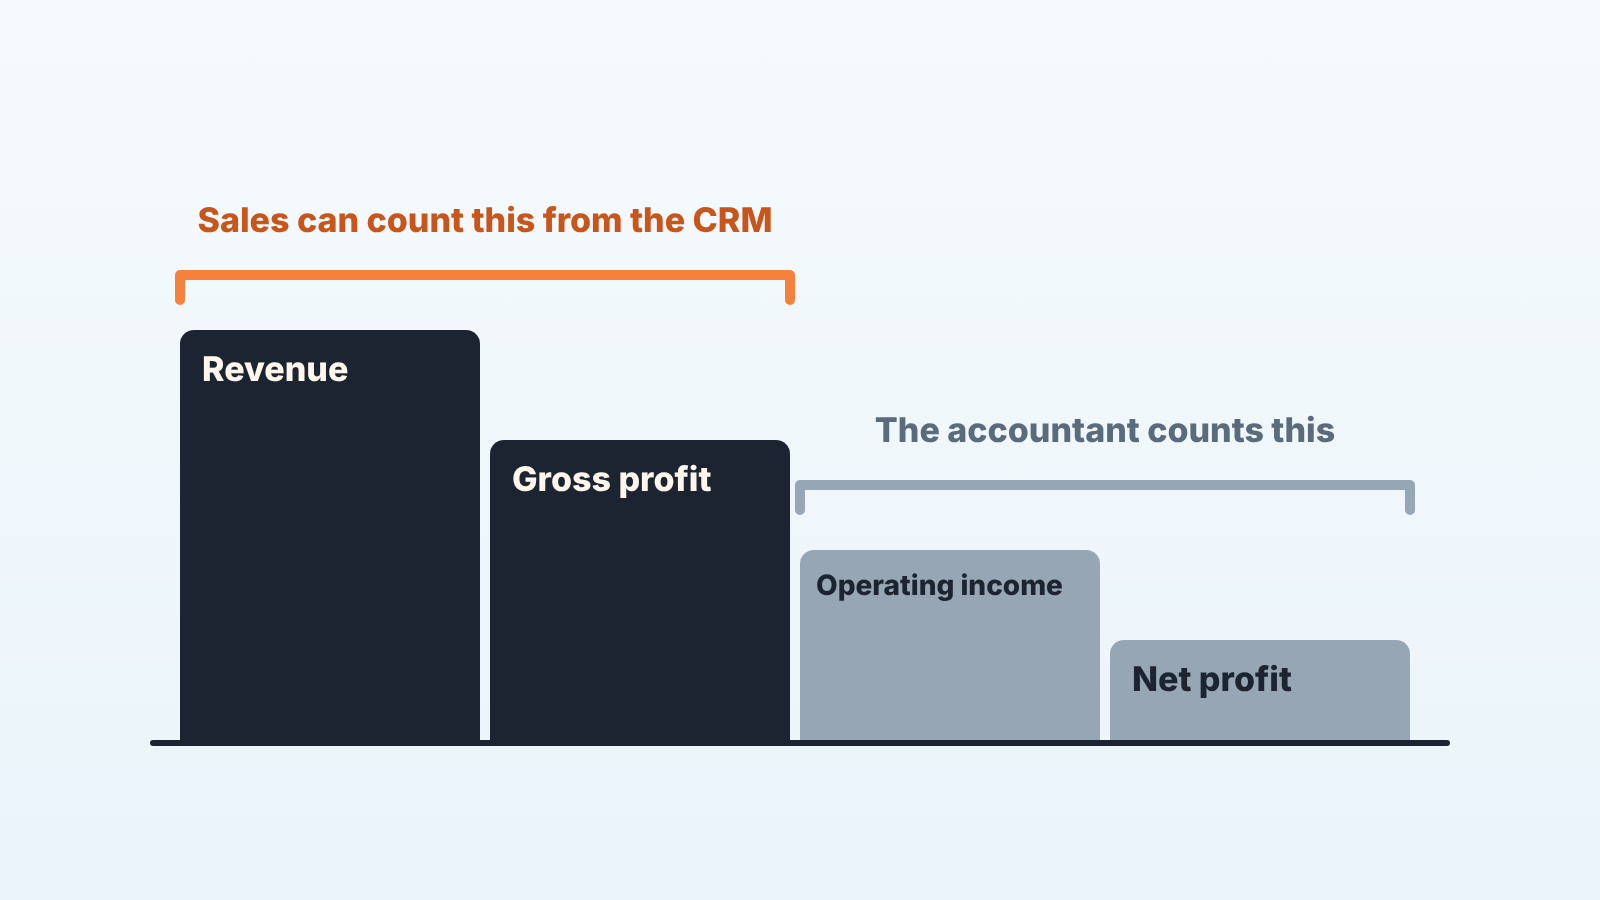
Gross profit is revenue minus the direct cost of what you sold; net profit is what remains after every other expense, interest and tax. Sales controls the top of that ladder: price, discounts and the deal mix decide gross profit long before the accountant calculates net profit. Read the first with your head of sales and the second with your accountant.
Gross profit vs net profit in one paragraph
Gross means before the deductions, net means after them. A company can sell well, post a healthy gross profit and still end the year in the red after rent, salaries and interest. The reverse doesn’t last: if gross profit is thin, no cost cutting below it saves the year.
The ladder: revenue, gross profit, operating income, net profit
Revenue is the top rung, the sum of the closed-won amounts. The two formulas people quote both start from it:
- Gross profit = revenue − cost of goods sold (or cost of delivery)
- Net profit = revenue − all expenses, interest and tax
Operating income sits between them: gross profit minus the cost of running the company, from rent and software to the cost of selling, commissions included. Take interest and tax off operating income and you have net profit, and what the owner does not pay out of it becomes retained earnings, which we trace back to closed-won.
Sales owns the first step almost completely, because the amount on a closed-won deal is revenue with the discount already inside it. Accountants call that discounted figure net sales, and it sits one line above gross profit, which is net sales minus the cost of goods sold. Sales shares the second step and touches the third only through commissions. If you want the whole statement line by line, the P&L for a sales owner walks it top to bottom.
Gross profit: revenue minus the cost of goods or of delivering the work
For a reseller, the cost of goods is what you paid the supplier for the units in that deal. For a services firm, it is the delivery hours at loaded cost, plus subcontractors. For software, it is hosting, third-party licences and support time. Most owners we talk to run one of the last two, and there the cost rarely sits next to the deal.
Our rule: if the cost disappears when the deal disappears, it belongs above gross profit. If it stays whether or not you win, it belongs below.
A rep who sells a project with 400 hours of delivery instead of 300 has moved gross profit by a hundred hours of loaded cost. No commission plan will show it unless cost sits on the deal record.
Gross margin is the same number divided by revenue. We cover it in the gross margin formula for a sales owner, so here we stay with dollars.
Net profit: what is left after everything else
Net profit, or net income, is the last line, and almost nothing between it and gross profit is the sales team’s to decide. A head of sales asked “why is net profit down?” is being asked the wrong question; “why is gross profit down?” is theirs. Net income for a sales owner takes that line apart and names the pieces sales does move.
What sales moves: discounts, mix of deals, commissions, cost of selling
Four things, in order of how fast they show up.
Discounts come first. The cost of delivery doesn’t shrink when the price does, so every discounted dollar comes straight out of gross profit: on a deal with a 40% gross margin, a 10% discount takes a quarter of the profit. Markup vs margin for discount approval does that arithmetic on one deal, and gross sales vs net sales shows which amount your CRM is actually storing.
Deal mix comes second. Ten deals at 50% gross margin and ten at 20% can produce the same revenue and very different gross profit. If the comp plan pays on revenue, reps are indifferent to mix, and the owner is the only person in the the building who cares which products the quarter was made of.
Commissions sit one step lower. Commission is a cost of selling, so it lands in operating expenses, not in cost of goods; it changes operating income and leaves gross profit alone. A rep can hit a gross profit target and still leave the owner worse off if the deal needed a bonus, a partner fee and a discount to close. Contribution margin per deal catches that, because it takes commission off the deal before you look at what is left.
The rest of the cost of selling (travel, demo licences, tools, a conference) is small per deal and is usually the first thing cut when net profit disappoints, whether or not it was the cause.
A worked month: ten closed-won deals from CRM to net profit
The numbers are illustrative and made up for this example. One team, one month, ten closed-won deals.
The ten deals were quoted at $100,000 at list price. Reps gave $8,000 in discounts, so revenue, the sum of the closed-won amounts, is $92,000. Delivering those deals costs $46,000, which leaves a gross profit of $46,000: a 50% gross margin. All of that can come out of a CRM export, provided a discount field and a cost field exist and are filled.
Next come commissions at 10% of revenue, $9,200, worked out from the same export and the comp plan, and $2,800 of other selling costs from expense reports. Rent, salaries, marketing and software take $24,000, which leaves $10,000 of operating income. Interest of $1,000 and tax at 25% of what remains bring net profit to $6,750, a bit over 7% of revenue. None of those last lines exists anywhere but the accounting system.
Now run the same month with two changes a sales team makes without noticing. The quarter end is close so discounts go from $8,000 to $12,000. Two of the ten deals were a lower-margin product line, so delivery costs $48,000 instead of $46,000. Revenue is $88,000, gross profit $40,000, commission on the lower revenue $8,800. Operating income drops to $4,400 and net profit, after the same interest and tax, to $2,550.
Revenue fell 4%. Net profit fell by more than 60%.
Nobody on the sales floor missed a target. The closed-won report would never show it.
Which CRM fields you need, and which lines the CRM never sees
Four fields on the deal get the top of the ladder out of the CRM. Fewer and you are guessing; add more than five and nobody fills them.
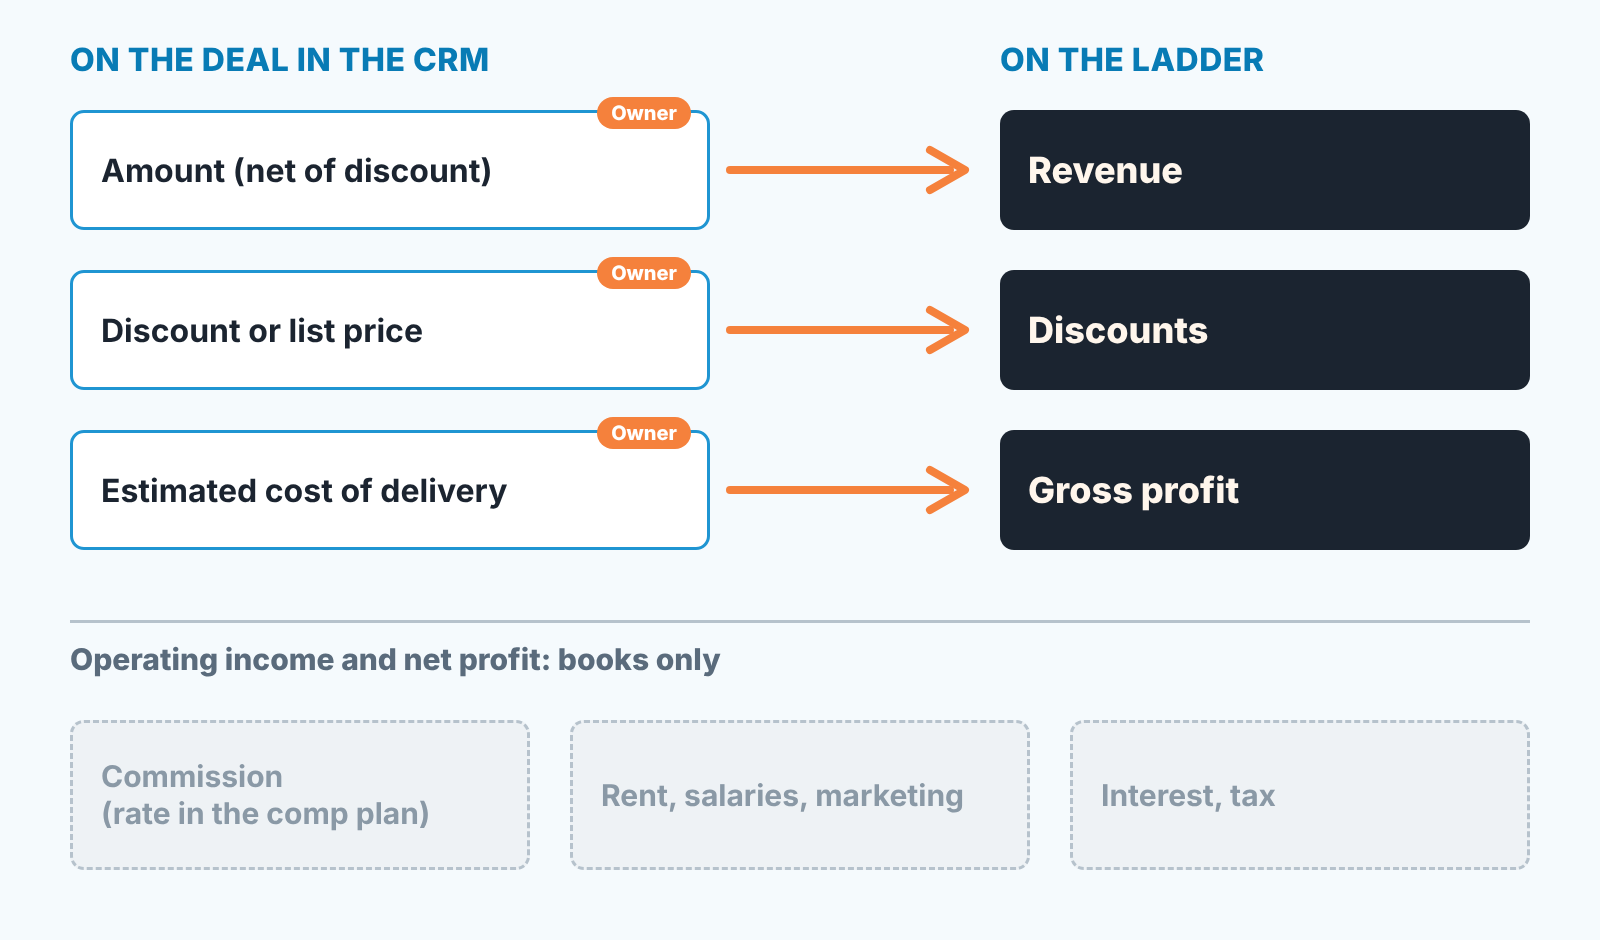
The deal amount, net of discount, is revenue, and every CRM has it: Value in Pipedrive, Amount in HubSpot, Salesforce and Zoho CRM. What you probably lack is the field next to it, a list price or a discount amount, so the $8,000 line exists at all. HubSpot carries Unit discount on line items (HubSpot: default line item properties); in Pipedrive, Salesforce and Zoho CRM a custom currency field on the deal does the job. Make it required at closed-won, not earlier, or reps will type zero to get past the form.
The cost of delivery turns revenue into gross profit, and CRMs handle it worst. HubSpot line items have a Unit cost; Pipedrive stores Cost and Direct cost on products but calls them for reference only (Pipedrive: products). In practice, the honest version is one “estimated cost” currency field on the deal, filled by the rep at proposal time and corrected by delivery afterwards. It will not match the books to the dollar, and it only has to be close enough to catch the deal sold at cost. On Pipedrive, one formula field puts the margin on the deal card.
The owner field is already there, and it turns a total into gross profit by rep.
Below gross profit, the CRM sees almost nothing: rent, overhead salaries, marketing, interest and tax have no field and need none. Commission is the one line in between. The CRM holds the inputs (who won what, for how much), the rate lives in the comp plan, and the accountant books the result.
Everything above rests on the deal amounts being right. A closed-won deal with no amount, or last quarter’s amount, breaks revenue and gross profit at once. We build SalesBond, a sales management layer on top of the CRM your team already uses. It doesn’t hold costs or calculate profit; it keeps the inputs honest. Deal Health flags deals with no amount, and the free CRM audit reads the last 30 days of your CRM and sends a PDF with money at risk, deal health and your top-10 clients, then a second PDF a week later showing what changed. Check your CRM with SalesBond before you build the ladder on top of it.
Mistakes we see: bookings read as profit, discounts that vanish
The most expensive one is reading the closed-won total as if it were profit. Its revenue at best, and before invoicing it is only a booking; revenue vs profit for an owner shows a quarter where closed-won grew and profit stayed flat.
Next is letting the discount disappear. If the rep types the discounted amount into the deal and the list price lives nowhere, the month’s discount total does not exist, and you cannot tell a soft market from a soft sales team.
Then there’s commission above the gross profit line. It feels like a cost of the deal, yet the books carry it as a cost of selling, and mixing it in hides the real question: does the comp plan pay for mix or only for volume?
Last, judging the sales team on net profit. They can’t see it and can’t move most of it. If you want a number in between, EBITDA for a sales owner shows which of its lines the team moves.
FAQ
Gross profit margin vs net profit margin: which one should I watch weekly?
Gross profit margin. It changes with every deal, and sales can act on it this week; net margin moves with costs decided once a year. The calculation is in the gross margin formula.
What is a good gross profit?
We don’t give a number, because it depends on what you sell: resale runs thin, services and software run wide. Compare with your own last twelve months, by product line and by rep. Three months of gross margin drifting down while revenue holds is the signal, whatever the absolute level.
Does this apply to a services business with no cost of goods?
Yes. Your cost of goods is delivery time at loaded cost; add an estimated-cost field to the deal and the worked month above works the same way. Start with your last ten closed-won deals: fill that field by hand and see which ones were sold close to cost.


