
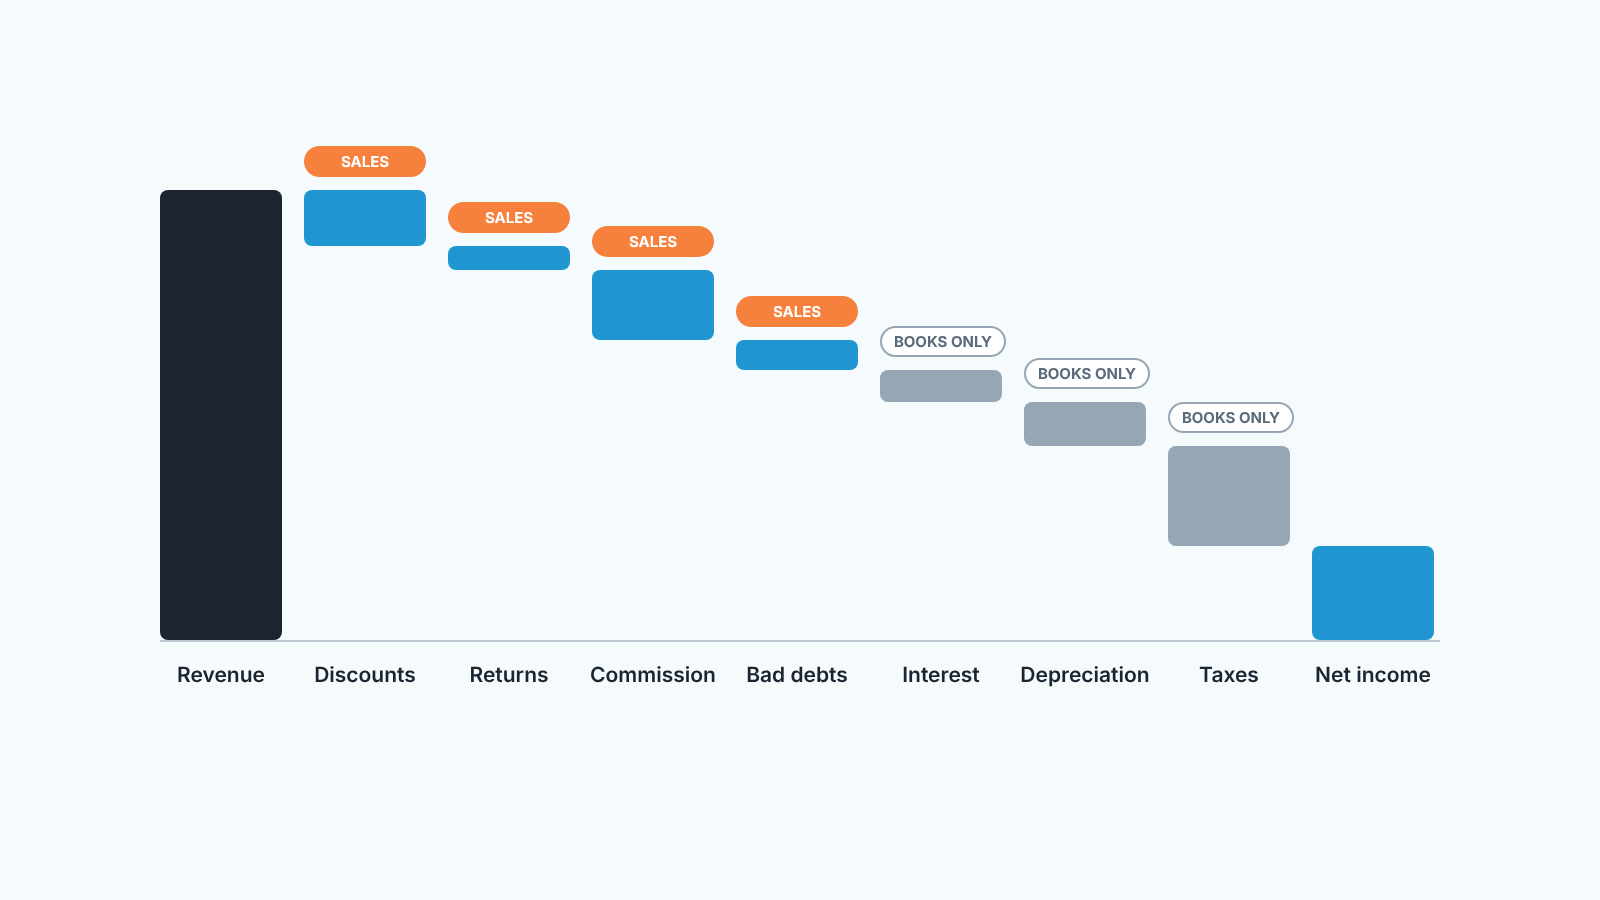
Net income is what remains of revenue after all expenses, interest and taxes in a period.
Net income = revenue − cost of goods sold − operating expenses − interest − taxes.
For a sales team, revenue here means net revenue (net sales): gross sales minus discounts, returns and credit notes. Net income divided by net revenue is the net profit margin. Whatever is left at the bottom also moves equity, the last term in the accounting equation for a sales owner.
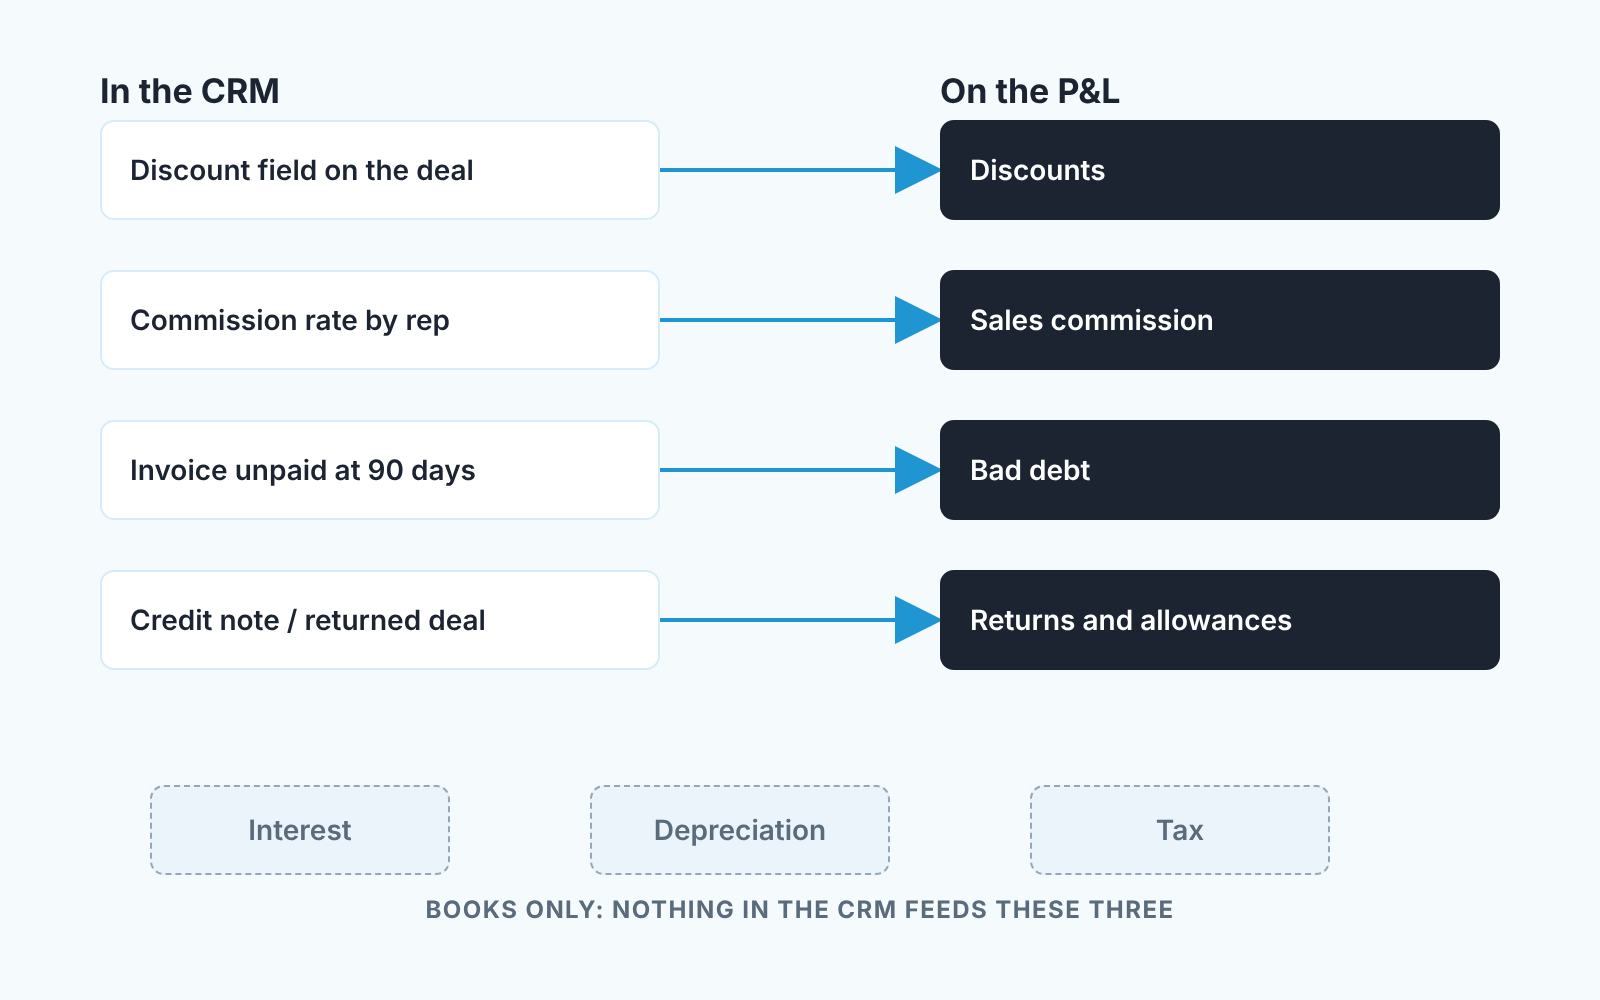
Your sales team moves four of those lines every week: discounts, commissions, bad debts and returns. The CRM records all four. Taxes, interest and depreciation it never sees.
Net income in one sentence (and net income vs net profit)
Net income is the last line of the income statement, the number people mean when they say “the bottom line” (Wise). Revenue for the period, minus every cost it took to earn it, minus interest on what you borrowed, minus tax. Operating income is the line just before interest and tax, and revenue is where the whole statement starts.
Is net income the same as profit? In everyday use, yes: net income and net profit are usually the same number. Sage notes that the two words are often swapped but draws a slight line between them (Sage), so if your accountant uses both in one meeting, ask which line each one points to. We say net income because that is what the report says at the bottom.
What an owner with a sales team actually needs is the lines between net revenue and net income, sorted into two piles: what sales can move, and what sales cannot touch. If you only need to tell the two profit numbers apart first, start with gross profit vs net profit.
How to calculate net income: one quarter, illustrative
Start from revenue, subtract the cost of what you sold, subtract operating expenses, then interest, then tax. What is left is net income. Here is that walk for an illustrative company over one quarter; every number is made up to show the mechanics. None of it comes from anyone’s books.
The team closed $600,000 of deals at list price. Discounts took $48,000 off that, or 8%, and returns and credit notes another $12,000, which leaves $540,000 of net revenue. Both of those deductions are sales decisions.
Cost of goods sold was $216,000, an operations number, so gross profit came to $324,000. Then the operating costs: $54,000 of sales commission (10% of net revenue in this plan), $9,000 of bad debt written off, $190,000 of everything else (salaries, rent, software, marketing) and $10,000 of depreciation. Operating income: $61,000. Commission and bad debt carry a sales tag. Depreciation carries none.
Below operating income sit $6,000 of interest and $13,750 of tax (25% of $55,000, a rate picked for the example). Net income for the quarter: $41,250.
So $540,000 of net revenue turns into $41,250. The order of the lines is the normal P&L order, which the P&L for a sales owner walks through one by one. The subtotal before interest and tax is operating income, with its own breakdown of what a sales team moves. Here we only care about whose hands are on which line.
Net profit margin (net income margin)
In the example, net profit margin is $41,250 / $540,000 = 7.6%. Carry that ratio into every sales conversation, because it converts any cost into the sales it takes to cover it. A $9,000 unpaid invoice, after tax at 25%, takes $6,750 off net income. At a 7.6% margin, replacing $6,750 needs close to $90,000 of new net revenue, a sixth of the quarter’s selling.
Four levers sales moves: discounts, commission, bad debts, returns
Sales moves net income through four lines: discounts, commission, bad debts and returns. They behave differently.
Discounts have the shortest path to the last line. In the example they run at 8% of gross sales. Move that to 9% and net revenue drops by $6,000. Commission on net revenue drops by $600, so pre-tax income falls by $5,400, and after tax at 25% net income falls by $4,050. One point of discount, about a tenth of the quarter’s net income. The per-deal arithmetic is in markup vs margin for discount approval; here we only need the period total.
Commission is a cost the sales plan creates on purpose. It moves net income through the rate and through what the rate is applied to. Pay on gross sales and the rep earns on the list price, discount or not; pay on net revenue and the discount costs the rep something too. Same plan, same reps, different last line. The worked plans are in the commission calculator article.
Bad debts are the lever owners forget belongs to sales. A deal is won, the invoice goes out, the customer never pays. Finance writes it off, and the deal is still closed-won in the CRM. But the choice of customer, the payment terms and the chasing of the invoice were sales decisions.
Returns and credit notes reduce net revenue after the deal was already counted. The usual causes: overselling, a proposal delivery could not keep, a customer pushed to sign before the quarter closed. The deal amount in the CRM rarely changes when a credit note goes out, so this lever stays invisible unless someone makes it visible. Gross sales vs net sales covers how to record it.
Now watch what a hard push for closed-won does to all four at once. Discounts deepen in the last two weeks. Commission rises with the bookings, faster than net revenue if it is paid on gross. A hesitating customer gets 60 days instead of 30, and some of those invoices turn into next quarter’s bad debt. A few of the pushed deals come back as credit notes. Closed-won goes up, net income goes down, and revenue vs profit for an owner works through exactly that case.
Where each lever lives in the CRM (and the one report to pull)
One export shows all four: closed-won deals for the period, with list price, final amount, rep, invoice status and a flag for returns or credit notes. One table, one quarter. Here is where the columns come from.
The discount lives in a discount field on the deal, or on its line items, with the list price kept next to it. If reps type the discounted amount as the deal value and the list price lives nowhere, the quarter’s discount total does not exist and the first lever is gone. Add the field, make it required on closed-won, and the export gives you discounts by rep and by month.
Commission lives wherever the rate is stored: a field on the rep’s user record, the comp plan, a spreadsheet next to the export. The CRM holds the inputs (who won what, at what amount, in which period), usually not the rate. Keeping the rate outside the CRM is fine. Calculate on the same closed-won export the accountant will see, though, or the two commission numbers will disagree at quarter end.
Bad debt lives in the invoice status, and that is often the weakest link. If invoicing happens in the accounting system and the CRM never hears back, unpaid deals look identical to paid ones. The minimum fix is a field on the deal (paid, unpaid, overdue at 30, 60 or 90 days) updated from the accounting system once a week. Dull, yes. It is also the only way the rep who sold to a non-payer sees it in thier own pipeline.
Returns live in a credit-note flag or a negative deal, depending on the CRM. What matters is that the credit note is linked to the original deal and rep, so the the quarter’s returns can be grouped the same way as its wins.
Pull that export and you have the sales side of the formula, the half of net income your team can do something about on Monday. SalesBond’s free CRM audit looks at the last 30 days of the connected CRM and sends a PDF report with money at risk, top-10 clients and what to fix, then a second PDF a week later with what changed.
What the CRM cannot show: taxes, interest, depreciation
A CRM cannot show taxes, interest or depreciation, and no configuration brings them in.
Tax depends on the legal entity, the jurisdiction, what was deductible and what the accountant did with last year’s losses; the 25% in the example is a placeholder. Interest comes from the loan agreement and the overdraft, and no deal changes it. Depreciation is the accountant spreading the cost of equipment or software over its useful life, a non-cash line that lowers net income without anyone writing a check this quarter.
Cost of goods sold sits in the same blind spot: the CRM knows what was sold and nothing about what it cost to deliver. The gross margin formula for a sales owner shows how to put COGS next to CRM revenue.
We think the right posture is to stop asking the CRM for net income altogether. Ask it for the four levers with their period totals, and ask the accountant for the rest. A CRM dashboard that shows a “profit” number is usually closed-won minus commission, and an owner who reads it as net income is off by every line in the books-only pile.
A quarterly check with the accountant: five questions
Once a quarter put the CRM export and the accountant’s P&L on the same table. These are the five questions we ask, in this order.
- Does net revenue on the P&L match the export? If not, run the reconciliation from the P&L article before you discuss anything else.
- What was written off as bad debt this quarter, and which deals were they? Take the list back to the CRM and tag the deals, so the rep sees it and so does whoever approved the payment terms.
- Is commission in COGS or in operating expenses, and was it calculated on gross or net? The answer changes gross profit and what a discount costs the rep. It should match the comp plan word for word.
- What is the net profit margin for the quarter, and how far is it from last quarter? Write the new ratio on the sales plan. It sets the price of every discount and every unpaid invoice for the next three months, and a margin that fell from 7.6% to 6% means the same $6,750 loss now needs over $110,000 of sales to cover.
- Which lines below operating income moved, and why? Interest, depreciation and tax sit outside sales and land on the owner.
Your next step is small: book the hour with your accountant for the week after quarter close, and send the four-lever export a day before.


