
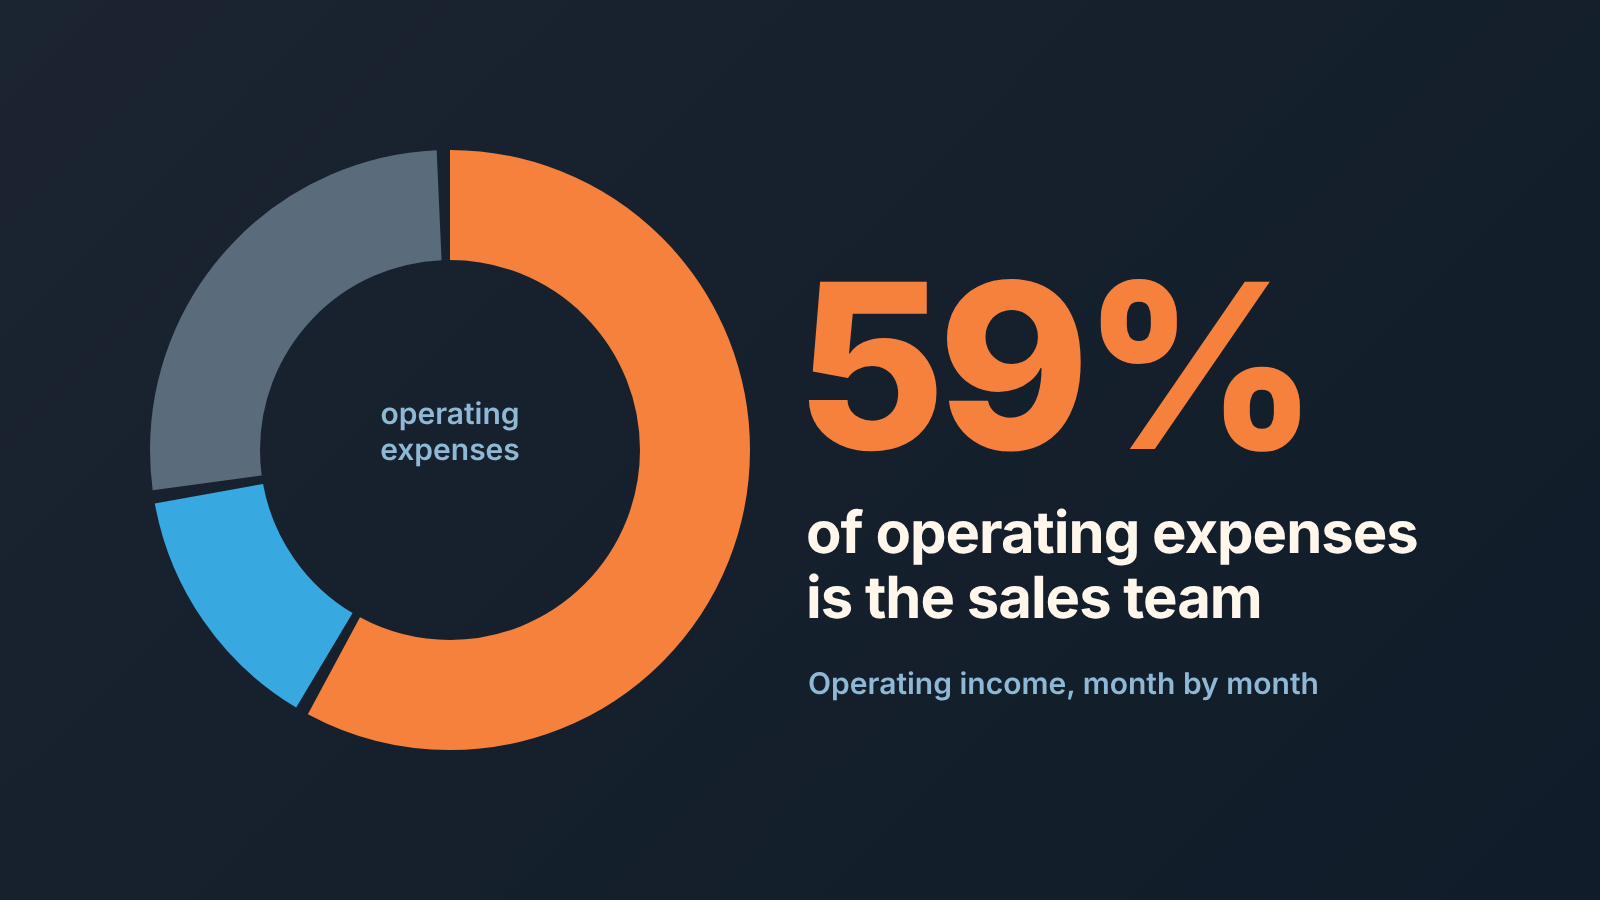
Operating income is what a business earns from its core operations: revenue minus the cost of goods and minus operating expenses such as salaries, commissions, rent and software, before interest and taxes. The sales team shapes both ends of it: the revenue that comes in and a large share of the expenses that go out. If you run a company where five people sell and twenty deliver, the sales team is probably the single biggest line in your operating expenses, and the one line the owner looks at least.
On the whole P&L table it sits between EBITDA, which adds depreciation and amortization back, and net income, which is what remains after interest and taxes.
Operating income in one paragraph
Operating income is the profit from running the business, counted before the bank and the tax office take their share. Take a month. Add up the revenue you actually earned in it, net of discounts. Subtract what it cost to deliver that revenue: materials, delivery labor, hosting, whatever your cost of goods is. What is left is gross profit. Now subtract everything you spent to run the company that month: salaries, commissions, rent, software, marketing, travel, insurance. What is left is operating income. Interest on the loan and the tax bill come after it and are not part of it (CFI: Operating Income). An owner should watch this line as closely as the last one, because it shows whether the business works as a machine. A bad month of net income can come from a tax adjustment or a loan. A bad month of operating income means selling, delivering and running the place cost more than the place earned.
Operating income formula: revenue, COGS, operating expenses
The textbook form is three subtractions in a row:
Operating income = Revenue − Cost of goods sold − Operating expenses
CFI gives two other routes to the same number (CFI). One starts from gross profit and subtracts operating expenses, depreciation and amortization. The other starts at the bottom of the statement: net earnings plus interest expense plus taxes. That is how an analyst rebuilds the figure from a finished P&L, and a handy cross-check at year end.
We start from gross profit in this article, because it is the number a sales owner already tracks. The worked month below has no depreciation line. If your company owns vans, machines or capitalized software, subtract their depreciation and amortization as well.
Two words in the formula do the damage. “Revenue” is what you earned and delivered, which can differ from what the CRM marked closed-won on the 30th. And “operating expenses” includes the sales team in full: base salary, commission, CRM seats, the dialer, the conference tickets. People picture rent and the office manager when they hear the term. For a sales-led company the picture should be the sales floor.
Operating income, operating profit, operating margin: one number, three names
Operating income and operating profit are the same number, and CFI also calls it EBIT, earnings before interest and taxes (CFI). What operating income leaves out is non-operating income: interest the company earns on its cash, a one-off gain on selling a van.
Operating margin is that number as a percentage of revenue:
Operating margin = Operating income ÷ Revenue
We prefer the margin for comparing months, because a 20% drop in operating income means something different in a month where revenue also dropped 20% and in a month where revenue grew. The margin shows whether the business got better at turning revenue into profit, and return on assets takes a year of that profit further, against everything the business owns.
One term looks related and isn’t. Net operating income, or NOI, comes from commercial real estate: CFI describes it as a profitability metric used only for income-producing commercial property (CFI: NOI). It has nothing to do with the operating income of a services or product company.
Operating income vs gross profit vs net income
Gross profit sits above operating income: revenue minus the cost of delivering it, before a single salary on the sales floor is counted (the gross margin formula article covers which costs belong there). Net income sits below it: operating income minus interest and taxes, which the net income article walks through for a sales owner.
The sales team barely touches the gap between operating income and net income, and that is the reason to look at this line at all: it isolates the part of the result that selling and running the company can change. The whole ladder, step by step, is in gross profit vs net profit.
What the sales team puts into operating expenses
Here is where most owner-level finance articles fall short. CFI’s list of selling and administrative costs runs from office rent and utilities to insurance, marketing and travel, and it is a fair list (CFI). But in a company that sells through people, the sales team is a bigger line than rent, spread across half a dozen accounts so nobody sees the total.
Pull it together once. Base salaries for reps, the sales manager and the SDRs. Commissions and bonuses actually paid in the month, leaving out anything accrued on the forecast. Payroll taxes and benefits on all of that. Software the team uses: CRM seats, dialer, data enrichment, proposal software. Travel, meals, the booth at the trade show. Recruiting fees for the rep you replaced in March. If marketing exists mostly to feed the sales team leads, we would count it in the same bucket, at least for this exercise.
Add those up and divide by gross profit for the month. That ratio is the cost of selling as a share of what selling earned, and it is the most useful number this article can give an owner. The sales efficiency article builds the same idea from the other direction, closed-won per dollar of sales cost, and commission structures covers why the commission line behaves differently from salary: it moves with revenue, the salary does not.
Our position: an owner who cannot say what the sales team cost last month, in one number, cannot read the operating income line. The revenue side gets reviewed every Monday. The cost side gets reviewed when teh accountant sends the year-end pack. That asymmetry is where most “we sold more and earned less” months come from.
A worked month: from closed-won revenue to operating income
The numbers below are illustrative, a small services company with five reps and a manager, invented to show the shape. The order of the subtractions is the same for any company.
- Revenue delivered in the month, net of discounts: $400,000
- Cost of delivery (COGS): −$240,000
- Gross profit: $160,000 (40% gross margin)
- Sales base salaries, five reps and a manager: −$42,000
- Commissions at 8% of net revenue: −$32,000
- Sales software and data: −$3,000
- Travel and events: −$5,000
- Marketing: −$20,000
- Admin, finance, rent, insurance, utilities: −$38,000
- Operating income: $20,000 (5% operating margin)
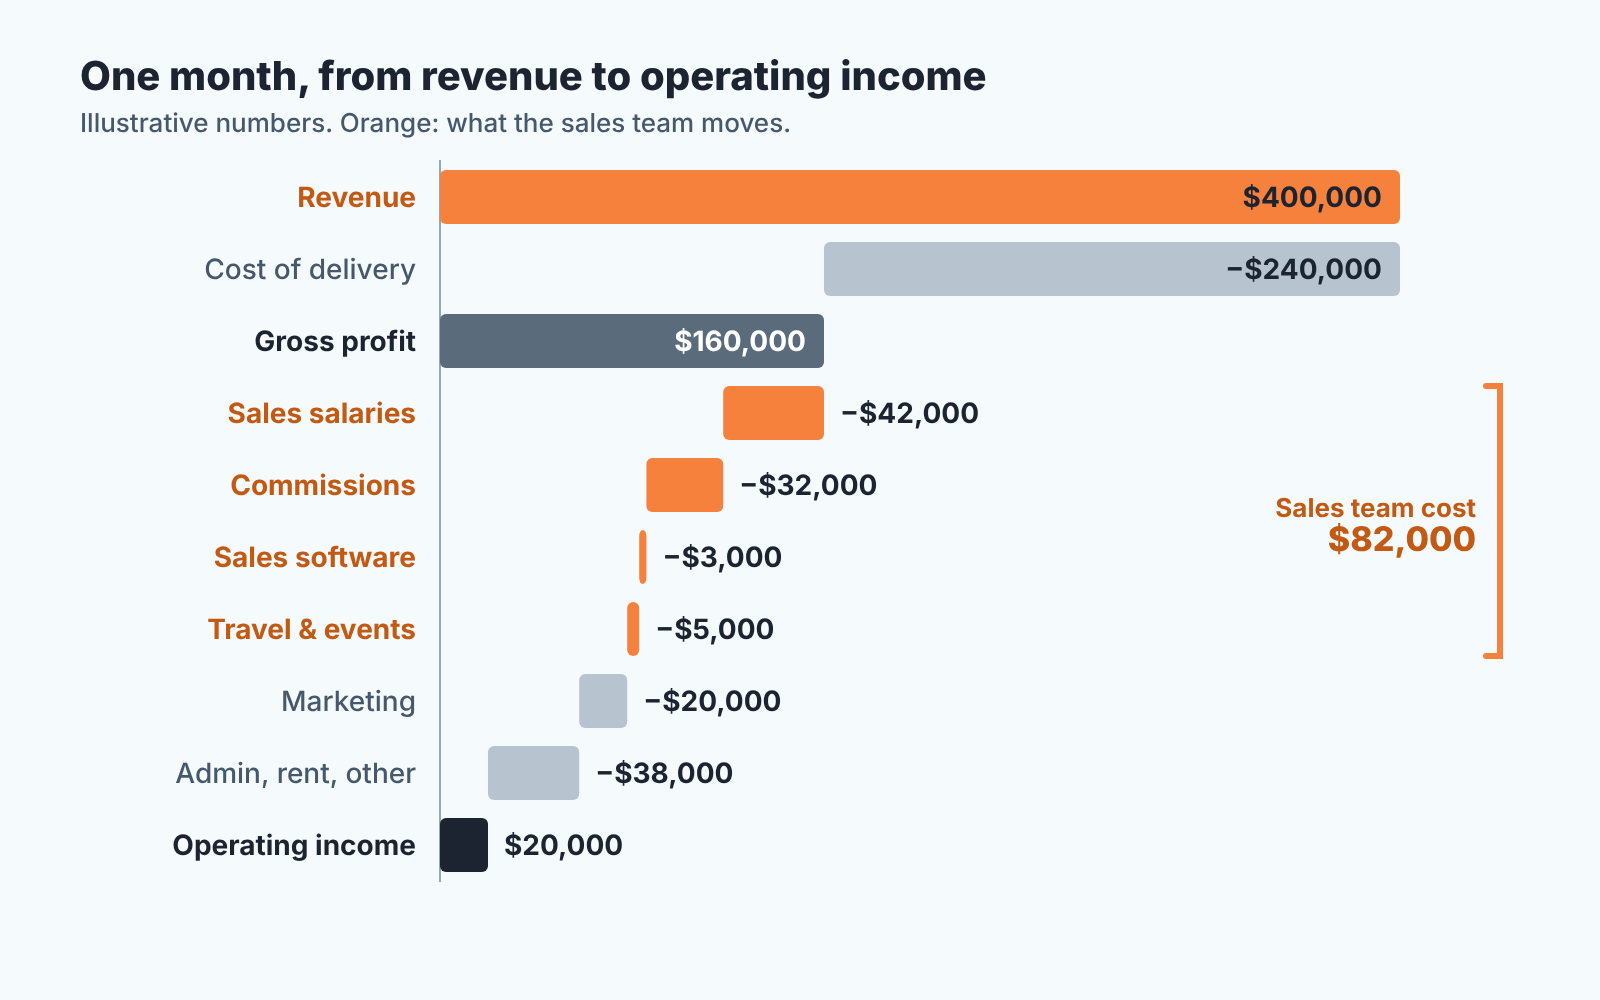
Who moves what? The sales team moves revenue through price and volume, and it owns four cost lines outright: salaries, commissions, software, travel. Delivery owns the cost of goods. Marketing owns its budget, and the last line belongs to everyone else.
Per deal, the amount left after variable costs and discount is the contribution margin.
Read the list twice. First reading: the company earned $20,000 on $400,000 of revenue, a 5% operating margin. Second reading: the sales team’s own cost is $82,000, which is 59% of all operating expenses and about half of gross profit. Add marketing and it is $102,000. In this company, the question “why is operating income only $20,000” is a question about the sales floor before it is a question about rent.
How that percentage is worked out is covered in the operating margin formula guide.
Now the question the finance textbooks never ask: how much revenue does this company need for operating income to be zero? Commissions move with revenue, so split operating expenses into the fixed part ($140,000 minus $32,000 of commission, so $108,000) and the part that scales. Every dollar of revenue brings 40 cents of gross profit and costs 8 cents of commission, so 32 cents reaches the operating line. $108,000 divided by 0.32 is $337,500. Below that revenue, the month is an operating loss. Above it, each extra dollar adds 32 cents of operating income.
Do that calculation for your own numbers this week. We have seen owners surprised by how close break-even revenue sits to a normal month. To aim at a target profit instead of zero, cost-volume-profit analysis runs the same arithmetic.
Which numbers come from the CRM and which from accounting
The revenue side of operating income starts in the CRM and ends in accounting. Closed-won deals by month, by rep, with their amounts and close dates, come out of any CRM in one report. What the CRM does not know is when the revenue is earned: a twelve-month contract closed in March is March revenue in the pipeline report and one-twelfth of it in the March P&L. So the CRM gives you the starting list and accounting gives you the recognized figure. If the two are never reconciled, the operating income you compute from CRM numbers is still a forecast. The revenue vs profit article shows where each of these numbers lives.
The cost side does not live in the CRM at all. Salaries, commissions paid, software invoices, travel claims: payroll and the accounting system hold them. The only cost-shaped data a CRM reliably carries is discount per deal, and only if the team stores both list price and final price on the deal. If they store only the final amount, the discount is invisible everywhere, which is one reason we keep telling teams to add the field.
So the honest split: the CRM shows what the team sold and who sold it; accounting shows what it cost and what was actually earned. Operating income needs both, and neither system computes it for you.
We build SalesBond, a sales management layer on top of the CRM a team already uses, and it stays on the CRM side of that line. The Sales Dashboard shows plan, forecast and per-rep execution. The free CRM audit reads the last 30 days of the connected CRM and sends a PDF report on managers, deal health and money at risk, then a second PDF a week later showing what changed. SalesBond does not see salaries or invoices, and it does not calculate profit. For the revenue half of the formula it saves the Monday export; the cost half stays with your accountant. Check your CRM with SalesBond if that revenue half is the part your team keeps rebuilding by hand.
When operating income falls: price, volume or the cost of selling
A falling operating income has three usual suspects, and the CRM can tell you which one before the accountant can.
Price first. If revenue held but gross profit shrank, the team gave more discount. Check the average gap between list and final price on won deals this month against the last three months. A discount comes off revenue in full, and the only cost that shrinks with it is the commission on the discounted amount. In the worked month, a dollar of discount takes 92 cents off operating income, while a dollar of extra volume adds 32 cents.
Volume second. If the number of won deals dropped and the sales cost stayed where it was, operating income falls even at the same margin. Count won deals per rep per month in the CRM. The salary line does not shrink with the deal count, so the ratio of sales cost to gross profit goes up.
Cost of selling third, and the one owners see last because its not in the CRM. Two new reps on payroll since February with no closed deals until May. A commission plan paid on list price while the team sells at 10% off. A new tool with twelve seats where four are used. None of these show in a pipeline report. All of them show in the operating income line, three weeks after the month closes, as a number that is smaller than expected with no explanation attached.
We would look at them in that order, every month, in the week after close. Price and volume are answered from the CRM in ten minutes. Cost of selling needs the payroll report next to the CRM export, and the CAC payback article shows how long a new rep’s cost takes to come back through gross margin, which is the question behind every hiring decision on a sales floor.
FAQ
What is a good operating margin?
We are not going to give you a benchmark number, because there is no sourced figure that applies across industries, and a margin that is healthy for a software company is a disaster for a distributor. Two comparisons that are always valid: your own margin over the last twelve months, and the break-even revenue from the worked month above. If this month’s revenue sits within a few percent of break-even, the margin is thin whatever the industry average says.
Is operating income the same as EBITDA (and what is AOI)?
No. EBITDA is operating income with depreciation and amortization added back (CFI: EBITDA margin), so it is the bigger number whenever the company has assets to depreciate. AOI, adjusted operating income, is something else: a non-GAAP figure from which the company removes items it considers non-operational or non-recurring, and each company decides which items those are (AT&T’s definition in an SEC filing is a typical example). If someone hands you an AOI figure, ask what was adjusted and why.
Can operating income be negative?
Yes, and then it is called an operating loss. A company can run an operating loss for a planned period, for example while it hires the sales team ahead of revenue. It becomes a problem when it is not planned. The first check is the break-even calculation above: if the month’s revenue is below the revenue needed for zero operating income, decide whether that is a volume problem, a price problem or a cost-of-selling problem before anyone proposes a fix.
Do I want operating income to be high or low?
High, with one caveat. An operating income that is high because the sales team was cut to two people looks good for a quarter, then revenue follows the headcount down. Read it next to the number of won deals and the open pipeline. If both shrink while operating income rises, the rise came from cuts, and the revenue those cuts will cost has not shown up yet.


