
Operating margin is the share of revenue a company keeps after paying its cost of goods sold and its operating expenses, before interest and taxes: operating income ÷ revenue × 100%. The same ratio goes by operating profit margin and return on sales, and many finance sites use EBIT margin for it too. Take 15%. That leaves 15 cents of every sales dollar once delivery, payroll, commissions, marketing and rent are paid, and the sales team moves that figure from two sides (the price it sells at, and what the selling itself costs).
How operating income is built line by line is covered in our article on operating income for a sales owner, so that calculation is skipped here. Here it’s the percentage that gets the attention. Where does it sit next to gross and net margin, and what does a sales floor do to it?
Operating margin in one formula
Operating margin = Operating income ÷ Revenue × 100%
CFI writes the formula as operating income divided by revenue and notes that the ratio is also known as return on sales (CFI: Operating Margin). BDC’s glossary reaches the same figure from the top of the statement: net sales minus cost of goods sold and SG&A, divided by net sales, multiplied by 100% (BDC: Operating profit margin).
Say a company (an invented example) earned $1,000,000 in a year and its operating income was $150,000. Its operating margin is 15%.
Notice BDC’s word “net”. The revenue in this formula is what customers were actually invoiced, after discounts. That matters for a sales owner because a discount shrinks the top and the bottom of the fraction by the same dollar amount, and the bottom is much smaller, so the percentage falls fast. Take $50,000 of extra discount off the company above with its costs unchanged. Revenue becomes $950,000, operating income $100,000, and the margin drops from 15% to 10.5%.
To calculate operating margin, open last quarter’s P&L, find the operating income line (some reports call it operating profit or EBIT), divide it by the revenue line, then repeat for the quarter before. Did the percentage move by more than a point?
Operating margin vs gross margin vs net margin
Which one should a head of sales watch? Operating margin. It’s the fairest scorecard of the three, because it contains everything the sales floor influences (price, discounts, commissions, the cost of winning a customer) and almost nothing it doesn’t. Gross margin stops before a single salary is counted, and net margin adds the loan and the tax bill, which belong to the owner and the accountant.
The example column uses an invented company with $1,000,000 of revenue; the interest and tax figures are made up to show the arithmetic.
| Margin | Formula | What has been subtracted from revenue | Who moves it most | Example |
|---|---|---|---|---|
| Gross margin | Gross profit ÷ revenue | Cost of goods sold | Pricing, discounts, delivery cost | $600,000 ÷ $1,000,000 = 60% |
| Operating margin | Operating income ÷ revenue | COGS plus operating expenses (payroll, commissions, marketing, rent, software) | Sales, marketing, management | $150,000 ÷ $1,000,000 = 15% |
| Net margin | Net income ÷ revenue | Everything above, plus interest and taxes | Financing and tax decisions | $105,000 ÷ $1,000,000 = 10.5% |
BDC makes the same split in plain words: the operating profit margin “shows if you’re making money after you’ve paid the rent and utilities, marketing and sales staff and administration costs”, while the net profit margin sums up management’s ability to run the business in a single figure (BDC).
Read the gaps between the rows. The 45 points between 60% and 15% are the cost of running the company, and in a business that sells through people a large part of that gap is the sales team. The 4.5 points between operating and net margin belong to the loan and the tax bill, which no rep can change. If you need the first row in detail the gross margin formula article covers which costs belong in COGS.
What sits between gross profit and operating income for a sales team
Open that same P&L and look at the the lines between gross profit and operating income. Commission, sales salaries, the CRM seats, the lead budget: how many of those lines trace back to the sales floor in your report?
Commission is the obvious one, and it behaves differently from every other line in the block because it moves with sales. If the plan pays 10% of the deal, ten points of margin are spent before anyone else is paid. Base salaries for reps and thier manager come next. They stay the same whether the quarter was good or bad, which is why a slow quarter hurts the percentage twice: less revenue arrives, and the same payroll is divided into it.
Then marketing. Whatever the company spends to produce leads sits in operating expenses too, and together with sales payroll it’s the cost of acquiring a customer. A team that needs more touches, more demos and more paid leads per won deal lowers operating margin even when its win rate and its prices look fine. Our piece on what a deal really costs to win and serve breaks that cost down per deal.
Discounts are the odd one out. They never appear as an expense line, so nobody’s budget shows them. A discount is revenue that was never invoiced, so it lowers the margin from above, through a smaller revenue figure and a thinner gross profit. Nobody signs off on it the way someone signs off on a marketing budget (an approval rule for discounts is set out in our piece on markup vs margin), and yet in many P&Ls it would be one of the largest “costs” if it were printed as one. How large is it in yours?
Worked example: same revenue, different discounts and commissions
Two invented teams, both finishing the year with exactly $1,000,000 of revenue. All figures below are an example built for this article.
Team A sells at list price (a simplification, to keep the arithmetic clean). Team B gives 20% off on average, so to invoice the same $1,000,000 it had to sell and deliver $1,250,000 worth of product at list. Delivery costs 40% of list value in both companies. Both pay reps 10% commission calculated on list price, and both carry $350,000 of other operating expenses: sales salaries, marketing, admin and rent.
| Line | Team A | Team B |
|---|---|---|
| Value sold at list price | $1,000,000 | $1,250,000 |
| Discounts | $0 | −$250,000 |
| Revenue | $1,000,000 | $1,000,000 |
| Cost of goods sold (40% of list value) | −$400,000 | −$500,000 |
| Gross profit | $600,000 | $500,000 |
| Gross margin | 60% | 50% |
| Commission (10% of list value) | −$100,000 | −$125,000 |
| Other operating expenses | −$350,000 | −$350,000 |
| Operating income | $150,000 | $25,000 |
| Operating margin | 15% | 2.5% |
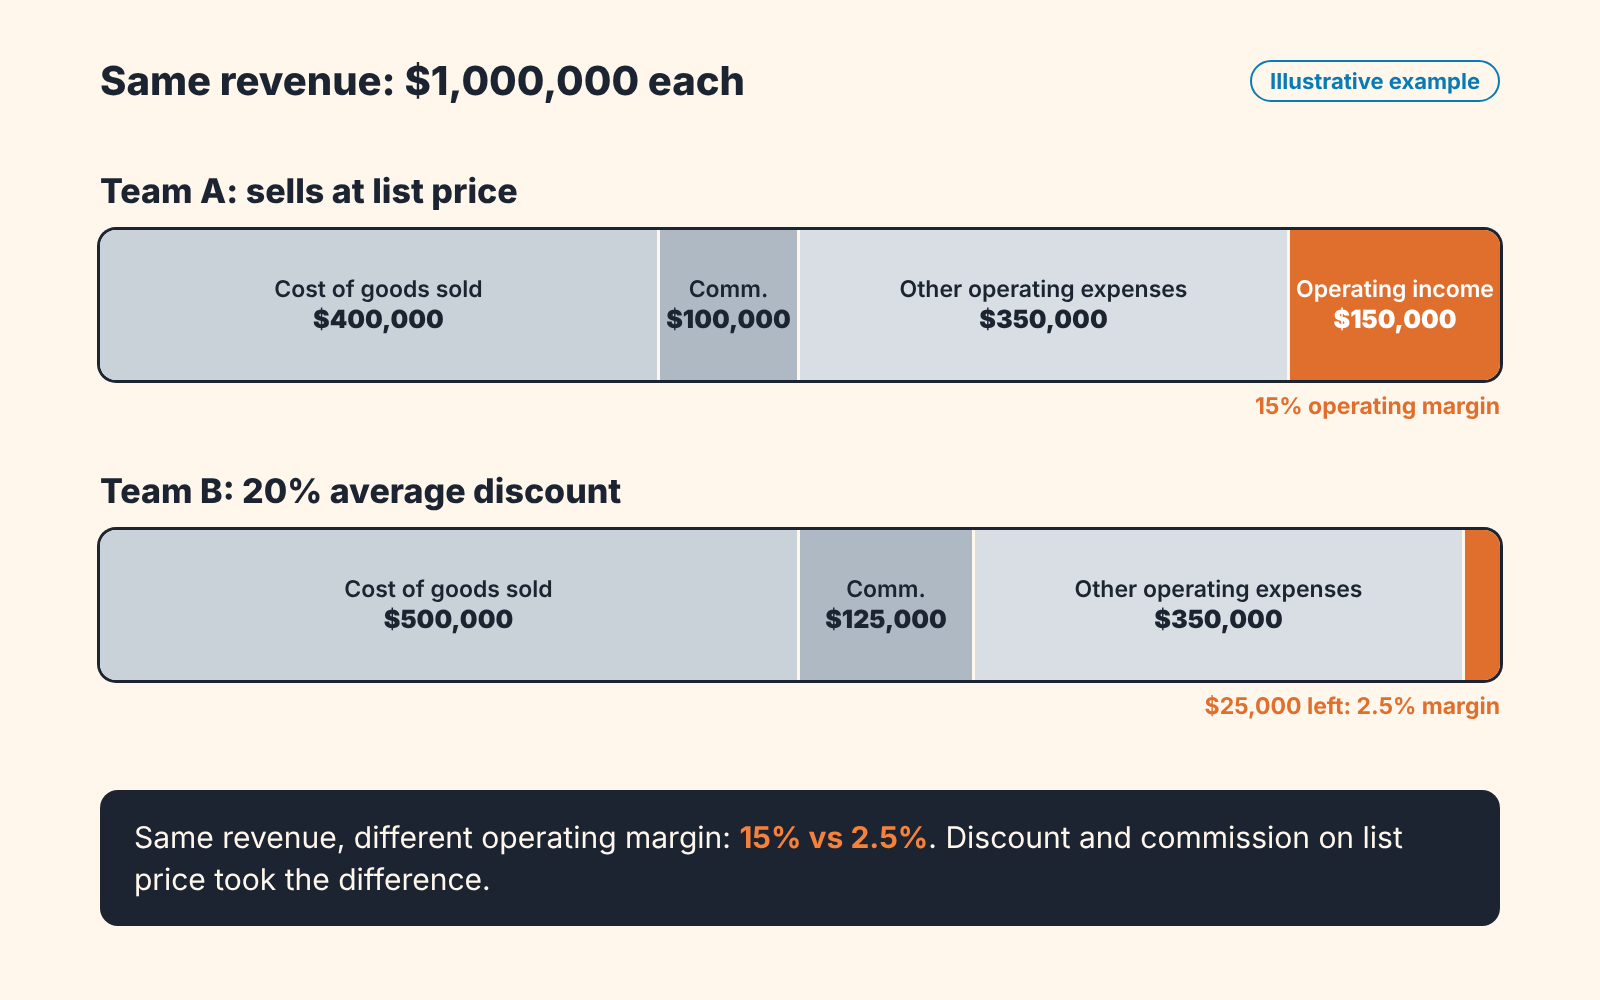
The revenue line is identical, and a dashboard that shows only revenue would rate these two teams as equals. Team B keeps 2.5 cents of each sales dollar against Team A’s 15.
Where did 12.5 points go? Ten of them went to delivery. Team B shipped a quarter more product to collect the same money, so it’s cost of goods sold is $100,000 higher. The other 2.5 points went to commission, because the plan pays on list price and Team B’s reps earned $125,000 on revenue of $1,000,000.
Two decisions follow from the table. Paying commission on invoiced revenue would cut Team B’s commission from $125,000 to $100,000 and lift its operating margin to 5%. And if Team B had sold the same volume with no discount, its operating income would have been $275,000, so the $250,000 of discount came off operating income dollar for dollar.
Where the inputs live: CRM (revenue, discounts, owner) vs accounting (opex)
Suppose you want Team B’s table for your own company next Monday. Half of it comes out of the CRM. The other half doesn’t exist there, however many custom fields (or dashboards) you add, because nobody enters payroll or rent on a deal.
The CRM holds the sales side, deal by deal: amount, close date, deal owner, product or line items. It holds the discount only if the team records it. In practice that means two fields on the deal, list value and final value, or a discount field on each line item. With only a final amount stored, you can’t tell Team A from Team B, and the first row of the table above is blank. So the first job is a field. Add it and make it required at the closed-won stage. Three months later you’ll have discount by rep and by product.
Accounting holds the rest. Recognized revenue (a twelve-month contract closed in March is one month of revenue in March), cost of goods sold, payroll, commissions actually paid, marketing invoices and rent all live in the ledger. Our revenue vs profit article maps each of these numbers to its system. Operating margin itself is computed in neither place unless someone puts the two exports side by side.
We build SalesBond, a sales management layer on top of the CRM a team already uses, and it works on the CRM half of this split. Its free CRM audit reads the last 30 days of the connected CRM and sends a PDF report covering money at risk, deal health, managers and what to fix, followed a week later by a second PDF showing what changed. SalesBond doesn’t see payroll or invoices and doesn’t calculate profit, so the operating expense lines stay with your accountant. If the CRM half is the part you can’t trust yet, check your CRM with SalesBond.
Tracking operating margin by quarter, and what a drop usually means
One reading of the percentage says little. CFI’s own caution is that comparisons should be made against similar companies in the same industry, because “a 20% operating margin means something very different for a software company than it does for a grocery chain” (CFI). We’d go a step further for a small company: compare against your own last four quarters first. An industry average blends business models, sizes and commission plans you’ll never see, while your previous quarters share your prices and your cost structure. Is 20% good, then? That depends on the business model; on your own chart, a margin that holds or rises while revenue grows is the sign to look for.
Here is the pattern worth catching, as an example. Revenue grows from $230,000 in Q2 to $270,000 in Q3, about 17%, and the team celebrates. Operating margin slides from 14% to 9%, which means operating income fell from $32,200 to $24,300. The company sold $40,000 more and earned $7,900 less.
The usual advice at this point is “keep growing revenue and the margin will follow”, on the logic that fixed costs get spread over more sales. We disagree with it as a default. It holds only when the extra revenue arrives at the old price and the old cost of selling. Revenue bought with deeper discounts brings its full delivery cost and its full commission along, as Team B shows, and each new dollar can carry a lower margin than the average of the dollars before it. Growth of that kind pulls the percentage down every quarter it continues.
When it does drop, look at gross margin first. If gross margin fell too, the discount field above will show how much of the fall is price; if it held, selling costs grew faster than sales, and the full check (including the case where revenue simply fell) is in the operating income article under when operating income falls.
Put the percentage on the agenda once a quarter, in the week the books close, with gross margin beside it.
FAQ
Is operating margin the same as return on sales?
Yes. CFI lists return on sales as another name for operating margin (CFI), and BDC calls the same ratio operating profit margin.
Is operating margin EBIT or EBITDA?
It sits on the EBIT side. Operating income is counted after depreciation and amortization (CFI’s worked example deducts both before it reaches operating income), while EBITDA adds them back, so an EBITDA margin is never lower. EBIT can drift from operating income when a company has non-operating gains or losses, and the EBITDA article covers that neighbouring figure, the one lenders and buyers tend to ask for.
Can operating margin be higher than gross margin?
No. Operating income is gross profit with operating expenses taken off, so the operating percentage always sits at or below the gross one. If your report shows the opposite, a cost has been booked on the wrong line.
Can operating margin be negative?
It can. When operating expenses exceed gross profit, operating income is a loss and the margin goes below zero. In the worked example, Team B would get there with a few more points of discount: at 22% off the same list volume, its revenue would be $975,000 and its operating income zero.


