
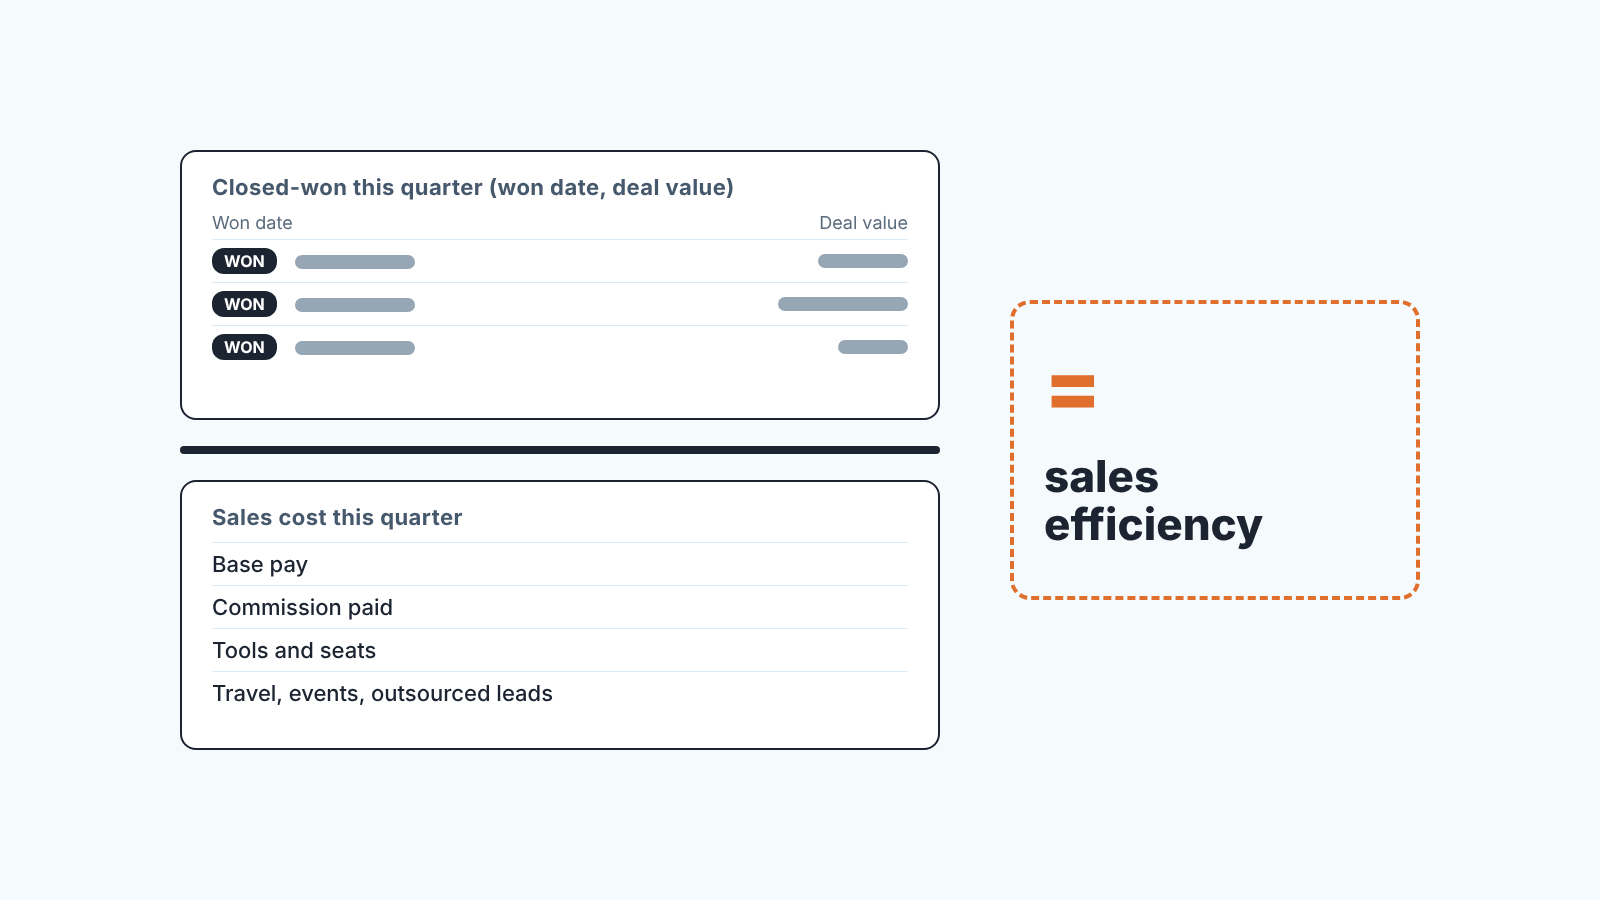
Sales efficiency is how much closed-won revenue your sales spend produces. Divide closed-won revenue for a quarter by the sales cost for that same quarter (pay, commission, tools, the other things you pay only because you have a sales team), and read the ratio as dollars back per dollar spent. A result of 1.0 means each dollar of sales cost brought back one dollar of new revenue in the quarter. For a team of five, the work is in deciding what counts as sales cost and in pulling closed-won revenue from the CRM without counting a deal twice.
The sales efficiency formula we actually run, once a quarter
Sales efficiency = closed-won revenue in the quarter ÷ sales cost in the quarter.
Revenue is closed-won deal value. ARR and cash collected stay out. A small team selling services or equipment has no ARR line, and the owner already knows what “won” means in thier CRM.
Cost is sales cost only. Marketing stays out of this ratio, which is where it differs from most published formulas, Pipedrive’s and Scale VP’s included. Marketing spend belongs in the cost of acquiring a customer, and we keep it there (see the LTV to CAC ratio from CRM data). This one is the return on the people who sell, and which of their costs rise with each deal and which sit there regardless is covered in fixed vs variable costs.
Same quarter for both sides. The SaaS versions divide this quarter’s new revenue by last quarter’s spend, because spend takes a while to turn into contracts (Pipedrive, Wall Street Prep). We’d start a small team on the same quarter: it’s a number you can defend without explaining a lag. If your sales cycle runs longer than a quarter, use a trailing two quarters and say so.
The cost side for a five-person team
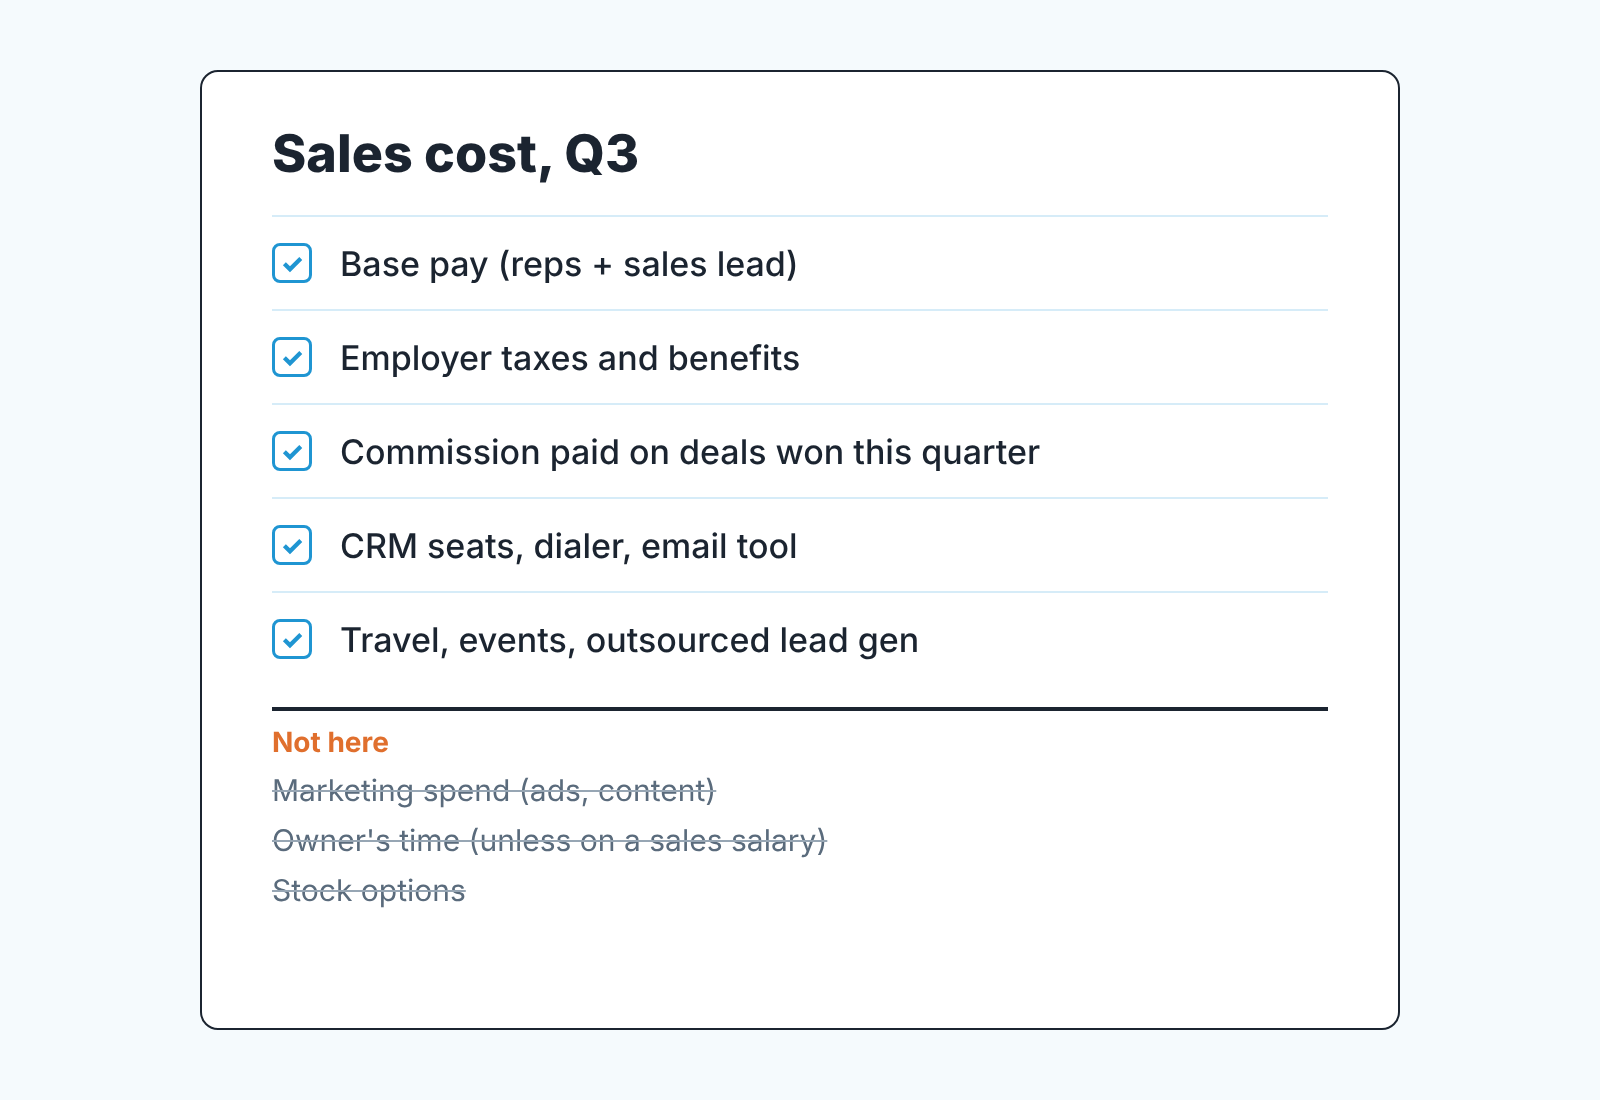
Everything on this list exists only because there’s a sales team.
Base pay of the reps and the sales lead for the three months goes in, plus the employer load on top: payroll taxes, health, pension, whatever your finance person calls “fully loaded”. Stock options stay out; Scale VP prefers to exclude stock-based compensation as a non-cash expense, and we follow that.
Commission goes in by won date. Count commission earned on deals won inside the quarter, not what payroll paid out this quarter for last quarter’s wins (the mechanics are in our sales commission calculator with worked examples).
Tools count when only sales uses them (CRM seats, dialer, email sequencing), and so does direct spend the reps caused: travel, a trade show they worked, an outsourced appointment setter. Ads and content are marketing.
People who split their week are the awkward part. If an account manager also runs onboarding, count the share of their cost that matches their time selling. Half the week, half the cost. The owner’s time stays out unless the owner draws a sales salary.
Training is a judgment call; Salesforce lists it next to “salaries, expenses” (Salesforce). We count it when it was a paid line, and skip it when it was the sales lead’s afternoon.
Whatever you decide write the list down and don’t change it between quarters, or the ratio will move every time the definition does.
The revenue side: pull it from the CRM without double-counting
The query is short: deals in the Won stage, won date inside the quarter, sum of deal value. The problems are in the data.
Use the won date. A deal created in June and won in August is Q3 revenue. If the system stamps the won date when a rep marks the deal won, this is reliable; if someone backdates, it isn’t. More on which date fields to trust: sales performance metrics and the CRM fields behind them.
One deal per contract. Renewals re-entered as new deals, or a deal split into “deposit” and “balance”, show up as two wins. Count the contract once and keep the split in a custom field if you need it.
Value in one unit. If one rep types the annual amount and another the monthly, the sum is fiction. Pick one and check teh outliers by hand.
And nothing from the open pipeline. Weighted pipeline, verbal yeses and “will sign Monday” belong to the forecast.
One quarter of deals, worked through
The numbers are made up to show the mechanics. Four reps, one sales lead, Q3. Cost, from payroll and tool invoices:
- base pay, four reps at $5,000 a month: $60,000
- base pay, sales lead: $24,000
- employer load at 20%: $16,800
- commission on deals won in Q3: $16,100
- CRM seats, dialer and email tool for five people: $2,000
- travel, one trade show, outsourced lead gen: $5,000
That’s $123,900. Revenue from the CRM: 23 deals won in Q3, each contract counted once, $161,000.
Sales efficiency for Q3: 161,000 / 123,900 = 1.3. Each dollar spent on selling brought back $1.30 of closed-won revenue in the quarter.
Two different things are called sales efficiency
Two families of definitions use the term. The first is for SaaS companies with investors. Scale Venture Partners defines sales efficiency as “the amount of new revenue generated for every dollar invested in selling and promoting”, divides by the whole Sales & Marketing line, and puts the long-term median for growth-stage SaaS at about 0.7; above 1 is rare (Scale VP).
The second family is about reps working faster. Salesforce’s page says sales efficiency “tracks how quickly your business can generate revenue during a specified period of time” (Salesforce).
Neither answers the owner of a five-person team: what does sales give back for what it costs me?
It also isn’t sales productivity. Productivity counts what a rep does with the hours; efficiency counts what the team returns for what it costs. If the hours are your question, that’s sales rep productivity from CRM data.
What a good sales efficiency ratio looks like (and why the SaaS lines don’t transfer)
For a small team, there is no external benchmark worth copying. Compare against your own last two quarters, computed with the same cost list.
The published lines exist. Pipedrive says a ratio under 1 means “you’re spending more on the sales process than you’re getting back in revenue”, around 1 is break-even, 1 to 3 is a positive return, and “only exceptional companies generate a sales efficiency of over 3” (Pipedrive). Default draws the same line at 1 (Default). Those lines were drawn for revenue over sales and marketing. Leave marketing out and the same company reads higher, so the thresholds don’t carry over.
So is 1.3 good? The first quarter you run this, you get a baseline to judge later quarters by. Margin matters too, because a 1.3 on 30% margin and a 1.3 on 70% margin are different businesses, and that is the payback question in CAC payback period for a small sales team.
When the number drops: numerator or denominator?
The ratio fell from 1.6 to 1.3. Before anyone says “the team got worse”, open both sides. You can’t improve sales efficiency until you know which side moved.
Denominator first because it’s quicker. Did cost go up? A new hire in month one of a quarter adds a full quarter of pay and, in most teams, close to nothing in wins. A commission catch-up for a big Q2 deal paid in Q3 belongs in Q2 by our rule, so check it landed there. If cost explains the drop, the fix is patience, and a pipeline review can wait.
Then the numerator, by rep. Split closed-won by deal owner and put each rep’s own cost next to it. Revenue per rep alone ignores cost, which is the gap between this ratio and revenue per employee vs revenue per sales rep. The same illustrative quarter:
| Rep | Closed-won, Q3 | Rep cost (pay, load, commission, seat) | Ratio |
|---|---|---|---|
| A | $58,000 | $24,200 | 2.4 |
| B | $47,000 | $23,100 | 2.0 |
| C | $41,000 | $22,500 | 1.8 |
| D | $15,000 | $19,900 | 0.8 |
The sales lead’s $29,200 and the $5,000 of shared spend stay with the team ratio. The split shows that the the team number hides one rep below 1 and three well above it. Whether D is ramping or the wrong hire needs a look at their own history; how many ramped reps you really have is in sales capacity planning for a small team.
A disclosure, since we are at the per-rep split: we build SalesBond, a sales management layer on top of the CRM a team already uses; we started with Pipedrive. Its Sales Dashboard has a Team Performance tab with per-rep execution, and that’s where we look first when this ratio moves. It doesn’t know your payroll, so the denominator is still yours to type in. If you want the revenue side checked against your own CRM, Check your CRM with SalesBond.
Last check: fewer deals, or smaller ones? Both come from the same won-deal list. Fewer deals points at pipeline and activity; smaller deals at discounting or a mix shift. Then you have the sentence for Monday: “Efficiency went from 1.6 to 1.3. Base cost is flat. Closed-won fell $35,000, all of it in D’s deals, same count, smaller deals.”
Where the SaaS magic number fits, and where it does not
The magic number is this ratio’s cousin for public SaaS companies: (GAAP revenue this quarter minus GAAP revenue last quarter) times 4, divided by sales and marketing spend in the previous quarter. Wall Street Prep reads it as below 0.75 inefficient, 0.75 to 1 moderately efficient, above 1.0 very efficient; at exactly 1.0, a quarter’s S&M spend is paid back by the incremental revenue of the next four quarters (Wall Street Prep). Scale VP, which developed it, calls it “a GAAP-based version of Net Sales Efficiency” (Scale VP).
It fits if you sell subscriptions and someone outside the company wants to compare you with other SaaS businesses. It doesn’t fit project or product sales, or the question “what did my five people return this quarter”.
If you do one thing this week, take last quarter, write your cost list down and run the division. Then run the quarter before it with the same list and compare the two.


