
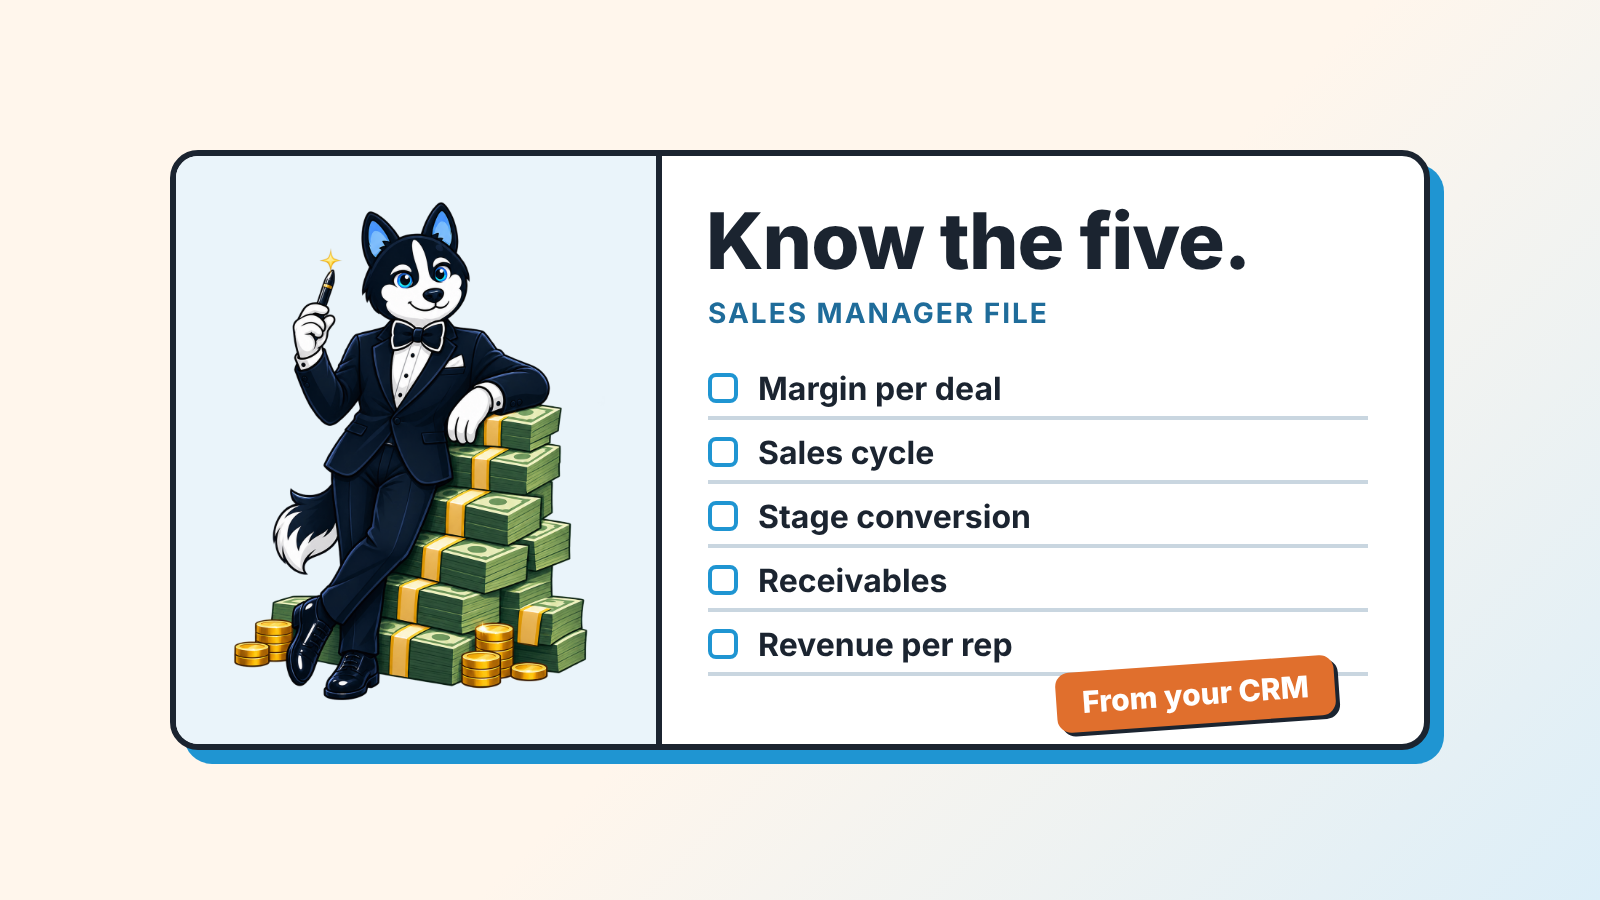
Business acumen is the ability to understand how a company makes money and to make decisions with that in mind. For a sales manager it comes down to five numbers (deal margin, sales cycle, stage conversion, receivables, revenue per rep) that you read from the CRM yourself. Can you quote all five for last quarter without asking finance? Then you have the working version.
Business acumen in one discount decision
Take one deal. A rep asks you to approve 10% off a $15,000 project so it closes this month. Yes or no?
Most managers answer from the pipeline. The quarter is short and the buyer is warm, so yes. A manager with business acumen answers from the margin. In the example below the project costs $9,600 to deliver, which leaves $5,400 of gross profit at full price. At $13,500 the profit is $3,900. A 10% discount took away 28% of what the company earns on that deal, and the team now needs 38% more deals of that size to bring in the same gross profit.
People often call this financial literacy. Opening a margin report and understanding it is financial literacy. Business acumen starts after that, when you decide which discount to refuse and which deal gets your Friday afternoon. A manager can read that report perfectly and still approve every discount request that lands on the desk.
Same deal, same CRM record. The second manager looked at one more field. If revenue, gross profit and net profit still blur together for you, gross profit vs net profit sorts them out in about ten minutes.
Five numbers you should be able to quote
Say a five-rep team sells installation projects to small businesses. Everything in the table is an illustrative example for one quarter (90 days); swap in your own figures.
| Number | How it’s counted | Example quarter |
|---|---|---|
| Gross margin per deal | (deal value minus direct cost) / deal value | ($15,000 − $9,600) / $15,000 = 36% |
| Sales cycle | average days from deal created to won | 48 days |
| Stage conversion | deals that reached the next stage / deals that entered this one | 200 qualified, 120 proposals (60%), 60 negotiations (50%), 40 won (67%) |
| Receivables | invoiced and unpaid; days sales outstanding = receivables / credit sales × days in period | $240,000 unpaid on $600,000 revenue: 36 days, with $66,000 past the 30-day terms |
| Revenue per rep | won revenue / number of reps | $600,000 / 5 = $120,000, or $43,200 of gross profit each |
Two of these have textbook definitions you can check. Wikipedia’s article on gross margin defines it as revenue minus cost of goods sold, divided by revenue; in a project business the direct cost of delivery stands in for cost of goods sold. The Corporate Finance Institute’s guide to days sales outstanding gives DSO as accounts receivable divided by net credit sales, multiplied by the days in the period. Every sale in the example is invoiced, so revenue and credit sales are the same figure.
Read the five together and a picture forms. A deal takes 48 days to win, and receivables equal another 36 days of sales, so cash from a typical deal arrives close to three months after the first qualified conversation. Half the deals stop between proposal and negotiation, which makes it the weakest step in the funnel. Each rep brings $43,200 of gross profit a quarter, and that figure has to cover the rep’s salary, commission, tools and a share of your own pay (the math for that is in the article on sales efficiency for a small team).
Which of the five would you get wrong today? For most sales managers it’s the fourth. Receivables live in the accounting system. Commission gets paid at closed-won, so once a deal is marked won nobody in sales opens the invoice again.
Where each lives in CRM
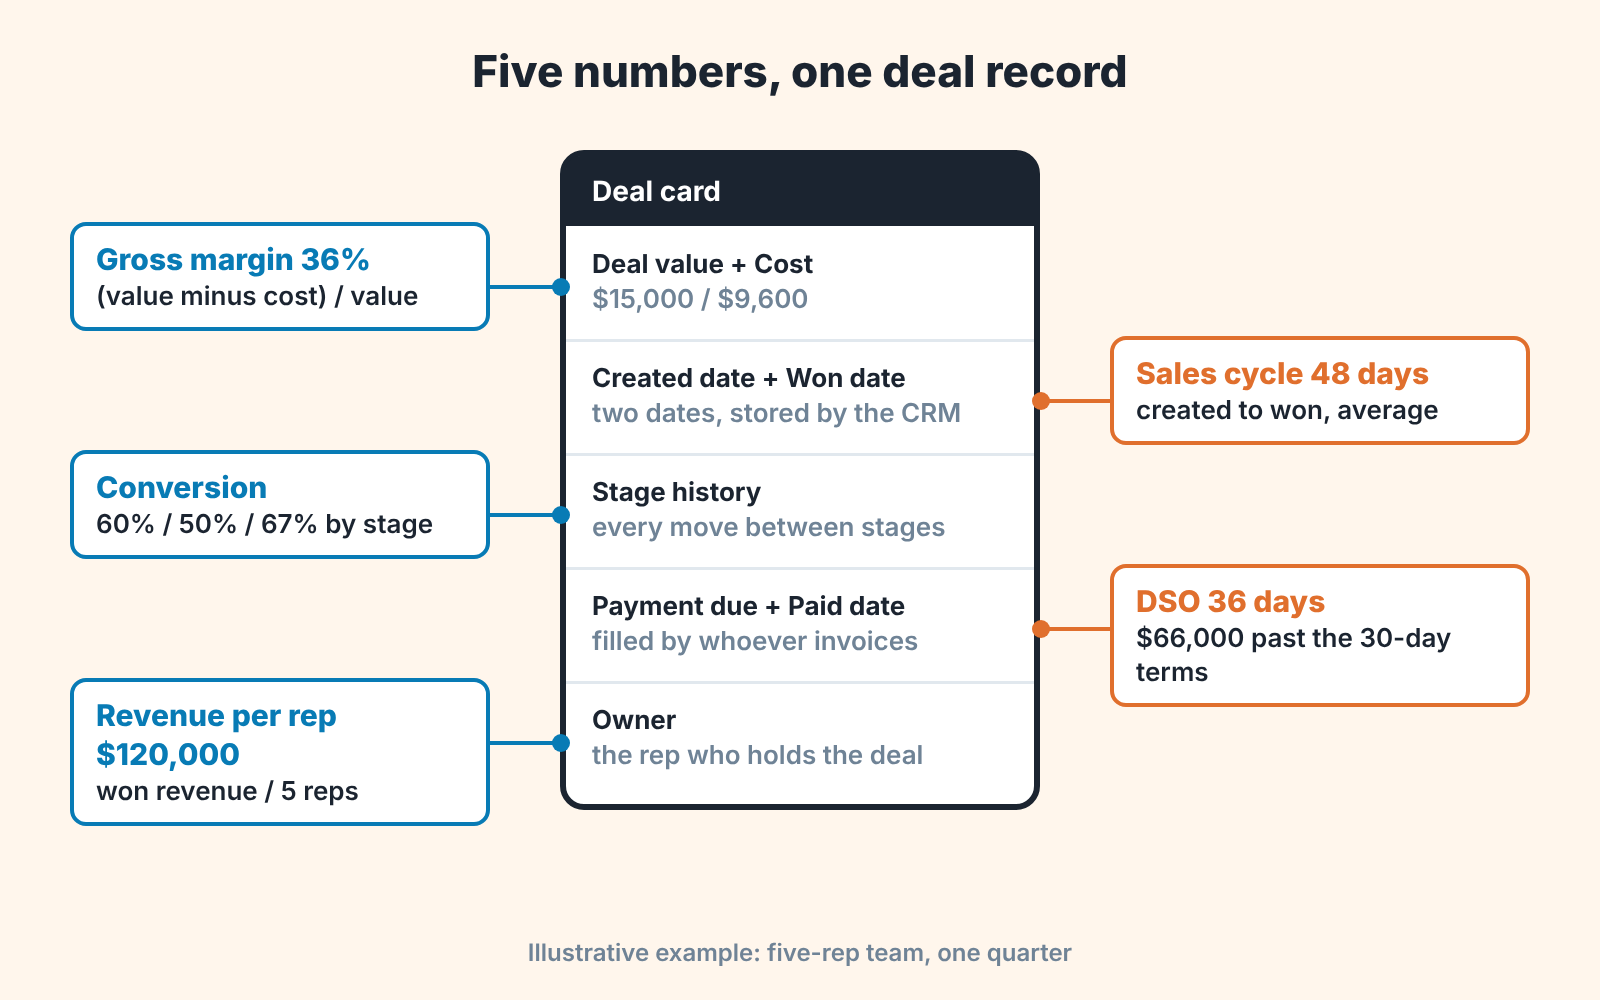
Field names differ between CRMs so the labels below are generic. Each number needs a home on the deal record and a saved report on top of it.
Start with margin. Deal value is already there. Cost usually isn’t. Add a currency field for direct cost and make it required at the proposal stage, then a calculated field (or a column in an export) gives you margin per deal. If you sell from a product catalog, put the cost on the product and let line items do the sum. Discounts get their own field, because a discount hidden inside a lower deal value can’t be reported on later.
Sales cycle is the easy one. It needs two dates that every CRM stores on its own, created and won. Build the the report on won deals only and split it by deal size. An average across a $3,000 order and a $60,000 project tells you nothing about either.
Stage conversion costs nothing to set up. It comes from stage history, which the CRM records each time a deal moves (you don’t have to set anything up for that). Open the funnel or stage conversion report for deals created in the period, and check that lost deals carry the stage they were lost at. Without that the report shows where deals were won and hides where they died.
With receivables the CRM usually has a gap. The cheapest fix is two date fields on the won deal, payment due and paid, filled by whoever sends the invoice or synced from the invoicing tool. A filter “won, payment due before today, paid is empty” becomes your past-due list. The ledger stays in accounting, and the unpaid $66,000 now shows up in front of the rep who owns the relationship.
Revenue per rep is won deals grouped by owner for the period. Add the margin column once cost is filled in, and the ranking of your reps may change.
Can you trust what those reports show? SalesBond runs a free CRM audit that reads the last 30 days of a connected CRM and sends a PDF with money at risk, the pipeline bottleneck, deal health and a view by manager; seven days later a second PDF shows what changed. Margin and receivables stay with you and your accounting. The audit checks how far the pipeline data behind numbers two and three can be trusted before you quote them to the owner. Check your CRM with SalesBond.
A ten-minute self-check
Close the CRM and take a sheet of paper. Give yourself two minutes per question and write a number for last quarter, from memory.
Five questions. What was the average gross margin on won deals, and which deal had the lowest? How long was the cycle, in days, created to won? At which stage did the team lose the largest share of deals, and what was the conversion there? How much money is invoiced and unpaid right now, and how much of it is past due? What did each rep bring in, in revenue and in gross profit?
Now open the CRM and look each one up. Count a number as known if your guess landed within 10% of the report. Three out of five is a decent start.
The questions the CRM couldn’t answer at all deserve more of your attention. A missing field is a bigger problem than a wrong guess, and it’s also the one you can fix this week.
Talking to the owner in money
Compare two versions of the same Monday update, both built on the example team.
The activity version goes like this. “We made 420 calls, held 38 meetings and sent 31 proposals. The pipeline looks strong and the team is working hard.” All true, and the owner learns nothing from it.
The money version. “We closed $600,000 at a 36% margin, so $216,000 of gross profit. $66,000 of it is past due and I’m calling those three accounts with the reps this week. Half our proposals never reach negotiation. If we lift that step from 50% to 55%, that’s four more deals a quarter, about $60,000 in revenue and $21,600 in gross profit. I want to test a proposal walkthrough call to get there.”
An owner can act on the second update. It names the money at risk and puts a price on the one change you’re asking for (four deals, $21,600 of gross profit, from a single funnel step). Call and meeting counts still matter to you as a manager, and they belong in your own review with the reps. Owners and sales heads read different lines of the same business, which is covered in revenue vs profit and where each number lives in CRM.
What does business acumen look like outside the Monday update? Small things, mostly. Turning down a discount on the product line you know runs thin. Asking for a deposit when the buyer wants 60-day terms. Moving your strongest rep to the stage where the funnel leaks most. Putting past-due invoices next to closed revenue when you report.
The more senior the sales role, the more of the conversation sounds like the second version. That’s a large part of what separates the titles in VP of sales vs head of sales vs sales director.
How to build business acumen in a quarter
Ask how to get better at this and you’ll usually be told to take a finance course and learn to read the three statements (income statement, balance sheet, cash flow). We’d put that second. A course starts with documents a sales manager doesn’t own and can’t change, and the knowledge fades because nothing at work calls on it the next Monday. Five numbers from your own CRM get used every week, and each one moves when your team behaves differently. Start there, and pick up the statements when the owner’s questions go past what the CRM can show.
A quarter is enough if you attach one number to a habit you already have, the weekly 1:1.
In the first month every deal review opens with margin. Before the rep describes the buyer, they say the deal value, the cost and the discount. It feels slow for two weeks. After that reps start filling the cost field before the meeting, because nobody enjoys saying “I don’t know” twice.
The second month adds payment. Each 1:1 ends with the rep’s past-due list from the filter above and one action per account. Some “closed” deals will turn out to have open questions the buyer never raised with anyone in sales.
In the third month the rep presents. They bring thier own five numbers for the last 30 days and name the one they want to move. Your job shrinks to asking what they’ll do differently and writing it down.
By the end of the quarter you and the team have each looked at every number a dozen times. Pull out the sheet from the first self-check, run it again, and see which guesses got closer.


