
CAGR is the steady yearly growth rate that takes your revenue from its starting value to its ending value over several years. Take closed-won revenue by close year from your CRM, divide the last year by the first, raise it to one over the number of years between them, and subtract one. Four year-end totals, 500,000, 650,000, 720,000 and 864,000 (three years of growth), give a CAGR of 20%, even though no single year grew by exactly 20%.
That last sentence is the whole point of the number, and also the whole problem with it. CAGR tells you what your growth would have been if it had been even. It never was.
The CAGR formula and the two places it goes wrong
CAGR = (ending year revenue / starting year revenue) ^ (1 / number of years) − 1
This is the standard definition, the same one finance pages use for an investment that goes from one value to another (Wikipedia: compound annual growth rate). Nothing about it is specific to sales. What is specific to sales is which numbers you feed it.
Two details in the formula bite people.
“Number of years” is the number of growth periods, which is one less than the number of data points. Four year-end totals, 2023 through 2026, are three years of growth, so n is 3. Put 4 in by mistake and the same revenue reads as 14.6% instead of 20%, which is an easy slip to make on a board slide. Count the gaps between the columns.
“Starting year revenue” has to be a full year on the same basis as the ending one. A starting year where the CRM went live in June is a half year, and the CAGR from it is fiction. Start from the first full year of closed-won data, even if that shortens the span.
To calculate CAGR in Excel, put the yearly totals in C2 through C5 and type =(C5/C2)^(1/3)-1. Format as a percentage and you are done. If you prefer a built-in function, =RRI(3,C2,C5) returns the same rate (Microsoft: RRI function).
Where the yearly numbers come from in your CRM
Pull closed-won deals, grouped by the year of the close date, summed by deal value. That is the report. Everything else in this article assumes you have those four totals and nothing else.
Four things to get right when you build it.
The status filter is won. “In the last stage” is a different filter, and a deal sitting in a Closed Won stage that was never marked won is a pipeline deal with a confusing name. Filter on the won status your CRM uses: in Pipedrive the deal is marked won and gets a won time; in HubSpot the deal moves to a closed-won stage and the Close date is set.
The date field is the close date. A deal created in November 2024 and won in February 2025 belongs to 2025. Group by created date and you are measuring how many deals you opened, which is a different number with a different article. Which field carries the close date in each CRM, and how to stop the default report from using the wrong one, is worked through in sales growth rate from CRM closed-won deals. That article does month-over-month; this one does years. Same filter, different grouping.
Save the report with the the basis in the title. “Closed-won by close year, 2023 to 2026” is a label somebody can check next October. “Revenue by year” is not.
On the value: deal value in the CRM is what was sold, which may differ from what was invoiced or collected. For CAGR that is fine, as long as every year uses the same field. Why the CRM total and the accounts total disagree is a separate topic, covered in revenue vs profit and where each number lives in the CRM.
A worked example with four year-end totals
The numbers here are illustrative. We made them up to show the mechanics, and they are rounder than anything a real CRM produces.
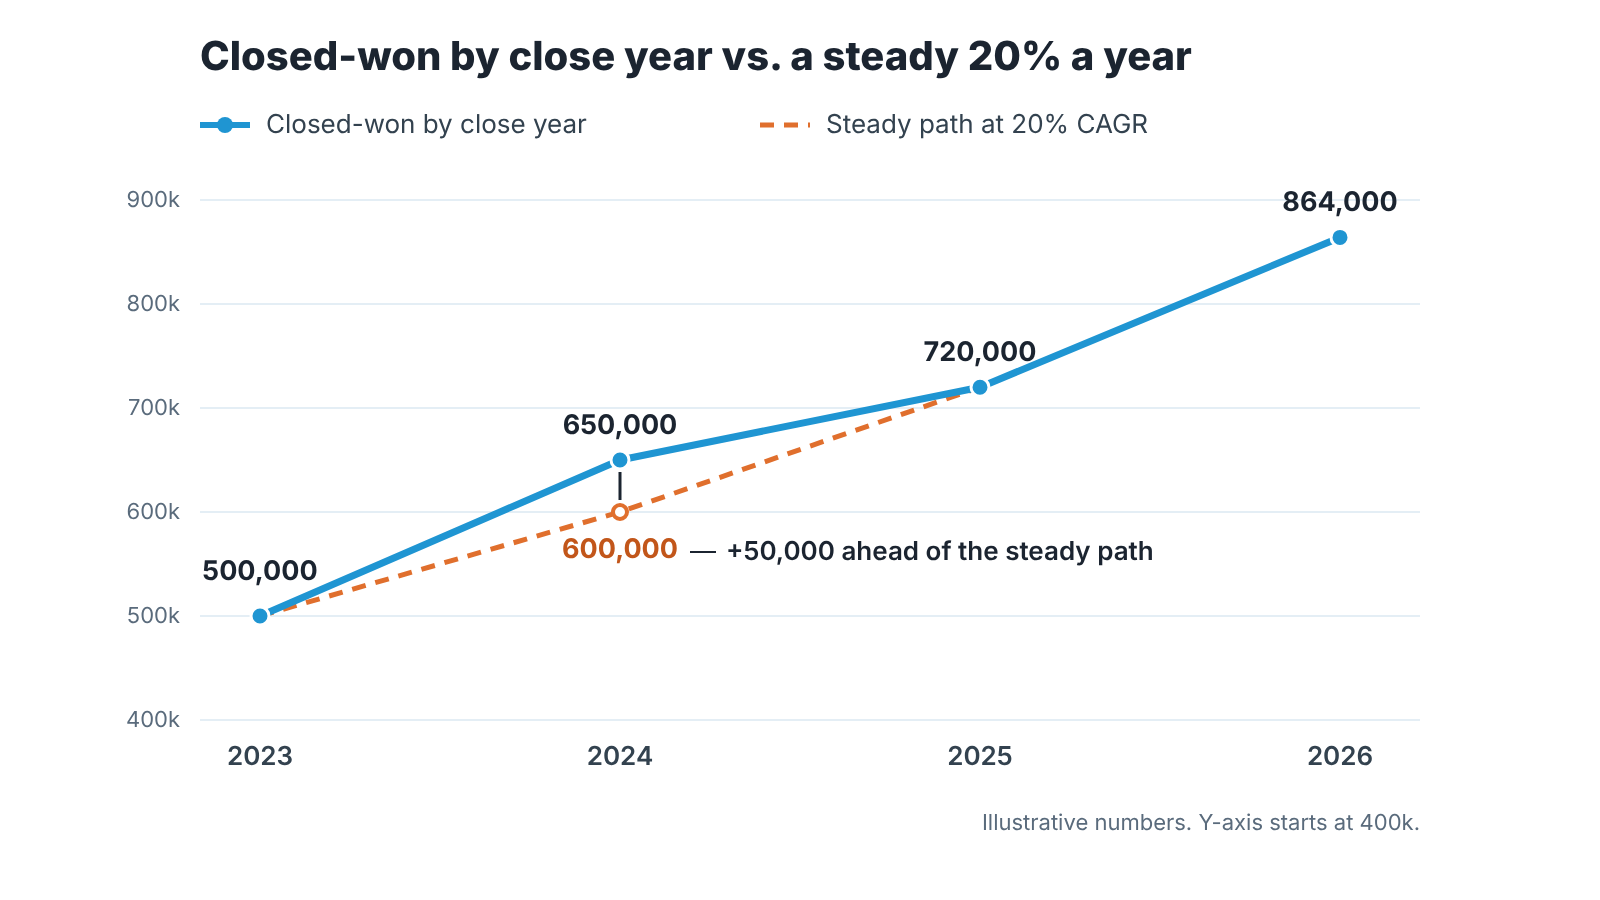
Say the closed-won report shows 500,000 for 2023, 650,000 for 2024, 720,000 for 2025 and 864,000 for 2026. Year on year, that is +30.0%, then +10.8%, then +20.0%. Uneven, like most real years.
Ending year divided by starting year: 864,000 / 500,000 = 1.728.
Three years of growth, so raise that to one third: 1.728 ^ (1/3) = 1.2.
Subtract one: 0.2, which is 20%.
Now draw the steady path: what the business would have done growing by exactly 20% every year. That is 500,000, 600,000, 720,000 and 864,000. It starts and ends where the real numbers do, by construction. In between, it does not match: 2024 was ahead of the steady path by 50,000, and 2025 was exactly on it. A reader who only sees “20% CAGR” learns none of that.
CAGR vs average annual growth rate (AAGR)
The average annual growth rate (AAGR) is the yearly growth percentages added up and divided by their count, three in our example. CAGR is the single rate that, compounded, reproduces the end value. They are different numbers that answer different questions, and the gap between them widens the bumpier your years were.
In the worked example the two are close: the average of 30.0, 10.8 and 20.0 is 20.3%, against a CAGR of 20.0%. Smooth years, small gap.
Now keep the same start and end and make the middle rough: 500,000, then 750,000, then 600,000, then 864,000. Growth on prior year reads +50%, −20%, +44%. The average of those is 24.7%. The CAGR is still 20.0%, because the first and last year did not move.
Which one is right? Both for their own question. The AAGR says “in a typical year we grew by about a quarter”. The CAGR says “the business is 1.728 times its 2023 size, and 20% a year gets you there”. The finance pages describe this as CAGR smoothing out fluctuations that distort a simple average (see Jobaaj Learnings).
Our position: when the question is “how big did we get, and how fast”, use CAGR, because the order of good and bad years cannot game it. When the question is “what does a normal year look like for us”, use the list of yearly growth rates, because the list shows the −20% that an average hides. We do not put the average on the owner’s page at all.
What CAGR hides: one big deal, a weak middle year, seasonality
CAGR reads two numbers. Anything that happens to the years in between, or inside the end years, is invisible to it. Three cases come up again and again on a small team’s multi-year chart.
One big deal in the last year. Say the 864,000 in 2026 includes a single 180,000 contract, the largest the team has ever closed. Take it out and 2026 is 684,000, and the three-year CAGR drops from 20.0% to 11.0%. The deal is real. But 20% a year is a statement about the business, and one customer signing once is not the business producing more every year. Report both: CAGR with the deal and without it, and say which customer it was.
Then there is the weak middle year. The rough path above, with its −20% in 2025, has the same CAGR as the smooth one. An owner who lost a key account in 2025 and rebuilt through 2026 has had a very different three years from one who grew steadily, and the single number cannot tell them apart. The yearly list can, which is why growth on prior year belongs next to the totals wherever the CAGR is quoted.
Seasonality and the choice of years are the third case. CAGR is anchored to the first and last year, so moving either anchor moves the answer. A team whose fiscal year ends in a quiet month and one whose year ends in the busiest month show different CAGRs for the same twelve months of selling, just by where the cut falls. Pick calendar year or fiscal year once, write it on the report and do not switch to whichever gives the nicer figure. The same goes for the span: a three-year and a five-year CAGR for the same team are legitimately different numbers, and quoting the higher one without the span is what a buyer’s accountant catches in a minute.
A fourth thing, said plainly: CAGR on closed-won revenue is growth in money, and prices are part of money. If list prices went up over the span, part of the CAGR is price, and only the rest is more customers or bigger deals. The CRM will not separate those for you. Count the deals too, and compare growth in count with growth in amount; sales volume vs sales revenue walks through where each lives in the CRM.
Using it: next year’s target, comparing teams
Use a CAGR as the baseline you measure the next number against.
If closed-won has compounded at 20% for three years, 864,000 × 1.2 = 1,036,800 is what “the same again” looks like for 2027. That is the figure a target has to argue with. Set 1,100,000 and you are saying the pipeline, the team or the pricing has improved on last year, and you should be able to name which. Set 900,000 and you are saying something has stopped, and you should be able to name that too. Either way the conversation is “why not the CAGR line”, which beats “what feels right”.
Before you lean on it, check the big-deal case above. A CAGR that drops from 20% to 11% without one contract gives you two baselines, and the lower one is the one to plan from, because the contract has already been counted once.
Is 5% a good CAGR? Is 20%? There is no number that is good for every business, and a benchmark from someone else’s market tells you little about yours. Compare your CAGR with the plan you set at the start of the span and with the CAGR of the span before it. The same logic for a single month’s growth rate is in Is 18% good? Compare it to your plan, not to a benchmark.
Comparing two teams or two product lines is where CAGR earns its keep, because it removes size from the comparison. Team A goes from 300,000 to 480,000 over two years: 26.5% CAGR. Team B goes from 200,000 to 360,000 over the same two years: 34.2%. Team A added more money. Team B grew faster from a smaller base. For where to put the next hire, the faster rate is usually the stronger signal, because it says that team’s market is not close to full. For which team to protect in a bad year, the larger absolute number wins. Put both on the page.
Where CAGR does not belong is in a rep’s own numbers. Three years of one person’s closed-won is a handful of deals, often with one dominating a year, and the compounding arithmetic turns that noise into a confident-looking percentage. Use it for the business, a team or a territory, and keep it off individual reps.
How a growth figure like this turns into a key result that the team can actually act on, with the CRM fields behind it, is in OKRs for a sales team from CRM data.
Related numbers, and which one to read when
CAGR answers one question: over several years, how fast did we compound. For the month you are in, it is the wrong instrument. The month-over-month and three-month-window growth rate from the same closed-won report is in sales growth rate from CRM closed-won deals, including why a single month’s percentage is mostly noise.
The one we would add to a multi-year view is the share of each year’s closed-won revenue that came from customers who were new that year. Two businesses with the same 20% CAGR can be in very different shape: one is winning new logos every year, the other is selling more to the same ten accounts. The CRM gives you that split if every deal is linked to an organization: a customer is new in the year of its first won deal. SalesBond’s free CRM audit gives the short-range version of that split, reading the last 30 days of the connected CRM into a PDF report with repeat customers and the top-10 clients, and a second report follows a week later.
Keep the three on one page: the yearly totals with growth on prior year, the CAGR with its span and its without-the-big-deal version, and the new-customer share. An hour to build once, ten minutes to update each January. Quote the CAGR with its span and the table beneath it, because a bare percentage is the first thing an accountant asks about.


