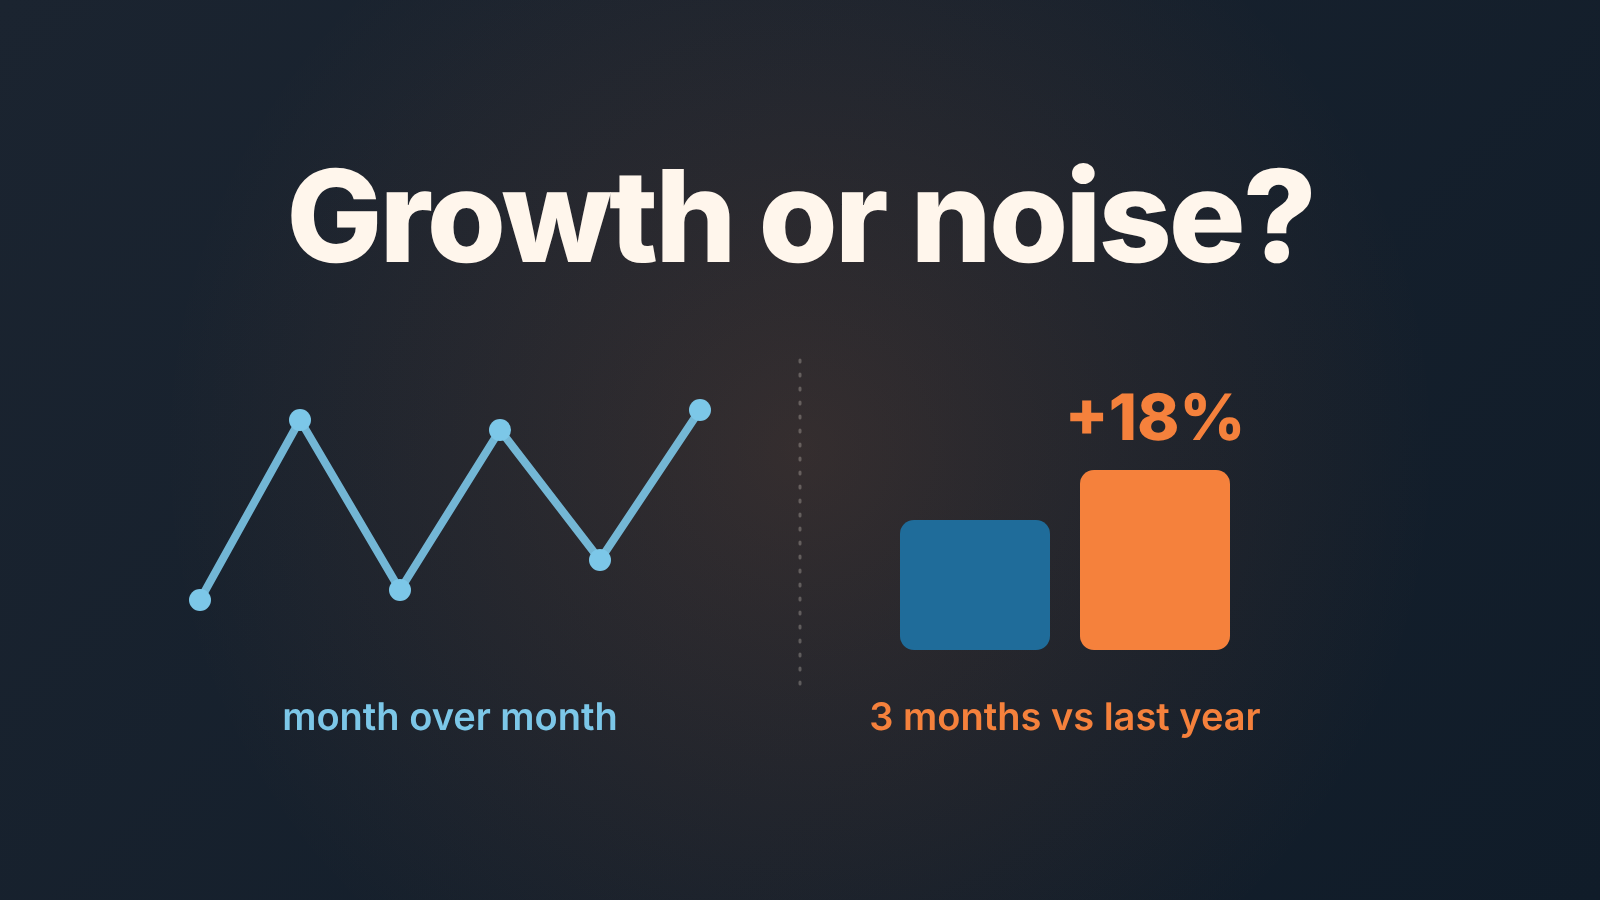
Sales growth rate is the change in closed sales between two periods divided by the earlier period, times 100: (this period - last period) / last period × 100. From a CRM, take closed-won deals by close date, compare like with like (three months against the same three months a year ago), and check for one big deal or moved close dates before you call it growth.
That is the whole formula. A CRM can make it lie to you in three ways, and we have watched each of them turn a flat quarter into a “growth” slide.
The sales growth formula, with six months of closed-won data
Sales growth rate (%) = (current period − prior period) / prior period × 100
The arithmetic is the same everywhere. Zendesk works it through on H&M’s quarterly sales (Zendesk: sales growth), and KPI libraries build it from the same two inputs, current-period and previous-period sales revenue (Klipfolio: sales growth). What those pages do not tell you is which deals go into “period”, and that is where an owner with a CRM gets it wrong.
Our rule is that a deal counts in a period when its status is won and its close date falls inside that period, whatever its created date or the day it reached the last stage.
Here are six months of illustrative numbers for a small team, this year against the same months last year. They are made up to show the mechanics.
| Month | Closed-won this year | Closed-won last year | Month over month (this year) |
|---|---|---|---|
| May | 42,000 | 40,000 | |
| June | 61,000 | 44,000 | +45% |
| July | 38,000 | 36,000 | -38% |
| August | 55,000 | 45,000 | +45% |
| September | 47,000 | 43,000 | -15% |
| October | 64,000 | 48,000 | +36% |
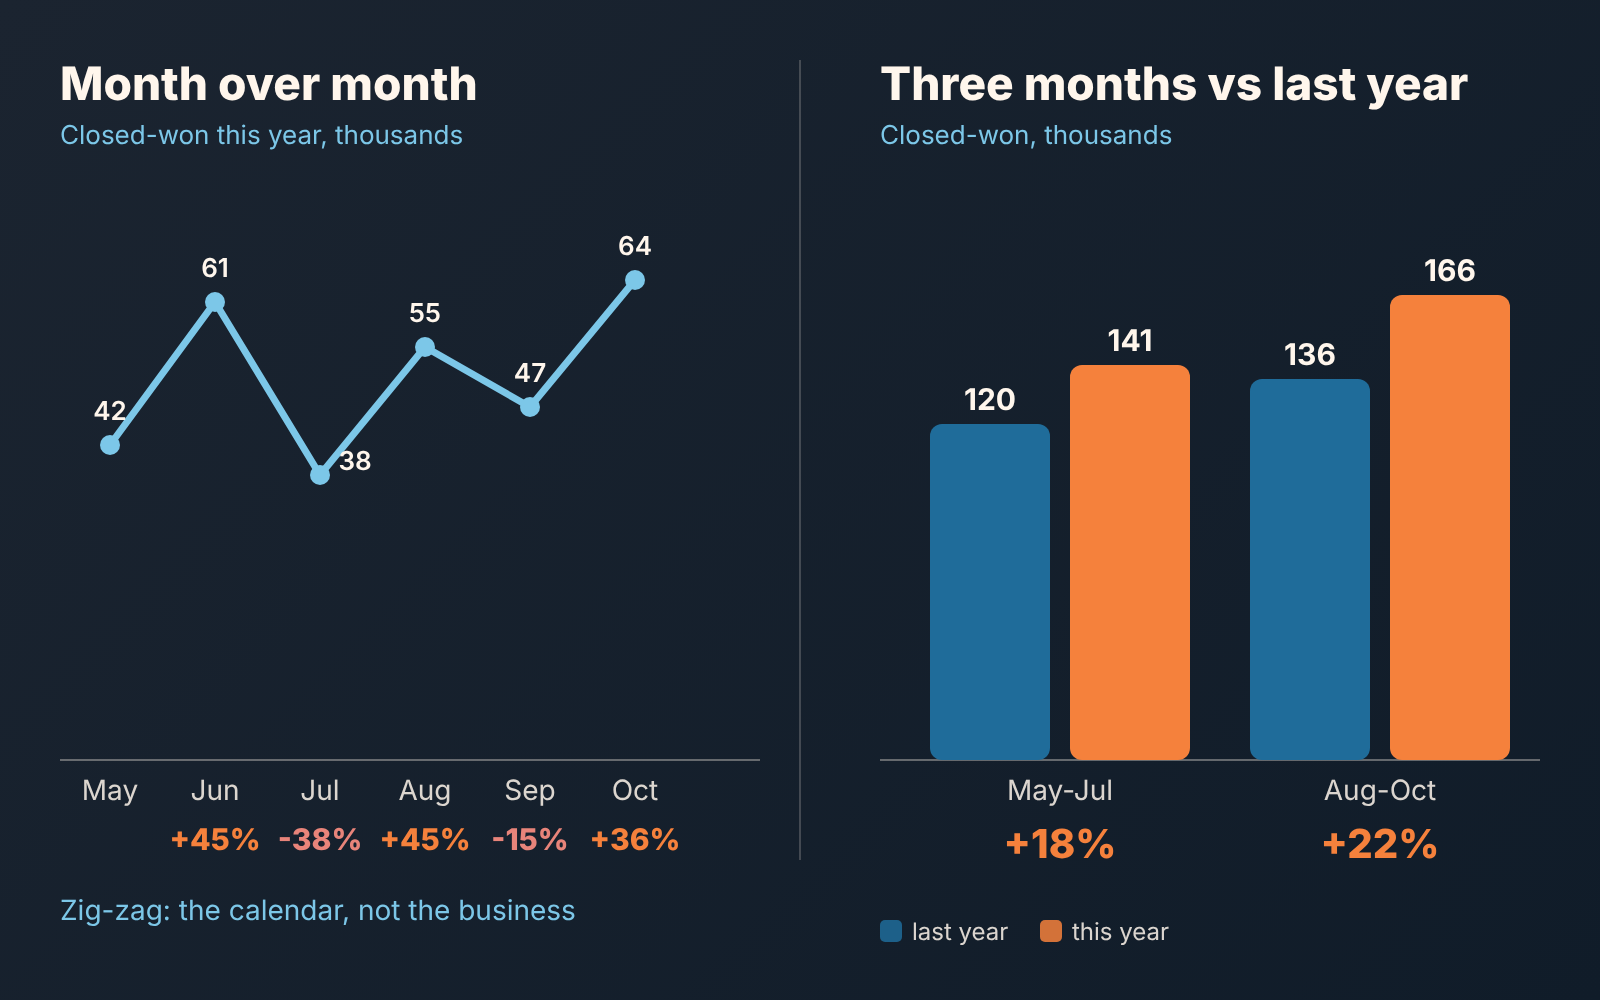
Read the last column. Up 45, down 38, up 45, down 15, up 36. If you reported that line to a bank or a co-founder, what would they conclude? Nothing, and they would be right.
Month over month is noise: use a three-month window against last year
Month over month fails a small team for a simple reason: with ten or twenty closed deals a month, one deal landing on the 1st instead of the 31st moves the number by double digits. The zig-zag above comes from the calendar.
Two changes fix most of it.
First widen the window. Add up three full calendar months and compare that sum. In the table, May to July this year is 141,000 and August to October is 166,000.
Second, compare year over year: the same three months last year. Those months carry the same seasonality, the same holidays and the same budget cycles your buyers run on. May to July last year was 120,000, so that window grew 18%. August to October last year was 136,000, so that window grew 22%.
Two windows, 18% and 22%, give you a signal you can say out loud on Monday, which the monthly line never did.
No data from last year yet? Compare the window to the previous window and say so next to the number. “Aug-Oct vs May-Jul, +18%” is honest. “+18% growth” with no period attached is how a seasonal bump becomes a plan.
Do not confuse this with run rate, which multiplies a recent period forward. That is why annual run rate from CRM closed-won deals leaves out one-off deals, prepaid annual contracts and seasonal peaks. Growth compares two periods that have already happened, so a one-off deal stays in: it was a real sale. The year-over-year window already absorbs the seasonal peak. What growth does need is a second look at an unusually large deal, which is the first distortion below.
Is 18% good? Compare it to your plan, not to a benchmark
People search for a “good” sales growth rate as if there were one number. There isn’t one we would put our name to, and an industry average tells you nothing about a team of six.
The useful comparison is with your own plan. Zendesk’s H&M example makes the point without meaning to: 3.5% is positive growth, and it still falls short of the 5% goal the company had set. For an owner reading a CRM, growth is good when three things hold at once: the window beat the plan for that window, it beat the same window last year, and the number of won deals did not shrink while the amount grew. With two of the three, you have something to discuss; with one, the growth may be chance.
Pick the date field first: close date, not created date
Before you build the report, decide which date puts a deal in a month. If you skip this step the CRM decides for you, and it usually picks the wrong one.
In HubSpot the default deal property is Close date, “the day the deal is expected to close, or was closed”, and HubSpot sets it to today’s date when the deal moves into a closed-won stage (HubSpot: default deal properties). That same page defines Create date as the date the deal was created. Two dates, often months apart. A growth report built on Create date measures how many deals you opened and says nothing about how much you sold.
In Pipedrive the trap is in the report defaults. The deal performance report in Insights starts with the filter “Deal created > is > this year” (Pipedrive: deal performance report). Leave it as is and your “won deals by month” chart is bucketed by when deals were created. The date you want is the deal’s won time, the moment it was marked won (Pipedrive: editing the deal won time). Change the filter to won time, then save that report so nobody rebuilds it from the default next month.
Our position: close date, always, and written on the chart. “Closed-won by close date, Aug-Oct 2026” is a label a reader can check. “Sales, Q3” is not.
Three distortions: one big deal, moved close dates, changed pipeline stages
Three things inflate growth on paper without changing the business: one big deal, a close date that moved between months, and a pipeline that changed shape.
One big deal. In the illustrative October above, 64,000 includes a single 28,000 deal, the largest the team has closed all year. Take it out and October is 36,000, the August to October window is 138,000, and growth against last year drops from 22% to about 1.5%. The deal is real and the money is real. Growth is supposed to show the business producing more, and a single deal shows one customer buying more. Report both numbers: with the deal and without it. If one customer is becoming a large share of what you close, that is a different risk with its own article, customer concentration risk in Pipedrive.
A close date that moved. Suppose a 20,000 deal was marked won on October 2 after the rep expected to sign on September 30. By close date it belongs in October, and that is correct. But look what it does to month over month: September would have been 67,000 and October 44,000, so instead of “+36%” the monthly line reads “-34%”. Same business, same deal, two days apart. The three-month window does not move, because both dates sit inside August to October. If you run a monthly number anyway, keep a list of deals that closed in the first three business days of the month and read it before you read the percentage.
A pipeline that changed shape. Teams rename stages, merge two pipelines, or move a product line into its own pipeline. None of that touches a deal amount and each one breaks the comparison. The common case: last year won deals lived in one pipeline, this year half of them sit in a new one, and the saved report only looks at the old one. The number falls and someone starts a conversation about the market. Check that the filter covers every pipeline that held won deals in both periods, and write the pipeline list next to the period.
The habit that protects you from all three is boring: at month end, export that month’s won deals with amount, close date, pipeline and owner, and keep the file. CRM data gets edited, won dates included. A saved month-end snapshot keeps September as you reported it.
Growth in deal count vs growth in amount
Amount is the number everyone asks for, and count is the number that explains it.
Back to the illustrative windows: August to October this year brought 166,000 from 31 won deals. The same window last year brought 136,000 from 34 deals. Amount is up 22%; deal count is down 9%. Average won deal went from 4,000 to about 5,355.
This is different news, and not necessarily bad. The team is winning fewer customers and bigger ones, or pricing higher, or one 28,000 deal is doing the work. Each of those has a different next action, and you cannot pick one from the amount line alone.
So we track both, on the same chart, same window, same date field. When they split, the split is the thing to explain in the monthly note. Which CRM fields carry these numbers cleanly is in sales performance metrics and the CRM fields behind them.
What the owner writes next to the number every month
Write a short note next to the growth figure. The note takes two minutes and makes the the number defensible a year later, when nobody remembers which deal closed on the 2nd.
- The periods, both of them: “Aug-Oct 2026 vs Aug-Oct 2025”.
- The date field: closed-won by close date.
- The pipelines included.
- Amount growth and deal-count growth, side by side.
- The largest deal in the window, by name, and the growth figure without it.
- Any deal that was expected in the prior period and closed in this one.
- Where the snapshot file lives.
Put this next to the growth tile on the owner’s CRM dashboard rather than in a slide, so it is read monthly. And keep growth away from the forward-looking tile: growth is what closed, forecast is what might, and mixing them is how revenue forecasting inherits every distortion above.
A disclosure, since this is a report we keep rebuilding for ourselves: we build SalesBond, a sales management layer on top of the CRM a team already uses; we started with Pipedrive, one of the 15 CRMs it works with. It monitors the health of deals and customers, explains the risks, and gives managers and owners a clear picture of execution, forecast and plan. The plan itself is still yours to set. Check your CRM with SalesBond if you want the owner’s picture without building these reports by hand.