
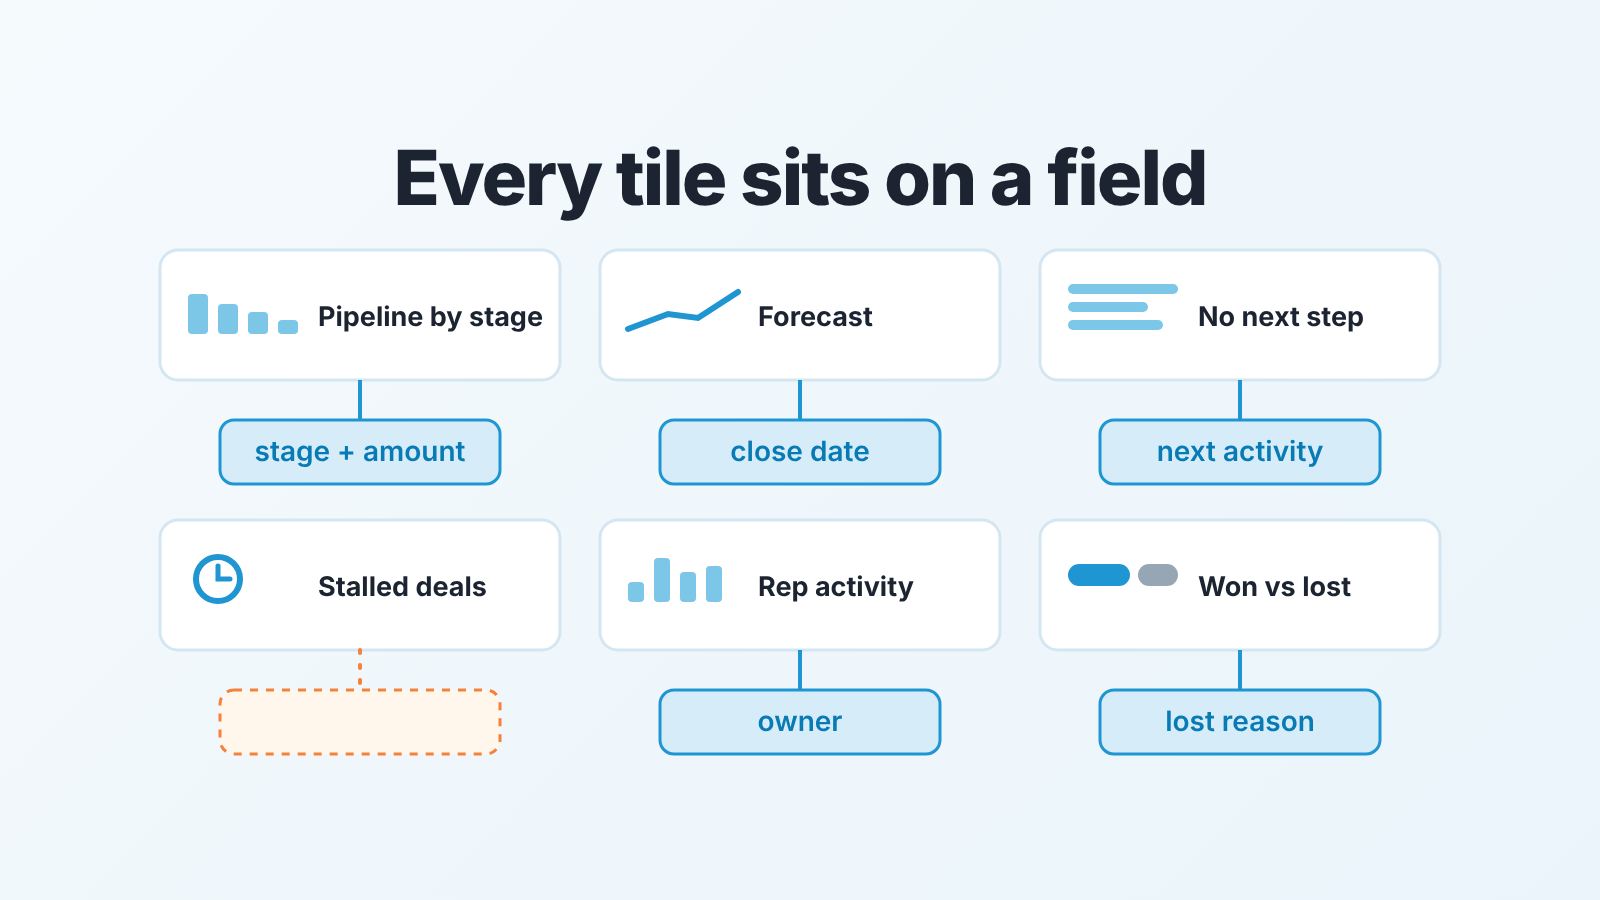
A CRM dashboard worth opening every week has six tiles: pipeline by stage, forecast for the period, deals without a next step, stalled deals, rep activity, and won versus lost. Each tile is only as honest as the field behind it, so check the close date, owner and next step before you trust the numbers.
The mechanics are the same in Pipedrive, HubSpot, Salesforce and Zoho CRM. Only the object names change, so we keep this CRM-neutral.
What a CRM dashboard is for (one screen, six questions)
A dashboard is a shop window for the data. The CRM holds deals, people and activities; the dashboard is a set of queries over those records, drawn as tiles. If a deal has no close date, no amount or no owner, no chart design will put it in the right place. Which KPIs belong on it is a separate choice, worked through in a KPI dashboard for a business owner.
So build it backwards from questions. An owner has roughly two, how much money is coming in this period and where the risk is. A head of sales adds two more, what needs doing today and who is doing it. On the screen those four split into six narrower questions, one per tile, about where deals pile up, what the period will close at, which deals have no next step, which have stalled, who is working the deals, and what won and lost say about the rest. The overlap is fine, because the owner and the head of sales read the same screen differently, and what the owner reads once a period, with a target and a reason per line, is the KPI report for a business owner.
We wrote the manager’s version of this screen earlier, as a sales dashboard with six numbers and what to cut. This piece goes one level down: the field under each tile, and what happens when it is empty.
The field behind each CRM dashboard tile
Every CRM dashboard tile is a query that filters or sums one or two deal fields, and when the field is empty or stale the tile shows a wrong number instead of going blank. Nobody questions a number that looks normal.
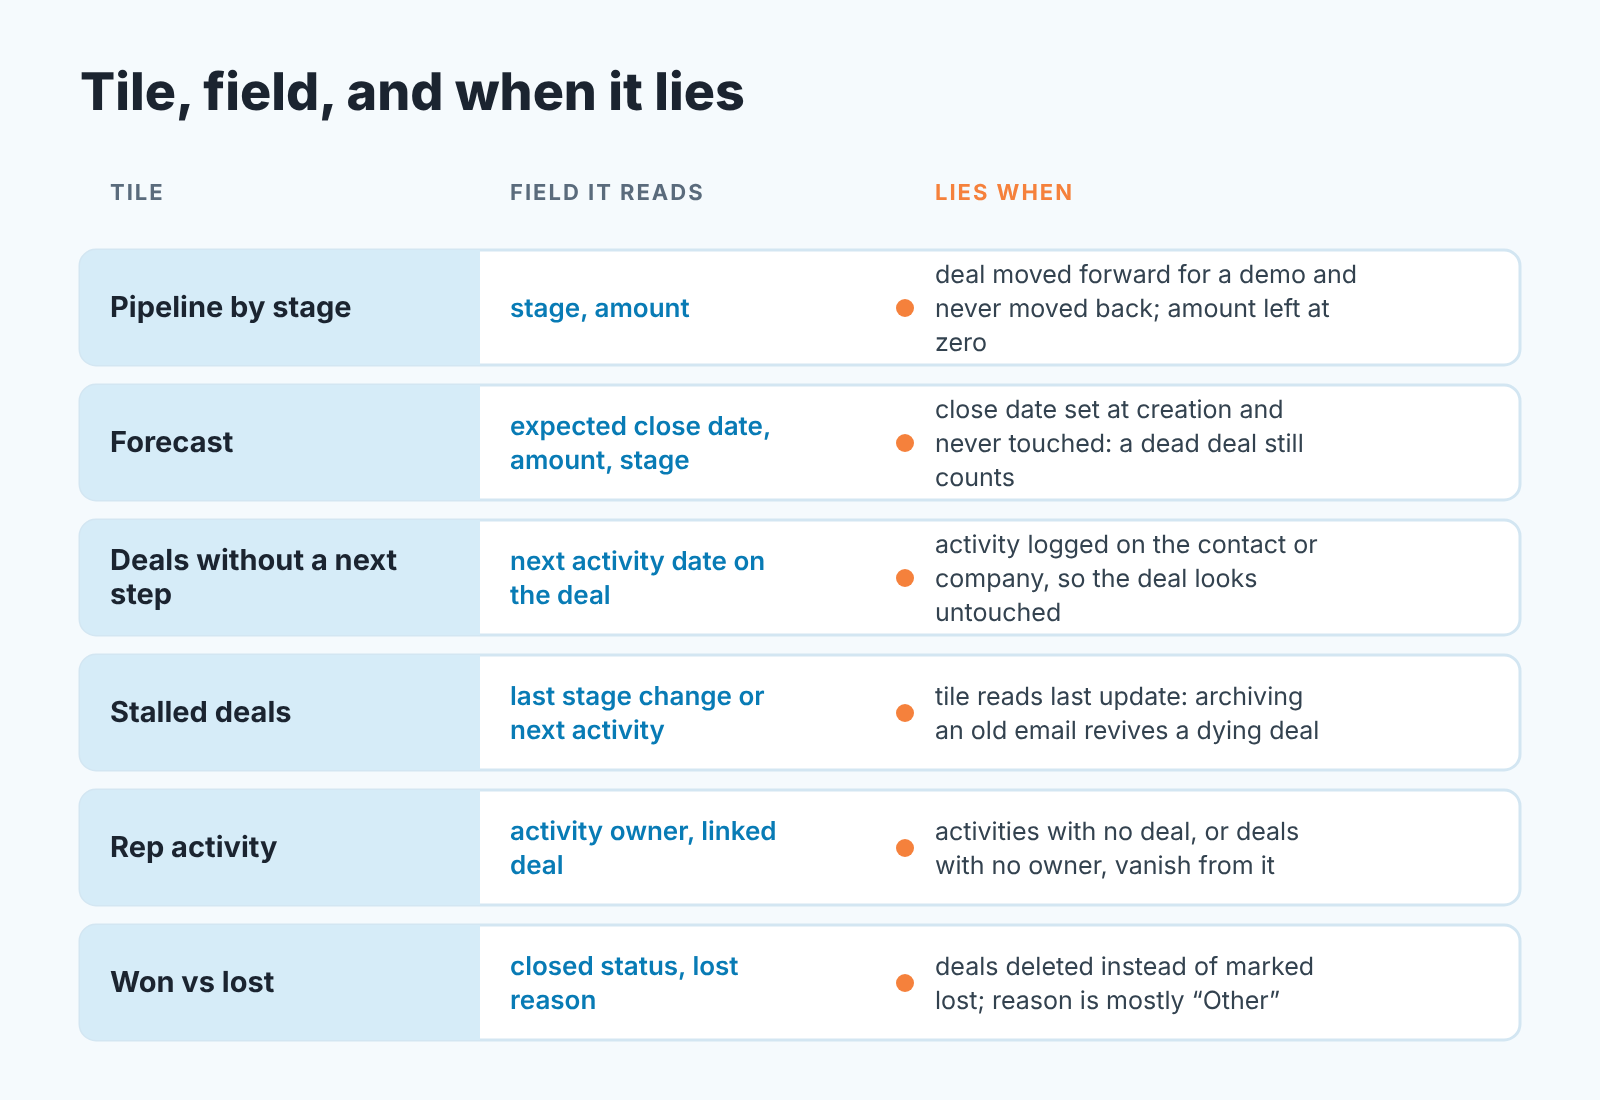
Pipeline by stage reads stage and amount, and shows where deals pile up. It lies when a rep moves a deal forward for a demo and never moves it back, or leaves the amount at zero or a placeholder.
Forecast for the period reads expected close date, amount and stage. HubSpot’s forecast tool, for example, uses deal stages by default, can also group deals by forecast category if you set those up, and sums the amounts of open deals for the selected period (HubSpot: use the forecast tool). The tile lies when the close date was set at creation and never touched: a dead deal still counts for this month. We treat a deal whose close date has been pushed three times as a different kind of deal from one whose date has never moved.
Deals without a next step reads the next activity date on the deal. It goes wrong when reps log activity on the contact or company instead, so the deal looks untouched (or the other way round). Make a dated next activity the exit condition for every stage, and the tile turns into a to-do list instead of a confession.
Stalled deals depends on what your CRM means by “activity”. In Pipedrive the rotting period is based on the deal’s last updated time, and that can include marking activities as done or sending, receiving, archiving, unlinking or deleting emails linked to the deal (Pipedrive: the rotting feature). A rep who archives an old email has just made a dying deal look alive. If your stalled tile reads last update, it misses exactly the deals you built it to catch. Read the last stage change or the next activity date instead, and say which one in the tile title.
Rep activity reads activity owner and linked deal, ideally filtered to the deals that matter. Activities with no deal, or deals with no owner, simply vanish from it.
Won versus lost reads closed status and lost reason over a fixed window. Its the only tile that looks back, and it is there to explain the other five. It can’t do that if deals get deleted instead of marked lost, or if lost reason says “Other” most of the time.
Six is roughly what fits on one screen. We listed what to leave off the screen in the manager piece, and the test for any extra tile is the one from our list of questions sales management in a CRM should answer: if this number moved, what would you do differently on Monday?
Owner view vs head-of-sales view
Most CRM dashboard examples show one screen for everyone and stop there. We’d keep the one screen, but give it two reading orders.
The owner opens it once a week, usually before a Monday meeting, and reads top down for money and risk. Forecast first: is this period on track, and how much of it is committed rather than hoped for. Then pipeline by stage and won versus lost, for next period and the trend. The owner should not be going through the no-next-step list deal by deal. If they are, it’s a sign the head of sales isn’t. The dashboard is also only one of the things the owner reads, and the full set of CRM reports for an owner and a head of sales, with who reads each and when, has its own piece.
The head of sales opens it every morning and reads bottom up for action. Deals without a next step come first, because that list is today’s calls. Stalled deals second, since each one is a conversation with a rep this week. Rep activity third, as a cross-check: low activity on a rep’s biggest deals is the 1:1 topic, and high activity with nothing moving is a different conversation. The forecast comes last, and only to see whether the the morning’s work changed it.
Why not two dashboards? Because two screens drift apart within a month and the owner’s one ends up with the flattering filter, so we keep one screen with the definitions written into the tile titles. When the tiles outgrow the CRM, business intelligence tools for a sales team are compared by job in a separate piece.
Permissions and filters are where the two roles really differ, and those are CRM-specific. We covered them for HubSpot, Salesforce and Zoho CRM separately; for Pipedrive teams the closest piece is on reports for pipeline health.
A 10-minute check that the dashboard is telling the truth
Run it when the dashboard goes live and whenever a number looks too good. It uses deal lists, not the dashboard, because the point is to check the screen against its records.
- Open deals with an expected close date in the past. Each one carries value on a date that has already passed, so the forecast tile either counts it in a period it did not close in or has quietly dropped it.
- Open deals with no expected close date at all. They are missing from the forecast entirely, so if the list is long the forecast is understated and nobody knows by how much.
- Open deals with no owner. Every tile that groups by rep drops these without telling you.
- Open deals with no next activity scheduled, sorted by value. If the count differs from the no-next-step tile, the tile reads a different field than you think.
- Deals closed lost in the last 90 days with lost reason empty or “Other”. If that’s most of them, the won-versus-lost tile can’t explain anything.
- The three biggest deals in the forecast, opened one by one. Does the stage match what the rep said last week, and is there an activity in the last fourteen days? It takes about three minutes and shows whether the forecast holds.
If any step turns up more than a handful of records, leave the dashboard alone and fix the stage exit rules, so that a deal can’t leave a stage without a close date, an owner and a next activity. The dashboard gets honest on its own a few weeks later.
The check is only true on the day you run it, because people fill the fields and they drift. We build SalesBond, a sales management layer on top of the CRM a team already uses; we started with Pipedrive. A good part of what it does is this kind of check on every open deal, so the screen the owner opens on Monday is the one the head of sales already acted on. If you want to see that on your pipeline, check your CRM with SalesBond. By hand, the six steps above are enough to start.
FAQ
What is the difference between a CRM dashboard and a CRM report?
A dashboard is a screen of tiles you open to decide what to do, and each tile is a saved report drawn as a chart. The report is the list or table behind it, often sent out on a schedule.
How many tiles should a CRM dashboard have?
About six, which fits one screen without scrolling. If you need nine, some of them are reports that belong in a monthly email.
Why does my CRM dashboard show the wrong numbers?
Usually because the field under the tile is empty or stale: a close date never updated, a deal without an owner, activities logged on the contact instead of the deal. Run the deal lists above, then fix the stage exit rules.


