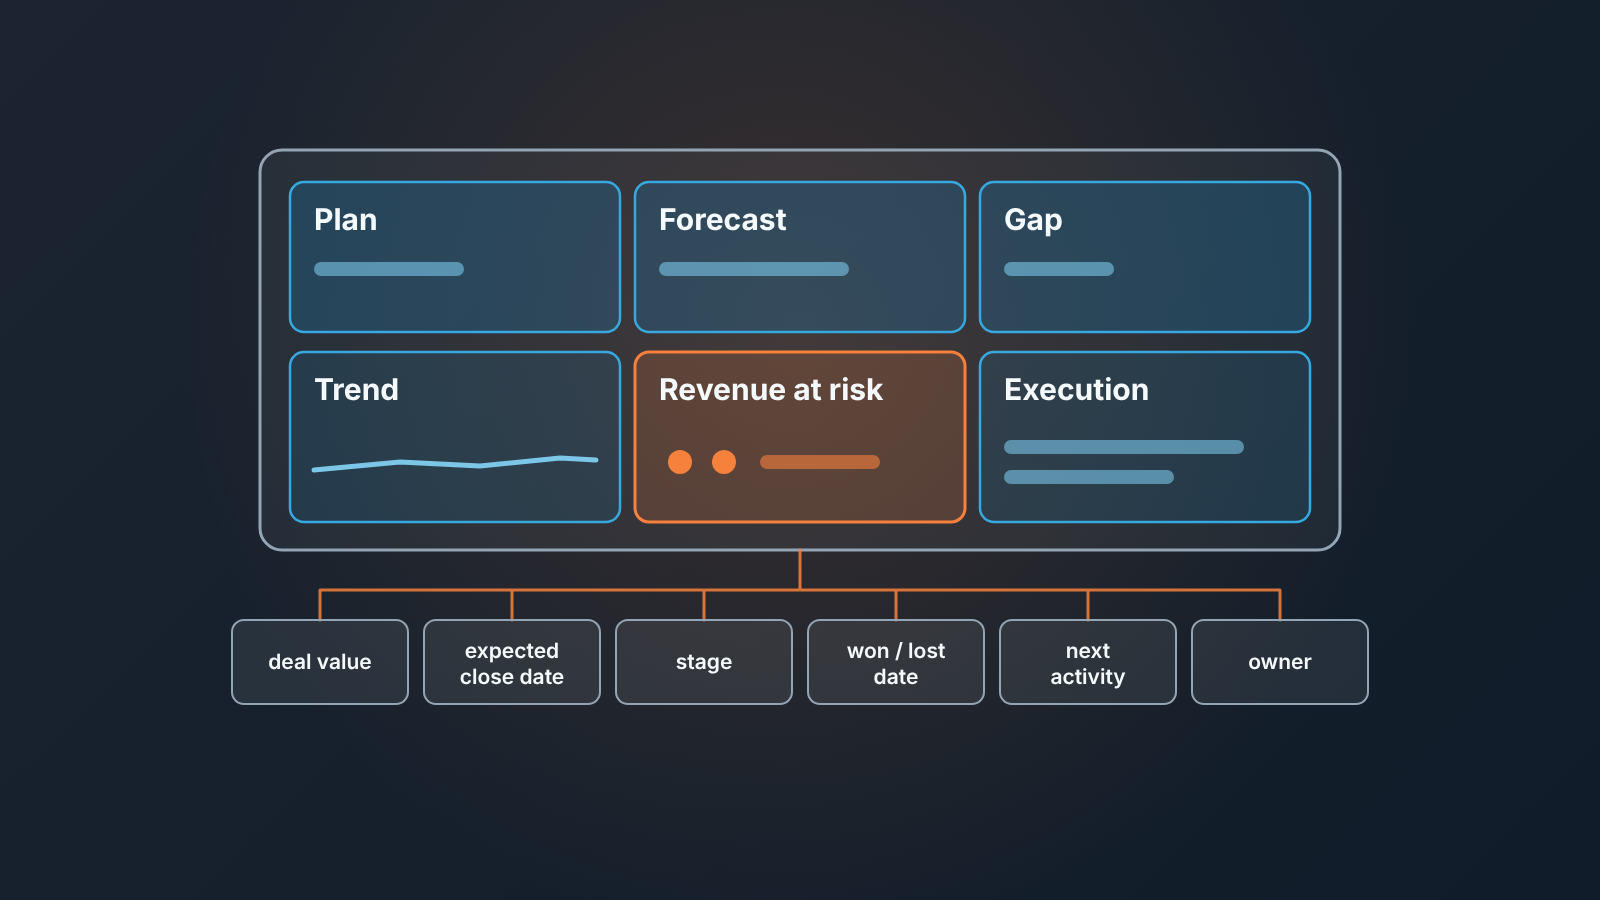
A KPI dashboard is one screen that tracks a handful of key performance indicators against their targets. For the owner of a business with a sales team, that means plan attainment, the forecast, the gap to target, the trend and the revenue at risk, each one drawn from a named field in the CRM.
Most guides to KPI dashboards come from BI and finance vendors, and they answer a different question: how to pick a few metrics for a company of any size and lay them out nicely. Fair enough. What they don’t tell the owner of a small sales team is which tiles belong on the screen, which CRM field feeds each one, or what to do when that field is empty on a third of the deals, and those three answers decide whether the screen gets used at all.
Three questions, one screen
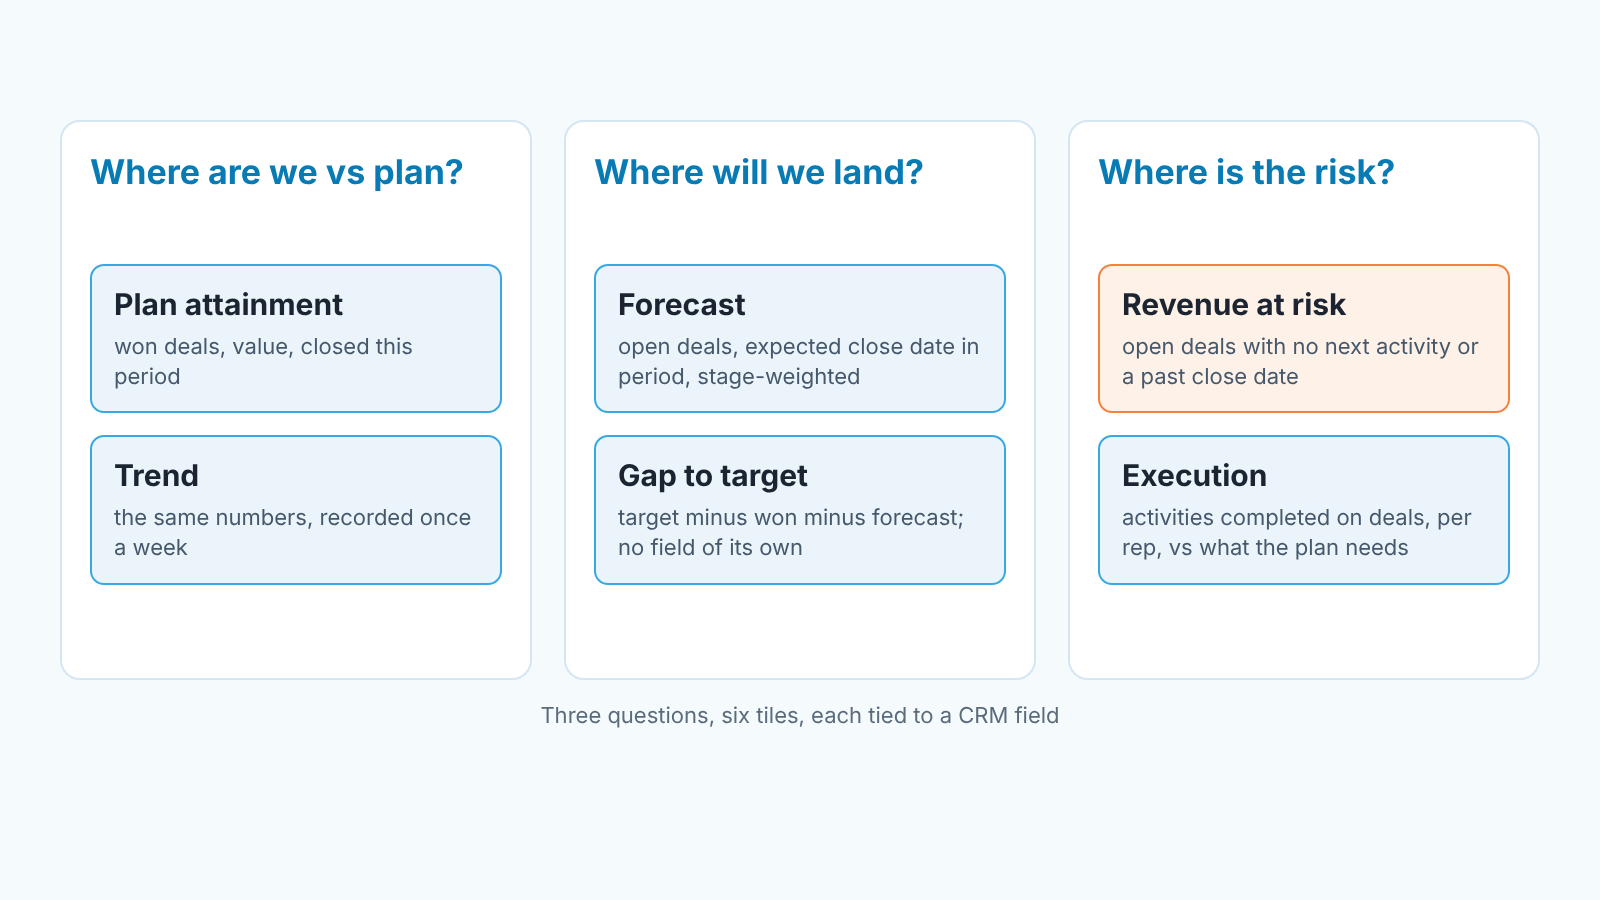
An owner opens a dashboard to answer three questions, and only three. Where are we against the plan? Where will we land at the end of the period? Where is the revenue that might not come in?
Everything on the screen should serve one of those. Plan attainment and the trend answer the first. The forecast and the gap to target answer the second. Revenue at risk answers the third. A sixth tile, execution, is there so the owner can tell whether a bad number is a market problem or a work problem. That decides who gets the phone call on Monday.
That’s the whole dashboard. If a tile doesn’t help with one of the three questions, it is a report, and reports live one click deeper.
KPI dashboard vs report: the difference is what you do after reading it
A report is something you study. A dashboard is something you glance at and then act on, or close. The owner still needs a written record of the period, and that is the KPI report for a business owner, eight lines on one page.
The test we use: can the owner read the screen in under a minute and come away with one decision or none? “We are behind, the forecast still covers the plan, risk sits in two deals, I’ll ask about those two.” That is a dashboard. “Here are forty rows of deals by stage, by rep, by month” is a report. Maybe a good one. Still not what the owner should see first.
This changes how you build it. A report can afford detail and a filter bar. A dashboard has to make the choices for the reader (this period, this currency, this scope of deals) and give them no option to wander. Every tile needs its period written on it, because a forecast figure means little without “this quarter, USD, open deals only” next to it. It’s also why a dashboard built from a spreadsheet export tends to drift into being a report. Someone adds a column, then a tab, and then nobody opens it.
A KPI dashboard example for a small sales team: the tiles and their CRM fields
The field names below are the generic ones. Pipedrive, HubSpot, Salesforce and Zoho CRM each call them something slightly different, and we went through the per-tile fields and how they go wrong in a CRM dashboard for owners and heads of sales. So this table stays at the level of what each tile is and where its number comes from.
| Tile | What it answers | Where the number comes from |
|---|---|---|
| Plan attainment | How much of the period’s target is already won | Won deals, closed in the period, summed on deal value; the target itself comes from the owner, not the CRM |
| Forecast | Where we land if the open pipeline behaves as it usually does | Open deals with an expected close date inside the period, weighted by stage or by a forecast category |
| Gap to target | How much is still missing after won plus forecast | Arithmetic on the two tiles above; no field of its own |
| Trend | Is this week better or worse than the last few | The same three numbers, recorded once a week and plotted |
| Revenue at risk | Which open money is in trouble | Open deals in the period with a signal against them: no next activity, expected close date in the past, no stage movement for longer than usual |
| Execution | Is the team doing the work the plan assumes | Activities completed against deals, per rep, in the period, compared with what the plan needs |
Look at the gap and the trend first. Neither is a field. Both are derived, and the trend also needs a record of past values, which in many teams lives outside the CRM in a sheet that someone updates each week. Skip that record and the dashboard tells you where you are today but never where you were. And that’s exactly the thing an owner’s memory is worst at. When the gap tile shows a shortfall, a gap analysis of plan vs closed-won finds where it sits, by rep, stage and deal size.
The target behind plan attainment is the one number the CRM can’t give you. We wrote up where it comes from in a one-page sales plan for a small team, and the forecast columns and weighting are in the sales forecast template built on CRM fields.
Revenue at risk is where the definition does all the work. “At risk” has to be a rule the team agreed on in advance. There’s a separate piece on how to define revenue at risk in a sales pipeline. The rule should read from fields reps already fill, not from a new field asking them to grade their own deals.
Every tile on this dashboard is a KPI with a written definition, and what is a KPI for a small business owner gives the plain-words version to hand to the team.
What not to put on it
Anything that goes up when the team does more of something, whether or not that something sells.
Total calls made. Emails sent. New deals created. Contacts added. On an owner’s screen these are vanity counts. They help a rep plan their own week and a manager coach one person, but on the owner’s dashboard they do one thing: they make a bad quarter look busy. We’ve seen owners relax because activity was up while the forecast was quietly falling, with the two tiles sitting right next to each other.
Same with total open pipeline as a headline tile. Its a comfort number. It rewards reps for adding deals and never closing them, and it hides the question that matters: how much of that pipeline is dated inside the period and actually moving? Pipeline by stage belongs on the manager’s screen, where someone will work it. Our version of that screen is in a sales manager’s dashboard with six numbers.
Why a hand-built dashboard breaks
It breaks at the fields under it, whatever tool sits on top.
Every tile in the the table is a filter or a sum over two or three deal fields. Expected close date is the big one: it feeds the forecast, the gap and half of the revenue-at-risk rule. In most teams it gets set when the deal is created, and then it’s either left alone or pushed forward each month with no reason given. A forecast built on those dates isn’t a little wrong. It’s wrong in a way that looks fine right up to the last two weeks of the quarter.
Stage is the second. Say one rep moves a deal to “Proposal” when the proposal goes out and another moves it when the proposal has been discussed. Your stage weighting is now averaging two different things. Next activity is the third. When a rep logs the activity on the contact instead of the deal, the deal looks abandoned to any rule that checks it, and the risk tile fills up with deals that are fine.
So the hand-built version fails in a particular way. It keeps producing numbers. Nobody notices the drift until the owner asks why the quarter closed well under a forecast that said “on plan” three weeks earlier, and the answer is a pile of deals with a close date nobody touched since the quarter began.
You can fix this by hand. Once a week, pull the open deals with a past close date and the open deals with no next activity, sort by value, and chase the top of each list. It takes about ten minutes and catches most of the problem. Both lists sit on the manager’s screen we linked above, and the weekly CRM report set for owners and heads of sales covers who reads what on which day. What most teams find is that they keep it up for three weeks, then stop, and the dashboard goes back to lying politely.
Where a sales layer fits
We build SalesBond, a sales management layer on top of the CRM a team already uses; we started with Pipedrive. Its Owner Dashboard shows plan attainment, forecast, gap to target, trend, revenue at risk and the team’s execution, without opening individual deals. Every material figure on it carries its period, currency, data scope and calculation method. It is shown only when the Value Layer is enabled for the account, so not every account sees it on day one. And it reads the same fields a spreadsheet would, so if close dates are fiction, the risk tile fills up and the forecast wobbles until the dates are fixed in the CRM. If you want to see what your own data looks like on these tiles, check your CRM with SalesBond.
A weekly ten-minute owner read
Here’s how we read the screen on a Monday, in order, and what each step is meant to settle.
Start with plan attainment and the gap, together. The attainment number alone invites a mood. The gap next to it turns the mood into a quantity. Then the forecast: does won plus forecast cover the target? If yes you’re reading for risk. If no, you’re reading for where the shortfall comes from, and the rest of the read changes.
Then the trend. Three or four weekly points are enough to tell whether the gap is closing as fast as the calendar needs. A gap that shrinks slowly is a different conversation from one that sat flat for a month.
Then revenue at risk. This is the one place an owner gets to look at individual deals, because the tile has already picked them. Two or three deals usually hold most of the money. Ask about those and nothing else.
Finish with execution. If the forecast is short and execution is normal, the plan was too big or the market moved, and that’s a conversation with yourself. If the forecast is short and execution has dropped, that is a conversation with the head of sales. You now have the number to open it with.
Ten minutes, one or two questions sent, screen closed. When the read keeps running longer, the dashboard has grown a report inside it. Cut it back this week, before you add anything else.
FAQ
How many KPIs should an owner’s dashboard have?
Six, in our view. Six tiles close the three questions an owner actually has, and anything past that starts answering the manager’s questions. The usual advice to keep it to a small handful is right; the mistake is picking them from a generic list instead of from the three questions.
What are some key KPIs for sales?
For an owner: plan attainment, forecast, gap to target and revenue at risk, because together they say where you are, where you will land and what could go wrong. For a head of sales, add execution per rep and the two hygiene lists (past close dates, deals with no next activity).
Spreadsheet, BI tool, or a sales layer on the CRM?
Start with a spreadsheet. It costs nothing, and building it shows you which CRM fields are actually filled. It breaks on the trend, because someone has to record the numbers every week, and on risk, because someone has to run the rule. A BI tool fixes the recording and the layout but not the fields underneath. A sales layer that reads the CRM directly takes over the recording and the rule, and still needs the same fields filled. Pick the one that fixes the failure you have now.
Who maintains it?
The head of sales owns the fields and the rule for “at risk”. The owner owns the target and the period. Nobody should own “the dashboard” as a job: once a person owns it, its upkeep becomes a report they produce for you, and you’re back to reading reports. If keeping it honest takes more than the weekly ten-minute check, the fix belongs in the CRM.