
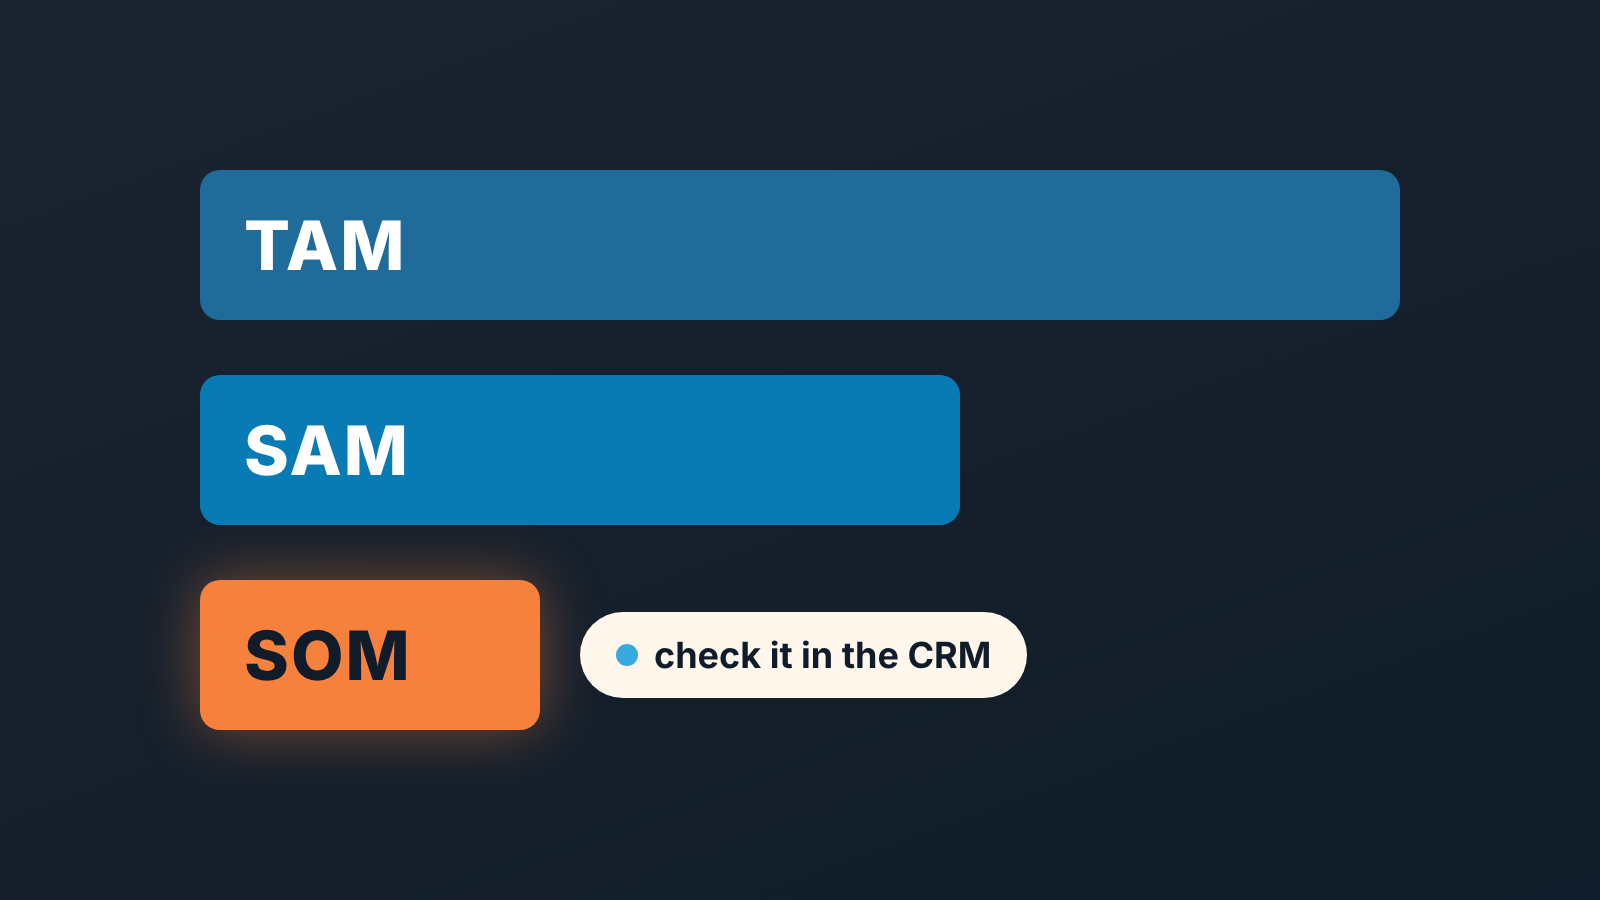
TAM is the total demand for what you sell, SAM is the part of it you can actually serve and reach with your product, and SOM is the part you can realistically win in the next year or two. For a small company the third number is the only one that changes what you do on Monday, and it is also the only one you can test: compare it with the revenue and the number of deals your team already closes in the CRM.
The three acronyms come from the investor world. Corporate Finance Institute defines TAM as the overall revenue opportunity for a product or service given a 100% market share, and expands SAM as Serviceable Available Market and SOM as Serviceable Obtainable Market (CFI: Total Addressable Market). Vendr’s guide says SOM “zooms in on your company’s immediate market focus, short-term plan, and initial offerings” (Vendr: TAM, SAM, and SOM). Both guides are written to make a pitch deck credible. This one is for a sales manager who has no pitch deck, has a CRM, and wants to know whether next year’s target is a plan or a wish.
TAM, SAM and SOM in three lines
All the numbers in this article belong to one made-up company, used for illustration only: a firm with six sellers that sells an annual outsourced bookkeeping package to independent dental practices.
TAM. Everyone who could buy a product like yours, anywhere, at your price, if nothing stood in the way. For the bookkeeping firm, that is every independent dental practice in the country.
SAM. The slice of TAM your product fits and your team can reach. Vendr’s reasoning is practical: you can’t market to all of your TAM because of logistics, geography, competitors and similar limits (Vendr). For our firm that means practices in the one metro region its account managers cover, with the patient volume and software setup it knows how to handle.
SOM. The part of SAM you will actually close in a defined period, given the sellers you have, the competitors already in those accounts and your current win rate. Closed-won here means deals marked won in the CRM; win rate is the share of qualified deals that end up closed-won. SOM is the number a small company should argue about; TAM and SAM are context for it.
One habit saves a lot of grief. Write all three as revenue per year, in the same currency, for the same period. A TAM in “number of practices” next to a SOM in “dollars per quarter” can’t be compared with anything, least of all with the CRM.
Top-down and bottom-up are two different questions
Top-down narrows an industry figure down to your segment; bottom-up multiplies the accounts you can name by your average deal. Both end in a SOM, and they rarely end in the same one.
CFI describes top-down as a process of elimination: start from a large population of known size and narrow it to your segment, drawn as an inverted pyramid (CFI). Every cut on the way down is a percentage you chose. Done honestly it answers “how big is the pond”. Done lazily, it is three guesses multiplied together. Where the industry figure itself comes from, and how to scale a national number down to your region, is covered in the market size section of our market share guide. Keep the two ideas apart, though. Market share is closed-won divided by market size, a look back at what you took. SOM is how much of the market you can take next.
Bottom-up starts from your own numbers. CFI calls it a reliable method because it relies on primary research and existing data about pricing and usage (CFI). For a small company the inputs aren’t research at all. They are a list of target accounts you can name and an average deal size you can read off closed-won deals in the CRM. Bottom-up answers “how much can we take out of the pond with the boats we have”.
We think a small team should do both, in that order, and expect them to disagree. The top-down number tells you whether the market is worth being in. The bottom-up number tells you what to put in the plan. When the bottom-up SOM comes out at 40% of the top-down SOM, the spreadsheet is fine. Its the gap between what the market would allow and what your team can execute, and the useful conversation starts there.
A TAM, SAM, SOM example with made-up numbers
Everything in this section is illustrative. The numbers are chosen to make the arithmetic easy and come from no report.
Our bookkeeping firm charges an average of 12,000 a year per practice and sells in one metro region.
Top-down first. Suppose an industry source puts annual spend on outsourced bookkeeping by independent dental practices in the whole country at 2 billion. That is the TAM. Say 6% of those practices are in your region, which gives a SAM of 120 million. You then decide a company your size could hold 2% of that in three years: a top-down SOM of 2.4 million a year.
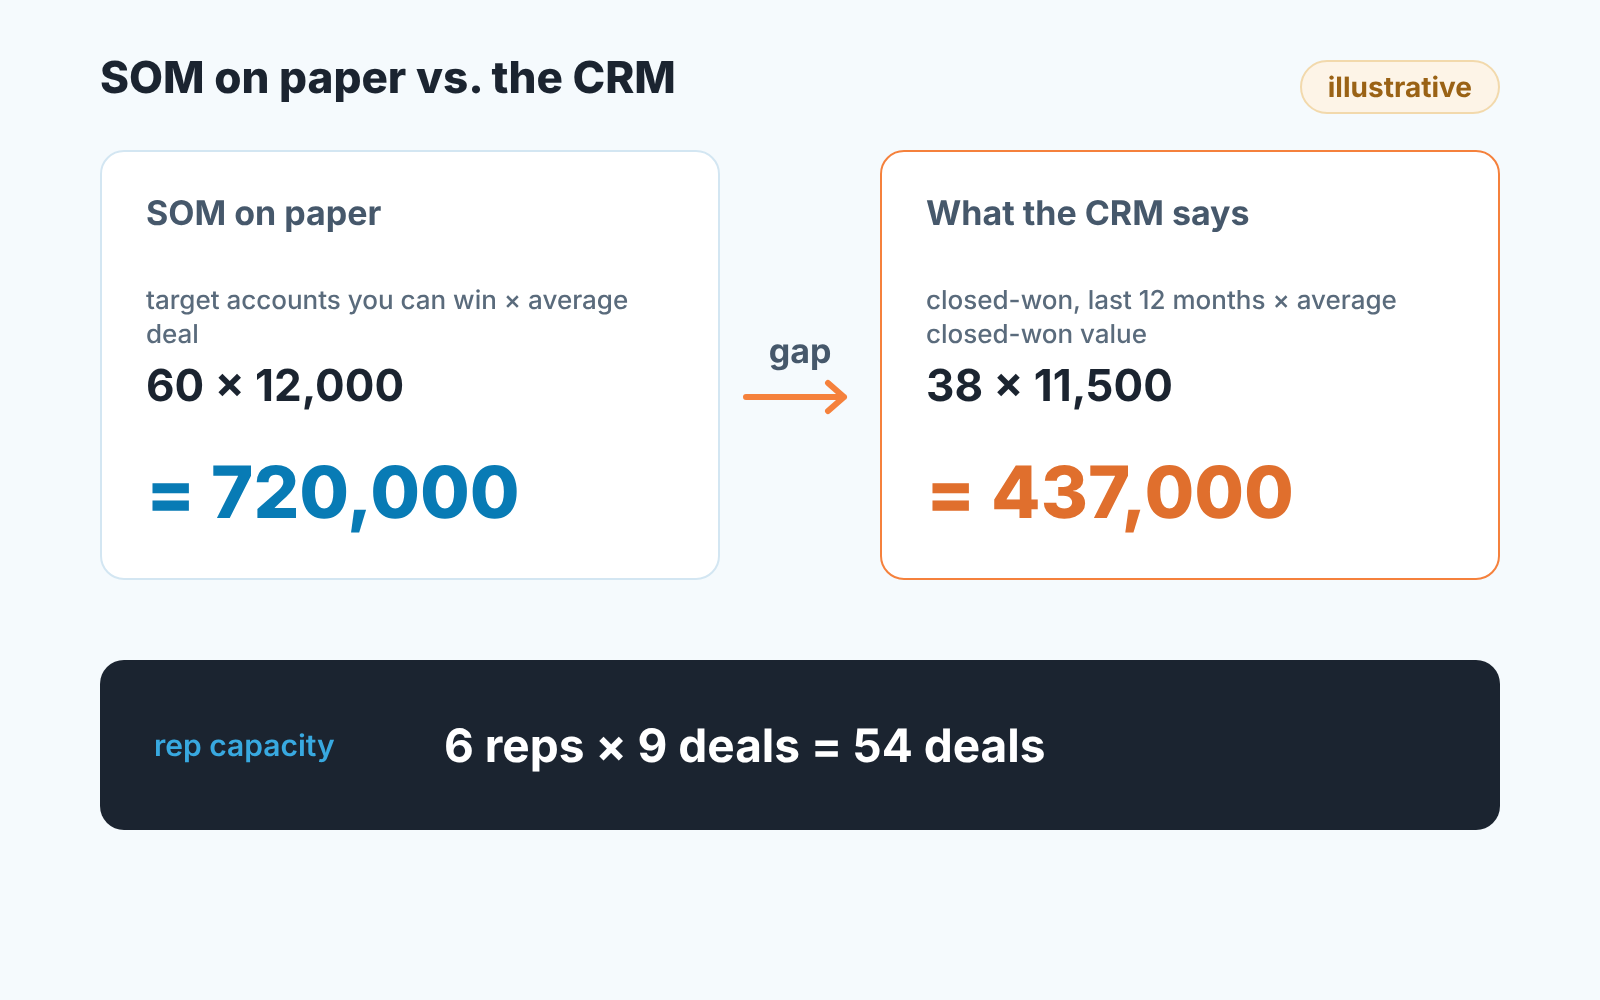
Bottom-up. Your team builds a list and finds 900 practices in the region that match the size and software profile you actually work with. 900 × 12,000 = 10.8 million. That is your bottom-up SAM, and it is already much smaller than the top-down one, because the industry figure included practices you would never take on. Of those 900, you believe you can win 60 contracts over the next year at your historical win rate: 60 × 12,000 = 720,000. That is the bottom-up SOM.
Now you have two SOMs, 2.4 million and 720,000. The spread is more than three to one. Neither is wrong yet.
Check SOM against closed-won in your CRM
The CRM can’t tell you how big the market is. It can tell you, quite precisely, how much of it you took last year and with how many people. That is the test a SOM has to pass before it becomes a target.
-
Pull closed-won for the last 12 months. Filter deals by status won, close date in the last twelve months, in the segment you defined as SAM. Count them and sum the value. Write down both numbers. In the example: 38 deals, 437,000 in total.
Only eight months of history in the CRM? You can still do the check. Annualize the closed-won total (eight months of value divided by eight, times twelve) and say so in the plan. The average deal and deals per seller are usable as they are. What eight months won’t show is seasonality, so treat the annualized figure as a rough estimate.
-
Compute the actual average deal. Total value divided by count. Here 437,000 / 38 ≈ 11,500. If this differs a lot from the average you used in the bottom-up SOM, replace yours. The CRM number is what customers actually paid; the other one is what you hoped they would pay.
-
Compute capacity. 38 deals across six sellers is a bit over six each. If the SOM assumes 60 deals, every seller has to close ten. Say the team agrees nine each is a real stretch: that is 54 deals, still short of 60. Ask whether the last six are a plan or a fantasy. There’s a longer treatment of this step in how a small team plans sales capacity.
-
Compare the three numbers. Last year’s closed-won (437,000), the bottom-up SOM (720,000) and the top-down SOM (2.4 million). The honest SOM for the plan sits between the first two, and reaches the second only if something concrete changes: a seventh seller, a shorter cycle, a higher win rate you can point to in the pipeline and not in a slide.
-
Save the report. Give the filter a name, something like “Closed-won, SAM segment, trailing 12 months”, and leave it in the CRM. The point of SOM is to re-run the same check each quarter against the same definition, and a saved filter lets next year’s plan reproduce this year’s number. The check is only as good as the won deals behind it; SalesBond’s free CRM audit reads the last 30 days of the CRM and sends a PDF report with a CRM score and the top findings.
When the SOM and the CRM disagree
They will. The question is which way.
SOM far above closed-won is the common case, and our example is one: 720,000 against 437,000. Most of the time the SOM was built from a target list and a hoped-for win rate, while the CRM reflects the win rate you actually have. Before cutting the SOM, look at three places in the CRM. Open pipeline in the SAM segment: with 1.5 million of open, qualified pipeline a 720,000 SOM is plausible. Lost deals and their reasons: if half the losses say “went with incumbent”, the market is there, but your SAM should exclude accounts locked into a contract for the next two years. Deal count per seller: if every seller is already at capacity, the SOM is really a hiring plan.
SOM below closed-won is rarer and more interesting. It means the team is already selling outside the SAM you wrote down, which is usually good news hidden in a definition problem. Sort last year’s won deals by industry, company size or region and look for the cluster your SAM left out. Then redraw the SAM, and do that once a year anyway.
Is the SOM your sales target, then? We’d say no. It is the ceiling for the target. SOM is what the market and your capacity allow in the period; the target is what you commit to inside it, usually somewhat below, so the plan survives two sellers having a bad quarter.
Averaging the two numbers and moving on is the one move to avoid, because a SOM of “somewhere around a million” can’t be checked against any report. Pick the number you can defend with a saved CRM report and a named list of accounts, put it in the plan, and decide now on which dates you will re-run that report. For a small team the natural rhythm is quarterly, and sales planning with quarterly checkpoints in the CRM shows how to set those dates up so the the SOM gets tested before the year is half gone.


