
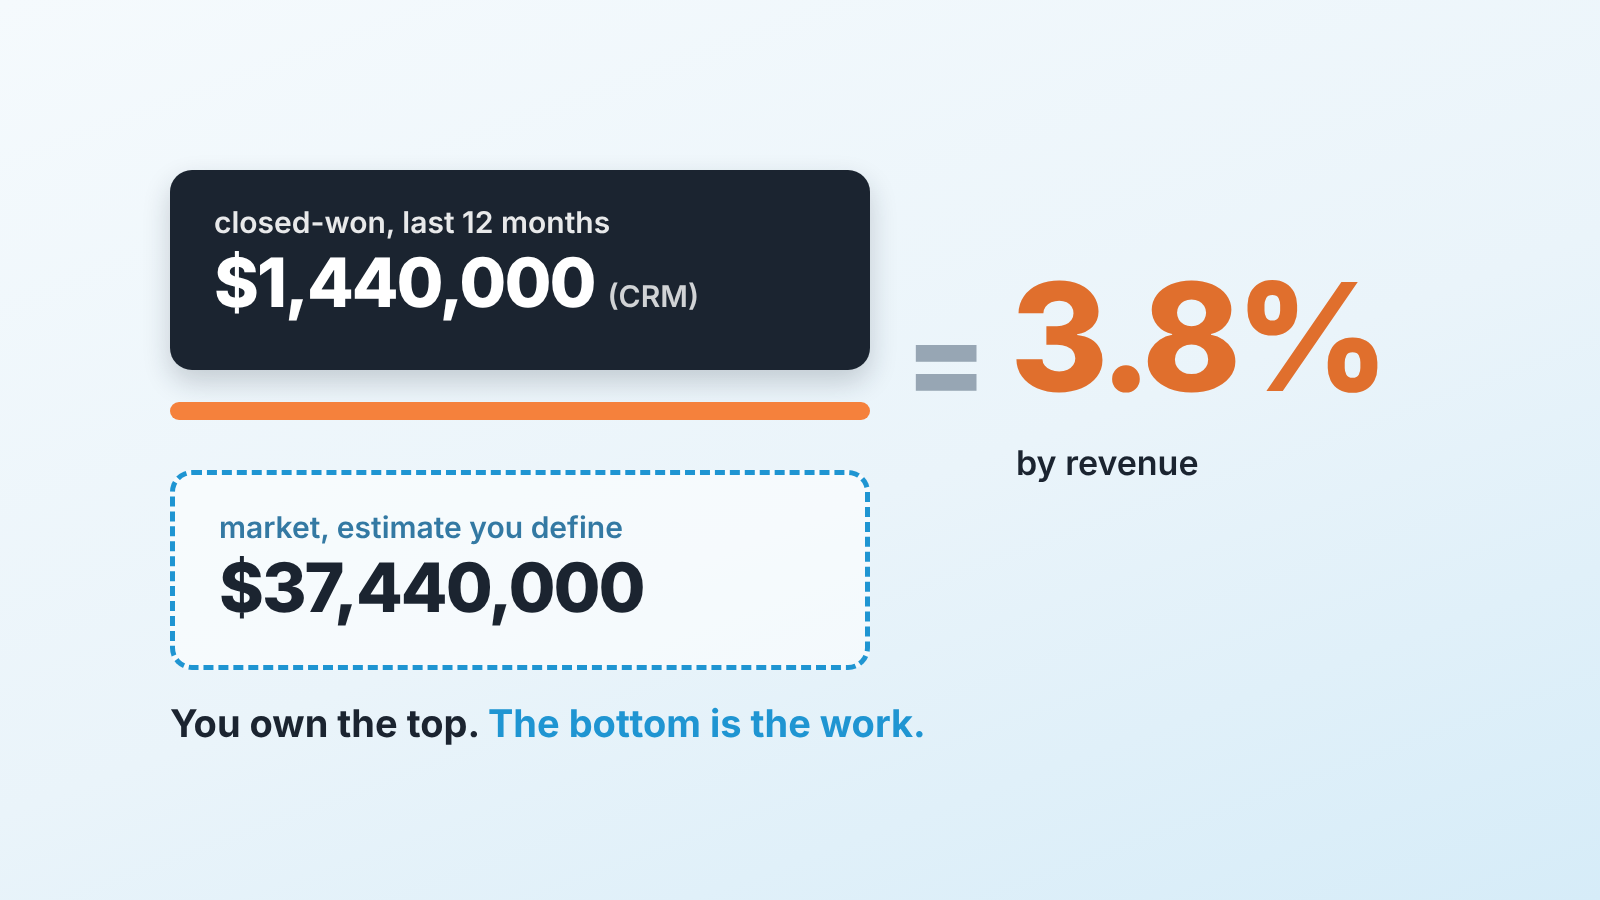
Market share is your sales divided by the total sales of your market over the same period, multiplied by 100: market share = your sales ÷ total market sales × 100. If you sold $1,440,000 in a market worth $37,440,000, your share is 3.8%.
For a small company the top of the fraction is the closed-won total in your CRM; the bottom is an estimate you have to source and define yourself, for example from an industry report or from the number of target companies times what a typical customer spends with you in a year. The CRM gives you the numerator today, in one report. It knows nothing about the denominator, and that is where owners get the number wrong.
Market share calculation: a worked example
All figures below are illustrative. They are not customer data and not benchmarks.
A company sells facility maintenance contracts to mid-size manufacturers in one region. The owner runs the closed-won report for the last twelve months, filtered to that segment and one currency, then sizes the market by counting the manufacturers that fit, estimating how many of them buy outside maintenance in a year, and multiplying by the median won deal. This is the target-companies method, one of the three covered below.
| Line | Figure | Where it comes from |
|---|---|---|
| Won deals, last 12 months | 48 | closed-won report, count |
| Closed-won revenue | $1,440,000 | closed-won report, sum |
| Average won deal | $30,000 | $1,440,000 ÷ 48 |
| Median won deal | $26,000 | four contracts above $60,000 pull the average up |
| Manufacturers in the region that fit the definition | 1,600 | the owner’s count |
| Share of them that buy outside maintenance | 90%, so 1,440 companies | the owner’s assumption |
| Estimated market | $37,440,000 | 1,600 × 0.9 × $26,000 |
| Revenue share | 3.8% | $1,440,000 ÷ $37,440,000 × 100 |
| Deal-count share | 3.3% | 48 ÷ 1,440 × 100, assuming one contract per company a year |
Each share carries a known bias. The denominator assumes 90% of the fitting companies buy every year, which is generous, so the market figure leans high and the real share is probably a little higher. The two figures disagree because the company’s average deal ($30,000) is bigger than the median deal the market estimate was built on ($26,000). Next year the owner repeats the same filter, count and assumption, and the movement in the ratio is the real information.
How to increase market share, and the formula for the change
The change in market share is usually reported two ways. The simple one is percentage points: new share minus old share. The other is relative change, and it’s what “market share increase formula” usually means: relative change = (new share − old share) ÷ old share × 100.
Say the company above moves from 3.8% to 4.5% next year against the same $37,440,000 estimate. That is 0.7 percentage points, and a relative increase of (4.5 − 3.8) ÷ 3.8 × 100 = 18.4%. Write both on the page, because 0.7 points sounds small and 18.4% sounds large, and they describe the same year.
To set a target, run the formula backwards. Required closed-won = target share × market size. A 5% share of $37,440,000 is $1,872,000, which is $432,000 more than this year, or roughly 14 to 15 more deals at the $30,000 average. Now the target is a sales number the team can plan against.
The formula leaves four levers, and each one shows up in a different line of the table above.
- Win more of the buyers the team already reaches. Win rate on the defined segment feeds deal-count share directly, so filter the win-rate report to the same segment the market was sized on.
- Reach more of the target companies. If reps only work a few hundred of the 1,440 buyers in a year, the rest never get the chance to become a closed-won line, and the target list is the place to start.
- Win bigger contracts from the customers you have. Revenue share rises while count share stays flat, and the gap between the average and the median deal widens.
- Grow faster than the market. The denominator moves every year as well, so compare your closed-won growth with the growth of the market estimate before reading anything into the share.
Redefining the market moves the share as well. That is a change of method, and it belongs in the footnote.
What counts as “sales” and as “the market”
The textbook recipe assumes someone has already measured your market. LinkedIn’s explainer says your total sales come from your financial reports, and total industry sales come from industry reports, market research firms or trade associations (LinkedIn Marketing: Market Share). That works for a soft drink brand. If you run a 12-person company selling HVAC maintenance contracts in two states, nobody publishes your market, and TAM, SAM and SOM for a small company shows how to estimate it.
“Total sales” has to mean the same thing on the top and the bottom of the market share formula. If the market figure is revenue, yours is closed-won revenue. If it is contracts signed, yours is closed-won deal count. Wikipedia treats these as two different measures, revenue market share and unit market share (Wikipedia: Market share), and the example above shows both. Wall Street Prep describes two more that are worth adding once these are stable, relative market share (yours divided by the top competitor’s) and forecasting revenue from an expected share (Wall Street Prep: Market Share).
“Market” is the part you define: the companies you sell to, in the places you sell, buying the thing you sell. Narrow it until you could list the competitors by name. If company size, region and industry are on the organization record, the boundaries are already there (customer segmentation for B2B).
Your number: closed-won in a period, from CRM
This is the easy half, and it takes ten minutes. In any CRM it is one filtered report of deals, and the filter is the same everywhere:
- Status: won. Open, lost and “verbal yes” deals stay out. If a deal is won in your CRM, it counts; if it is still in the last stage, it does not.
- Won date inside the period. Use the date the deal was marked won. Ignore the create date and the expected close date. The period is the one your market figure covers, usually a calendar year or trailing twelve months.
- One currency. If the team sells in two, convert before summing or the total has no meaning.
- Only the deals that belong to the market you defined. If your market is “mid-size manufacturers in the Midwest”, exclude the two hospitals and the deal in Toronto. A custom field for segment makes this a one-click filter next year.
Read two values from that report: the sum of deal value and the count of deals. Write both down. The sum is for revenue share, the count for deal-count share, and the pair gives the average deal; add the median from the same report, since the target-companies method below works from a typical deal size. If the sum surprises you, check the month-over-month view first; a dirty won list shows up there as a spike with no explanation (sales growth rate from closed-won).
One caution. Closed-won is bookings: contracts signed in the period. If the industry report behind your denominator is recognised revenue, the two will not match, and for multi-year contracts the gap can be large. Decide which one you are measuring and label it (revenue vs profit, and where each lives in the CRM).
Market size: three ways to estimate the number you don’t have
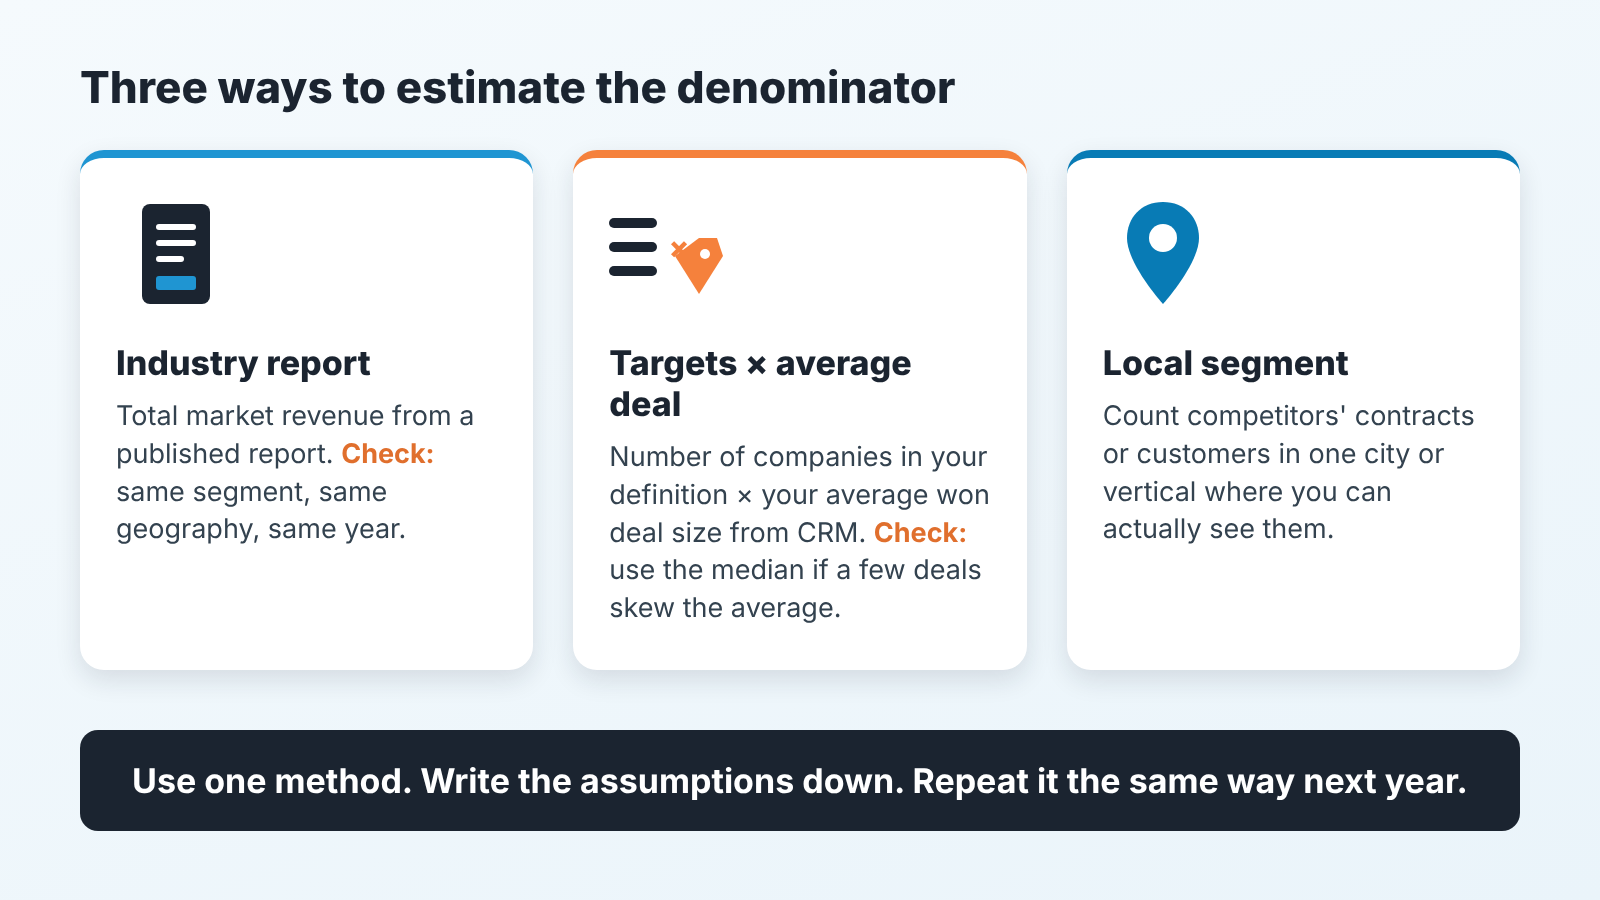
The CRM cannot help here. Appinio’s guide lists surveys, market research and industry reports as the tools for this, and admits that accurate market data is hard to get: figures are incomplete or outdated, and sources disagree with each other (Appinio: Market Share). For a small company there are three workable sources, in the order we trust them.
An industry report. Trade associations, analyst firms and government statistics publish market size by sector, sometimes by region. This is the best denominator when it exists at your level of detail. The check before you use it: do the report’s segment, geography and year match your closed-won filter? A national figure for “commercial HVAC services” is not your market if you sell maintenance contracts in two states. If you have to scale it down, write that assumption next to the number.
Target companies × typical deal size. Count the companies that fit your definition; a data vendor, a chamber of commerce or a registry will do, and the count needs to be defensible rather than exact. Multiply by what one of them spends with a supplier like you in a year. Your closed-won report just gave you the average won deal. If a couple of large contracts distort it, the median is safer (why the median deal size tells you more). Then estimate what share of the targets buys in a year; the example uses 90%, and counting all of them as buyers would overstate the market further, so treat the result as a ceiling.
A local segment you can see. In one city or one vertical you can often count competitors’ customers directly: public tenders, permits, the logos on their websites. The share you get is for that segment only, and it’s fine as long as the report to the owner says so.
Pick one method and keep it. A share that goes from 3% to 5% because you switched from an industry report to a target-count estimate measures the switch of method, while sales stayed where they were.
Four ways to fool yourself with market share
Most of the usual mistakes happen in the setup, before any division.
The market is defined too wide. “The US facility management market” makes any small company’s share round to zero, which feels humble and is useless. It also hides real progress: going from 2% to 6% of the region you sell in is a different business, and a national figure will never show it.
The periods do not match. The industry report covers last calendar year; the closed-won filter is the trailing twelve months ending today. In a growing business that alone can move the share noticeably. Line the dates up, or state the mismatch.
Revenue on one line, units on the other. A report counts contracts, you sum dollars. The ratio has no meaning. Convert one side, or use the method where you control both numbers.
The denominator comes from a pitch deck. The TAM (total addressable market) slide that got the company funded was built to be big. It is not a measurement of your market and it was never meant to be one. If the owner’s share figure is 0.4% of a number from an old investor presentation, rebuild the denominator before anyone acts on the share.
Revenue share or deal-count share: which one to report
Report both, and lead with the one that matches how the owner thinks about the business.
Revenue share answers “how much of the money in this market comes to us”. It is the figure a buyer, a bank or a board expects, and what most textbook definitions mean by default. It is also the one a single large contract can move by a point in either direction.
Deal-count share answers “of the companies that bought this year, how many bought from us”. It is steadier, it connects to your win rate and to how many targets you touched, and it is the better number for a sales team because the team controls the count more than the size (what win rate measures and what it does not).
What would 30% mean? By revenue, 30 of every 100 dollars spent in your market come to you; by deal count, 30 of every 100 buyers bought from you. For a small company a figure like that is real only in a narrowly defined market: one city, one vertical, one type of contract. If you get 30% of a broad market, check the denominator before you celebrate.
When the two shares diverge, that is a finding. Revenue share rising while count share is flat means the extra money comes from bigger customers while the number of customers stays put, and the concentration behind that deserves its own look (customer concentration risk). Count share rising while revenue share is flat means you are winning the small end of the market. Either can be a sound strategy, and reporting both shares each quarter shows which one the team is actually running.
What to put in front of the owner each quarter
One page, the same page every quarter. At the top: the market definition in one sentence, the denominator method, and the assumptions as a short list. Then the numbers: closed-won revenue, closed-won count, estimated market, and the two shares, with last quarter’s figures beside them, calculated the same way.
Below that two lines of commentary at most. What moved and why you think so. Whether the denominator was re-estimated, and if it was, the share under the old estimate as well, so the trend does not break.
Leave off the page a share of a national market, a share with no period, or any share where the method changed without saying so. A rough number is fine as long as it is measured the same way each quarter, and a change of method gets its own line on the page.
If you have never done this, start with the half you already own. Run the closed-won report with the four filters above for the last twelve months and write down the sum, the count and the median deal. Then spend one afternoon on the denominator: pick one method, write the definition and every assumption on one page, and file it where next quarter’s you will find it. If you want to know first how clean the won deals in your CRM are, SalesBond’s free CRM audit reads the last 30 days of your CRM and sends a PDF report on what it finds.


