
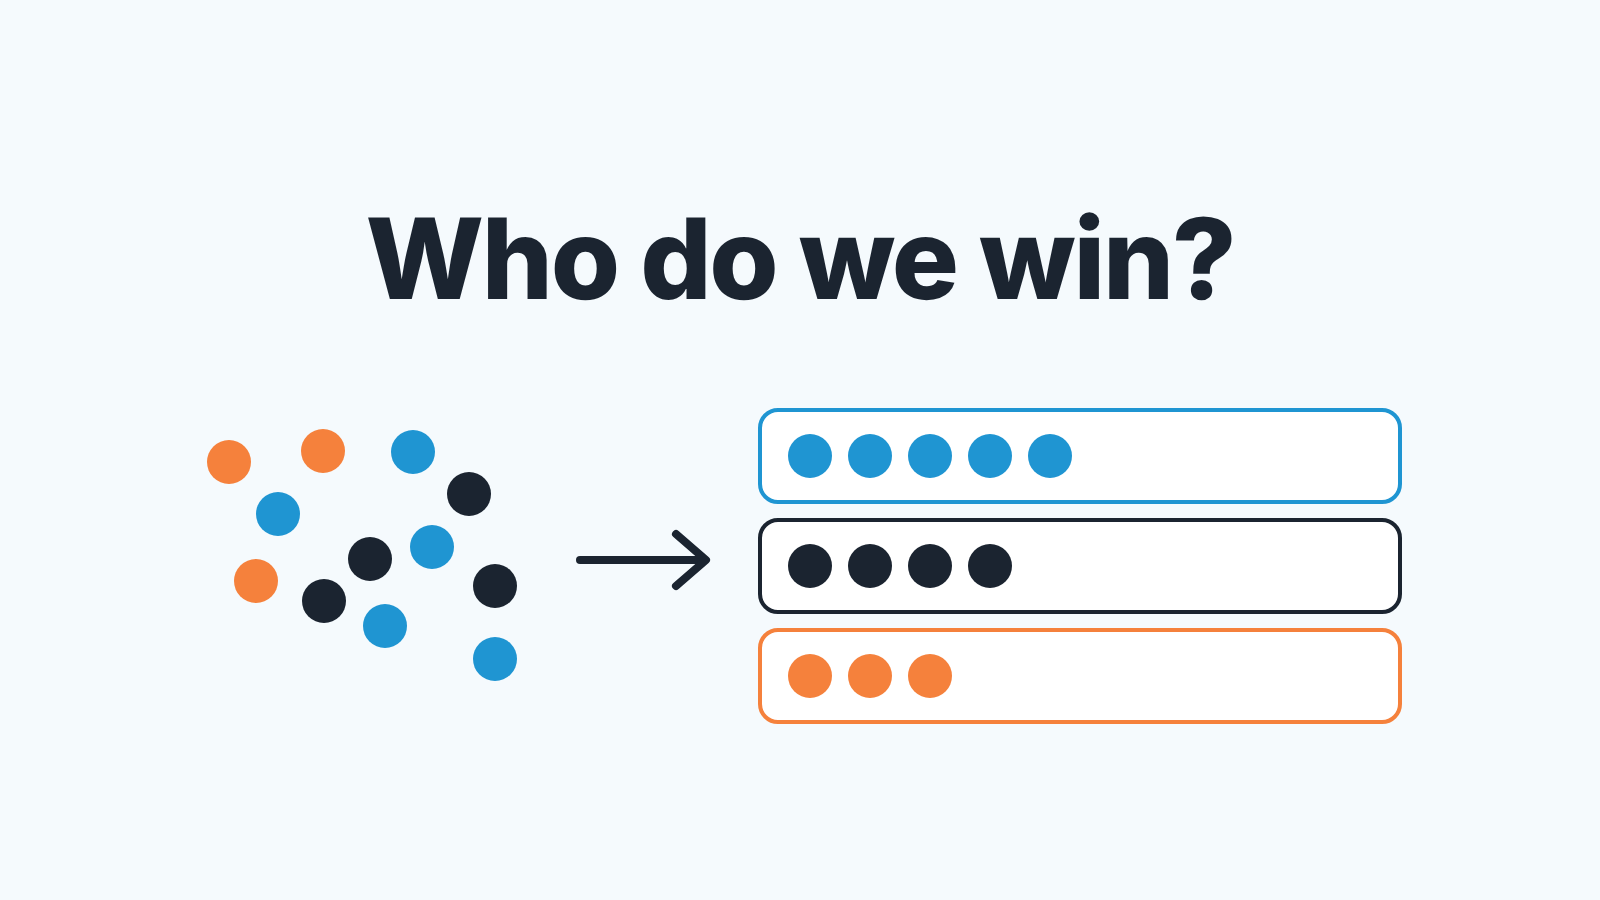
Customer segmentation is grouping customers by the traits they share so that each group can be sold to and measured on its own; for a small B2B sales team it means giving every company one value for size, industry and tier, then reading pipeline and win rate by those values. In HubSpot that is three company properties, one active segment (HubSpot’s current name for lists) per group you report on, and one custom report. A rep fills the three dropdowns in ten seconds, and the report shows the owner where the team really wins, with no CDP and no marketer involved.
What customer segmentation means when you sell B2B with a small team
Most guides to customer segmentation are written for marketers deciding who gets which email. A five-person sales team asks something else: which kind of company do we close, how fast, and at what size?
B2B guides usually list firmographic, technographic, intent and behavioral segmentation, plus tiering against an ideal customer profile. Size and industry are firmographic segmentation; tier is tiering. We skip the rest on purpose: technographic and intent data come from paid enrichment, behavioral data wants a CDP, and a small team has neither.
So our definition is narrower. A segment is a group of companies that behaves the same way in your pipeline: similar cycle, similar win rate. If two groups behave the same, they are one segment, however different they look on paper. You need the answer for real calls, like whose territory the next hire gets, and that needs the segment on the company record, in a field a report can group by.
Pick three firmographic fields: size, industry, tier
Three fields. We have tried five and seven; the extras go stale inside a quarter because nobody needs them to close a deal.
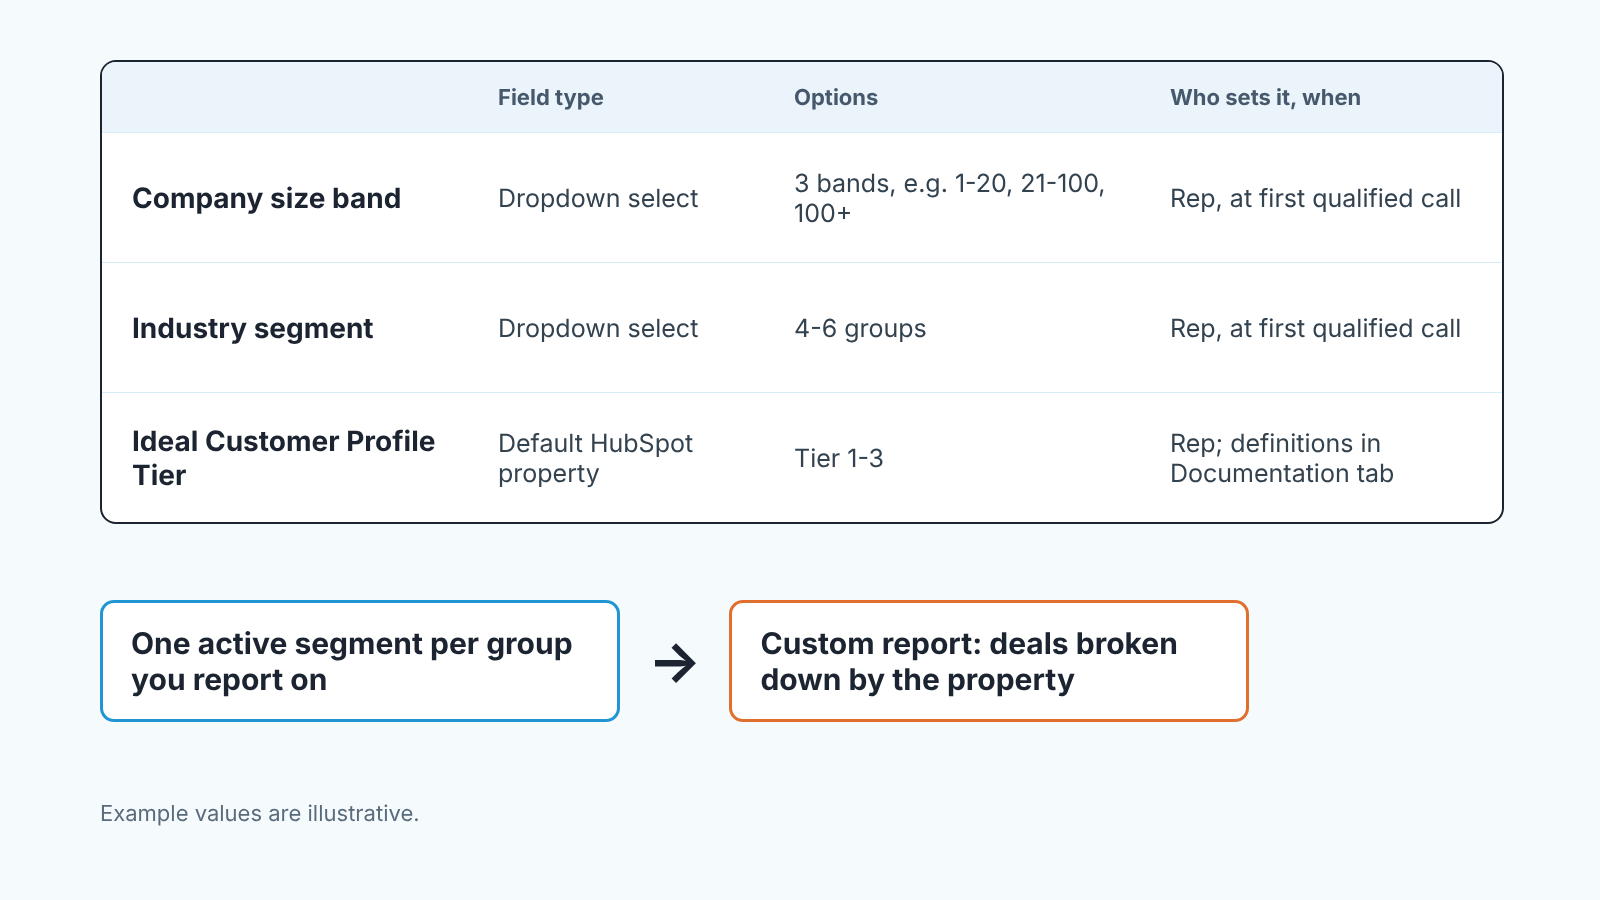
Size. HubSpot’s default Number of employees property is the “total number of people who work for the company” (HubSpot: default company properties). A report broken down by it gives you one row per headcount, so you want a band. Three bands is enough; put the breakpoints where your sale changes shape, say where procurement shows up.
Industry. The default Industry property has approximately 150 pre-defined options that can’t be deleted, though you can add your own (same page). A rep facing 150 choices picks the nearest one, and one kind of customer ends up spread over three rows. Group on a short custom list of four to six industries that match how you sell. HubSpot already has a default property called Industry group (the second tier of its own classification), so give yours a different name.
Tier. This one exists. Ideal Customer Profile Tier rates how closely a company matches your ideal customer profile, with Tier 1 the closest, and HubSpot says it is populated by you and your users (same page). Use it as is: three tiers, a one-line written definition for each, and one rule. The rep sets it at the first qualified conversation.
Skip region unless you sell in more than one legal market, and skip anything merely nice to know. Purchase behavior is a different kind of segment, and RFM analysis handles it by comparing recency with each customer’s buying cycle. Once the three firmographic fields are filled in, they also let you estimate your market share segment by segment.
Create the three company properties in HubSpot
One of the three already exists, so you create two (HubSpot: create and edit properties):
- Click the settings icon in the top navigation bar, then go to Properties in the left sidebar.
- In the Select an object dropdown, choose Company properties, then click Create property.
- Click Edit more options and set the label: we use
Company size bandfor the first andIndustry segmentfor the second. - On the Field type tab, pick Dropdown select, add the options and save.
Leave both without a default value. An empty field you can filter for is honest; a default is a guess that looks like data.
For Ideal Customer Profile Tier, open the existing property and put your three definitions in its Documentation tab, so they live on the property and not in a doc nobody opens.
Then the part that isn’t in HubSpot: half an hour where the the team fills the three fields on the companies attached to open deals and to deals closed this year. A report on half-filled fields teaches the wrong lesson.
Build one active segment in HubSpot per group you report on
HubSpot renamed lists. The tool is now Segments, “previously called lists”, and it is available on all products and plans, which matters for a team on Starter (HubSpot: create segments).
Go to CRM > Segments (under More if your account shows it), click Create segment, select Manually, choose Companies as the object and click Next. Make it an active segment. An active one updates its members automatically; a static segment built last March looks fine and is quietly stale.
Add a filter on the company property, say Ideal Customer Profile Tier is Tier 1, and save. Repeat for each group you will actually read: three sizes by five industries by three tiers is 45 segments, and nobody looks at 45. We keep one per tier, one per industry segment, and a couple of combined ones that answer a real question (“Tier 1 companies in the two industries we’re hiring for”). A segment can hold up to 250 filters, so the limit is attention.
On its own a segment only gives you a company count, so the win rate needs a report.
The report: pipeline, win rate and cycle length by segment
Win rate by segment in HubSpot comes from a custom report: deals as the primary data source, companies as a secondary one, and the segment property as the dimension. The pre-built sales analytics reports can’t: their Group by splits records only by owner or owner’s team (HubSpot: sales analytics reports). The custom report builder needs a Professional or Enterprise subscription.
Open Reporting > Reports, click the down arrow next to Create report and select Custom report (HubSpot: custom report builder). Tick Deals first (the first checkbox becomes the primary source), then Companies, and drag properties from both into the report: dimensions go on the X-axis or into Break down by, measures take an aggregation such as Distinct count, Sum or Average (HubSpot: understand the custom report builder). The report we keep:
- X-axis: the company’s
Ideal Customer Profile Tier(orIndustry segment, in a copy of the report). - Break down by:
Deal stage, filtered to Closed won and Closed lost, with Close date set to the last two quarters. - Measures: Distinct count of deals and Sum of Amount.
One caveat from the same page: with several sources, a record can be counted once per association, so a deal tied to two companies can land in two rows.
HubSpot counts and sums; dividing won by closed is on you. Doing it by count and by amount, and why the two disagree, is in our piece on win rate in HubSpot. Swap the measures for Average of Days to close, the time between create date and close date (HubSpot: default deal properties), and the same report gives you cycle length by segment. For stage-to-stage conversion, the funnel report read works with the segment as a filter.
An illustrative reading, with made-up numbers: Tier 1 closes 6 of 20, Tier 2 closes 9 of 15, Tier 3 closes 4 of 30. The team believes Tier 1 is where it wins. The table says Tier 2 wins twice as often (60% against 30%) and probably deserves the next hire’s territory. If a segment doesn’t change a decision like that one, its not worth keeping.
When two segments behave the same, merge them
Here’s the result nobody plans for. You build five industry segments, run the report for two quarters, and three of them close at about the same rate, in about the same number of days. The team swears those industries are different. The pipeline says they aren’t.
Merge them. A segment that predicts nothing is just a label that costs a rep a decision on every company record. Rename one dropdown option to something that covers all three, move the other companies over (a static segment of the old members, then a bulk edit, is the fastest way we know) and run the report again next quarter with three rows instead of five. It works in reverse too: when one industry hides two very different win rates, split it, but only after the gap holds for a second quarter. A handful of deals will tell you any story you want.
We would rather have three segments the team believes than eight that look thorough.
A monthly check the owner can run in 15 minutes
Once a month with the reports open:
- Blanks first. Filter companies with open deals where any of the three properties is unknown. More than a handful means the habit is slipping.
- Win rate by tier, written down next to last month’s. A deal or two of movement is noise; a tier drifting the same way for three months is a signal.
- Cycle length by industry segment. The slow row is where deals stall, and the key account plan for a Tier 1 company in that row is the next thing to open.
- One decision: which segment gets more of next month’s outbound, and which gets less.
We build SalesBond, a sales management layer on top of the CRM a team already uses. Its Deal Health module finds and explains stalling deals, which is where the slow row leads anyway. The three properties stay with the rep. If you want to see your own pipeline with those fields in place, check your CRM with SalesBond.


