

A sales plan for a small team is one page that turns a revenue target into the number of deals you have to win, the pipeline you need in order to find them, and what each rep must do. Take average deal size, win rate and sales cycle from your last 6 to 12 months of closed deals in the CRM, then work backwards from the target.
That is narrower than the usual definition. LinkedIn’s sales glossary calls a sales plan a documented strategy for hitting revenue goals, a roadmap that can cover segments, budget, training and headcount (LinkedIn Sales Solutions: Sales Plan), and the templates built on that idea have rows for strategy, tactics and positioning. Fine for a sales organization of sixty. For a team of three to eight, we think those rows hide the only question the owner will ask in March: is the number possible with the people and the pipeline we have? The plan one level up is the strategic plan for a sales team, which sets the targets this page then turns into numbers, and above both sits a vision statement for a small business owner, the short description of where the company is going.
A sales plan is a page of arithmetic, not a strategy deck
Most small-team plans we have seen fail the same way. The target is set in a meeting, someone divides it by the number of reps and the plan is “done”. Nobody checked whether the team has ever won deals at the rate that split implies.
The fix is boring. A plan is a chain of multiplications that starts with the target and ends with a per-rep number, and every link in that chain is a fact your CRM already holds. If the arithmetic does not close, the plan is wrong before the quarter begins, which is the cheapest moment to find out.
Strategy still matters: which segment to go after, which channel to stop paying for. But those are decisions you make once you can see what the current numbers produce. The strategy rows have their own one-page sales strategy template; this page is only the numbers. Put strategy in a paragraph under the table and keep the table.
Six numbers the plan needs (and where each lives in the CRM)
The six are the revenue target, average deal size, win rate, sales cycle, pipeline needed and deals per rep. The owner sets the first, closed deals in the CRM give the next three, and the last two are arithmetic. The quarter checkpoints article checks a finished plan against four of them.
- Revenue target for the period. The only number on the page that is not read from the CRM. The owner sets it, with the currency and period written next to it, because “600” means nothing a year later without “USD, Q1”.
- Average deal size. Filter won deals by close date over the last 6 to 12 months and take the mean of the deal value. If two or three outsized deals pull the mean up, use the median and say so on the page.
- Win rate. Won divided by won plus lost, by close date, over the same months, counting deals that got past your first stage so unworked leads don’t drag it down. Count deals, not value; a value-weighted win rate answers a different question. Open deals are excluded, which is why the period has to be long enough for most deals opened in it to have closed. For teams on Pipedrive, HubSpot or Salesforce we have written up where the reports keep this number: win rate in Pipedrive, in HubSpot, in Salesforce.
- Sales cycle. Days from the deal’s created date to its won date, averaged over the same won deals. This decides how much of the period’s pipeline must already exist on day one.
- Pipeline needed. Derived: deals to win divided by win rate gives deals to work; times average deal size it gives pipeline value. The multiple of target this produces is your coverage ratio, and there is a separate piece on reading a pipeline coverage ratio without fooling yourself.
- Deals per rep. Derived: deals to win and deals to work, each divided by the reps who carry a number. If the result is more than a rep has ever worked in a period, the plan needs more reps or a smaller target, and the page should say which.
All six rest on four things recorded on every deal: value, owner, the date it was created, and whether and when it was won or lost. The report is not the hard part. The hard part is that it only works if those fields were filled honestly.
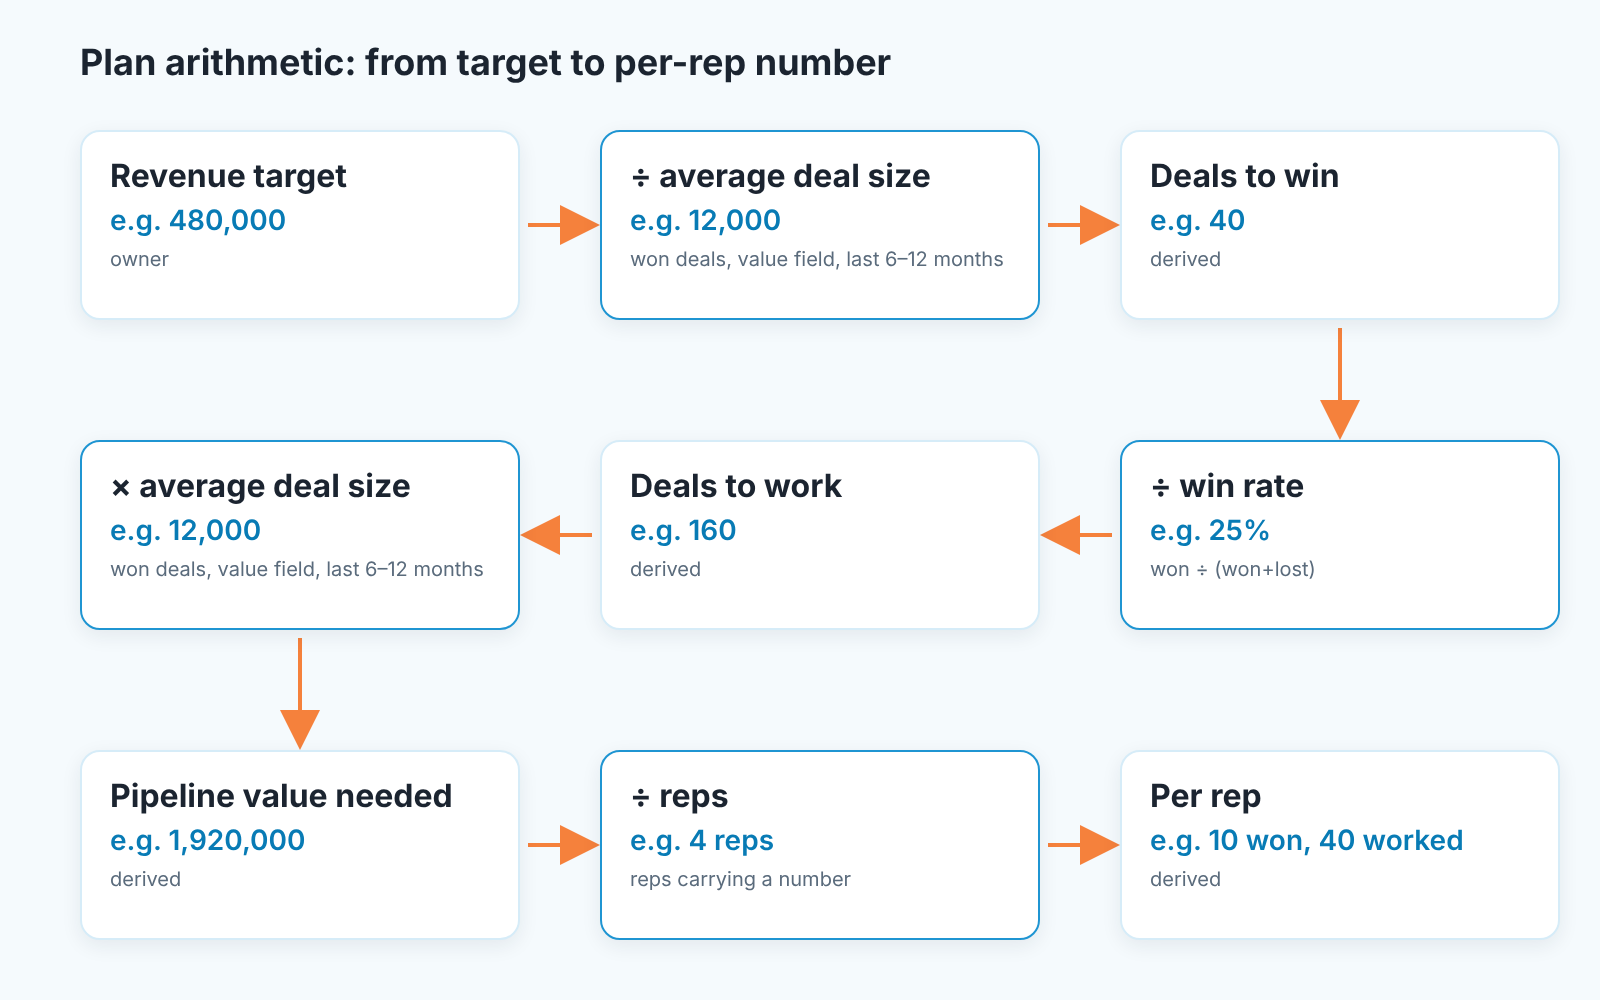
A sales plan example: from revenue target to deals and pipeline
The numbers below are invented to show the arithmetic; yours come out of the closed-deal report.
Say the owner sets a quarterly target of 480,000 (USD, Q1). Twelve months of won deals show an average deal of 12,000 and a win rate of 25 percent by count. Average cycle: 60 days. Four reps carry a number.
Target divided by average deal: 480,000 / 12,000 = 40 deals to win.
Deals to win divided by win rate: 40 / 0.25 = 160 deals to work during the quarter.
Deals to work times average deal: 160 × 12,000 = 1,920,000 of pipeline value, four times the target. You get that multiple by dividing one by your win rate.
Per rep: 10 wins and 40 worked deals.
Now the cycle. Sixty days is two thirds of a quarter, so a deal created in the second week of March will not close in Q1 at the team’s normal pace. Most of the 160 deals have to be in the CRM by the end of month one, a good share of them before the quarter starts. The page carries this as its own line: “pipeline in place by: end of month one”.
One more reading of the same example. If last year’s reps each worked 25 deals a quarter, the plan now asks for 40. Either the target comes down, more reps arrive (at 25 worked deals each, 160 deals take seven reps), or the owner decides the win rate or deal size will rise and writes down why. Any of the three is a legitimate plan, as long as the page says which one it is. If closed-won still lands under the target, a gap analysis of plan vs closed-won shows whether the gap sits in volume, deal size or win rate.
When you have fewer than 30 closed deals
New team, new product, or a CRM that was only cleaned up last spring: the closed-deal report has 14 rows and half are the founder’s. Our position is that below roughly 30 closed deals a computed win rate is noise. One deal moves it several points.
Do not invent a number to fill the box.
Take the longer period first. Twelve months instead of six; if the CRM goes back further and teh product has not changed, take it all. Use the median for deal size and say so, because with few deals the mean is one big contract away from doubling.
For win rate, write an assumption and mark it as one: “assumed 20%, to be replaced with the CRM figure after the first 30 closes”. Where the assumption comes from is the owner’s call. The founder’s own closes, a comparable product the team sold before, a deliberately conservative guess: all defensible as long as the word “assumed” is on the page.
For sales cycle with few won deals, look at the lost ones too. Days from created to lost tells you how long the team spends on a deal before a decision, which is the number you need to know when pipeline must exist.
Mark every assumption on the page, or it turns into a forecast somebody will later be blamed for.
Who owns which line: owner, head of sales, rep
Three people touch the page, and they should not write on the same lines.
The owner writes the target, the period and the currency, and signs off on any assumption from the previous section, because an assumed win rate is a business risk.
The head of sales owns the five computed lines and the decision about how to split them. An equal split is the default for a small team, and it is wrong more often than people expect: a rep covering a segment with a longer cycle needs a different pipeline line even when the revenue line is the same. We have gone into how to set quotas and capacity for a small team separately; the plan page needs only the result, one row per rep.
The rep owns the fields the whole page depends on. If deal values stay blank until the proposal, average deal size is wrong. If lost deals are deleted instead of marked lost, win rate is flattering fiction. So the the page gets one short line under the table: which fields must be filled on every deal, and by which stage. That line is the only part of the plan a rep can act on every day.
A disclosure, since we are on the subject: we build SalesBond, a sales management layer on top of the CRM a team already uses; we started with Pipedrive. One of its products, Sales Plan, keeps target, forecast and the gap between them together, with assumptions, period and currency stated explicitly, which is the same discipline this page asks of a spreadsheet. The spreadsheet works. What breaks is the field hygiene underneath it, whichever tool holds the page. Check your CRM with SalesBond.
The sales plan template (copy this table)
The format is one table on one page. Copy it; the right column is the example from above, to be replaced.
| Line | Source | Example (illustrative) |
|---|---|---|
| Revenue target | Owner; period and currency stated | 480,000 USD, Q1 |
| Average deal size | Won deals, last 6–12 months, deal value (mean or median, stated) | 12,000 (mean) |
| Win rate | Won ÷ (won + lost), by close date, same period | 25% by count |
| Sales cycle | Created date to won date, same won deals | 60 days |
| Deals to win | Target ÷ average deal | 40 |
| Deals to work | Deals to win ÷ win rate | 160 |
| Pipeline value needed | Deals to work × average deal | 1,920,000 (4× target) |
| Pipeline in place by | Period length minus sales cycle | End of month one |
| Per rep: wins / worked | Each line ÷ reps carrying a number | 10 / 40 (4 reps) |
| Assumptions | Any line not read from the CRM, with a date to replace it | none (12 months of data) |
| Fields filled on every deal | Value, owner, created date, won/lost with date | by stage two |
Below the table, one paragraph of strategy if you have one. Below that, nothing. If the page runs onto a second sheet, something on it is not a number and should probably be a conversation instead. The forecast side is a different list of fields, laid out in our sales forecast template built on CRM fields.
The plan is written. Now what?
After the plan is written, nothing changes for about four weeks. The plan’s job on day one is to say what “enough pipeline” means as a number, and that number is first tested once a month of deals has had time to exist. How to read the plan against the CRM through the quarter is in the quarter checkpoints article, and this page is what you take into that first check.


