Gap analysis compares where you are with where you planned to be and breaks the difference into causes you can act on. For a sales owner the gap is a number: the revenue plan minus closed-won minus what the open pipeline can realistically still add. The CRM then shows which of four things is short: deals, deal size, win rate or time.
What gap analysis means for a sales team
For a sales team, gap analysis means three numbers: the current state is closed-won for the period, the desired state is the plan, and the gap is the money between them.
The general method is older than any CRM. HBS Online lays it out in five steps, from defining the current and desired states to an action plan, and Shark Finesse describes it as working out the steps “to move from the current state to a future, desired state” (what makes up a gap analysis). A sales team has one advantage over a strategy workshop. Both states already sit in the CRM with a currency sign, and money can be split by cause in a way a “capability gap” cannot.
So we do not run gap analysis as a quarterly offsite. We run it as a short calculation an owner can rebuild every Monday from the same few fields, and we only call it a gap when it has a sum and a date, as in “$58,000 short of a $120,000 month with six working days left”.
The sales gap formula: plan − closed-won − weighted pipeline
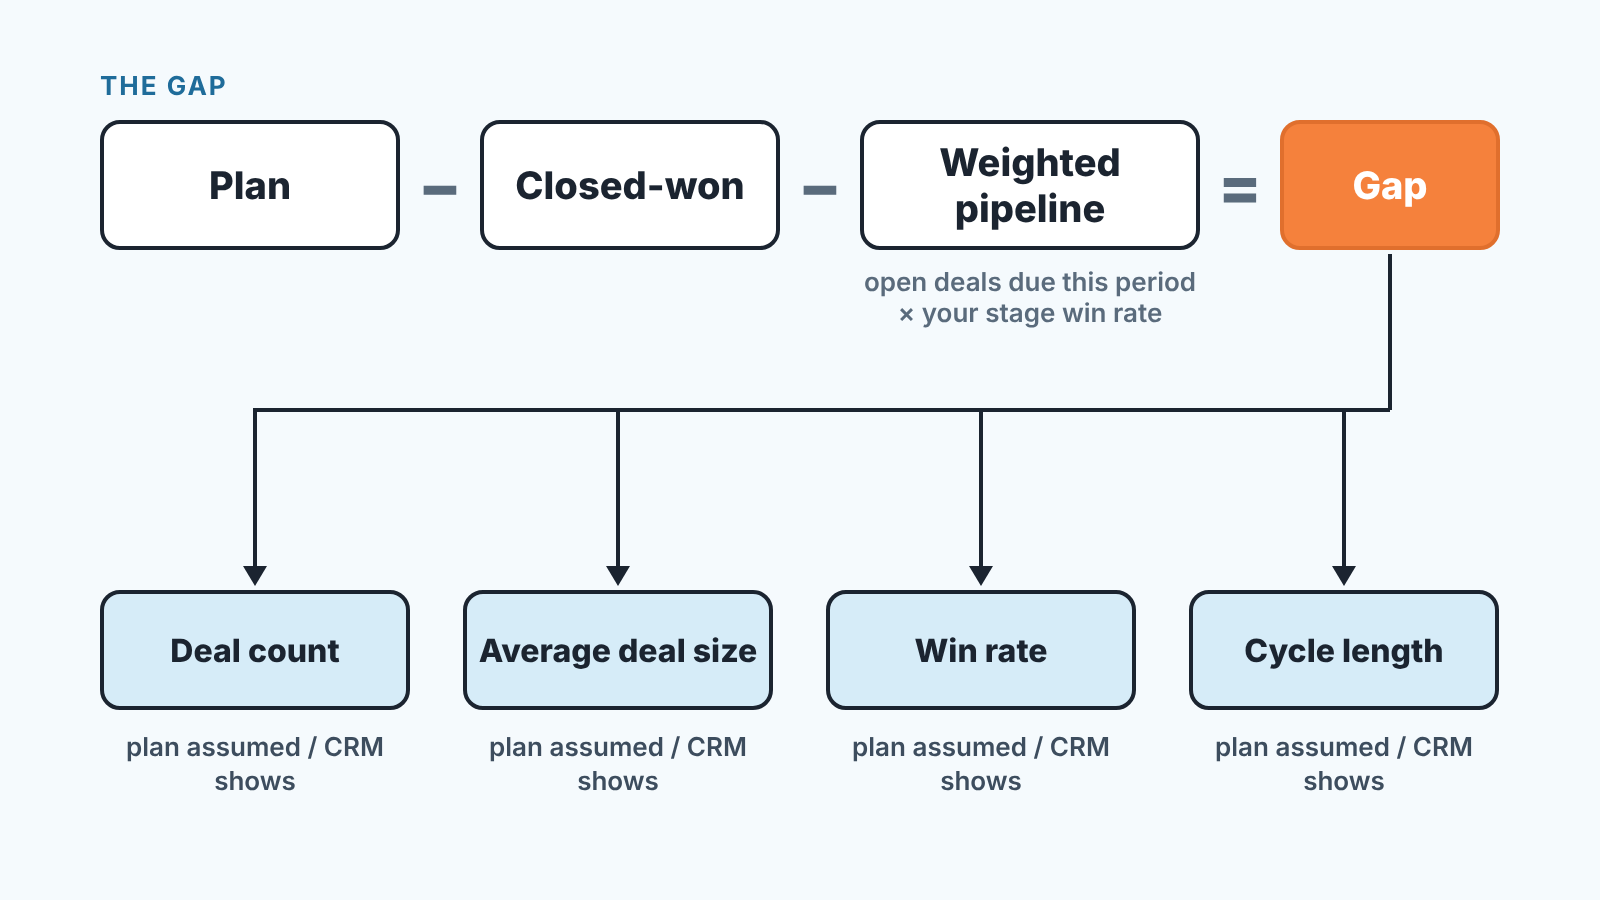
Gap = plan for the period − closed-won in the period − weighted open pipeline due in the period.
That gives two numbers worth naming. The raw gap is plan minus closed-won: what still has to be won. The real gap is the raw gap minus the weighted pipeline: what is not in the pipeline in any realistic form.
Three terms, three places in the CRM. The plan is the number you agreed on, for one period, in one currency. Closed-won is the sum of deals marked won with a won date inside that period. The weighted pipeline is every open deal whose expected close date falls inside the period, multiplied by the share of deals that actually win from its current stage. Raw pipeline hides gaps: a month with $140,000 of open deals against a $120,000 plan looks covered, and the owner relaxes until the 25th.
The difference between the two gaps is the point of the exercise. Open deals that close can cover the raw gap. The real gap needs new deals, and in most months there is no time left to create a deal and close it within the same month.
Made-up numbers, to show the shape: plan $120,000, closed-won so far $62,000, open deals with a close date this month $140,000 at face value, $31,000 once weighted by stage. Raw gap $58,000. Real gap $27,000. The pipeline that looked like more than the whole plan covers roughly half of what is left. That is the sentence an owner needs on Monday, and no CRM report prints it by default.
One warning on the weights. Use your own stage win rates from the last two or three quarters of won and lost deals, not the default probabilities the CRM vendor shipped with the pipeline. The default is a guess about an average company; yours is a fact about your team. The win rate article covers what to count and what skews it.
Four levers that make up the gap
Revenue in a period is deals won times average deal size. Deals won is opportunities worked times win rate. And cycle length decides which period a deal lands in. So every gap, whatever it feels like in the room, comes down to four levers: deal count, average deal size, win rate, cycle length. The job is to find which one is short.
Here is the order we do it in:
- Fix the period and the currency the plan uses, and nothing else.
- Sum closed-won by won date inside that period.
- Weight the open pipeline due in the period by your own stage win rates, and subtract both from the plan.
- For each lever, write down what the plan assumed, what the CRM shows, and the money effect of the difference with the other three held constant.
- The largest money effect is where the gap sits.
Run step 4 per rep or per segment too, if the team is bigger than three people. A blended average deal size can look fine while one rep carries the whole shortfall.
A sales gap analysis example (made-up numbers)
Keep the made-up team. The $120,000 plan assumed 12 won deals at $10,000. To date the team has won 8 deals averaging $7,750, the $62,000 above, which is 52 percent attainment (closed-won divided by plan). Pro-rated for the days gone, the plan expected about 9 wins and $90,000 by now, so the team is $28,000 behind pace. Count is one deal short, worth $10,000 at plan size. Size is $2,250 per deal short, and across 8 deals that is $18,000 by itself. Win rate: the plan assumed 25 percent, the quarter to date shows 24, so not the lever. Cycle: the deals that closed this month were created about 70 days ago, against the 45 the plan was built on. Deals that were supposed to land this month are landing next month.
Read that way the gap sits in deal size first and in timing second. The reps are closing smaller deals later than the plan assumed. A manager who walks in and demands more calls has picked the one lever that was not short.
Plan, closed-won, weighted pipeline, gap, lever: those five lines are the whole gap analysis template, and the owner rewrites them every week. In our experience one lever, sometimes two, explains most of the gap. All four short at once usually means the plan itself was off (how a one-page plan gets its numbers from the CRM). And if closed-won has been sliding for several months, check month-over-month growth from closed-won before you blame this month.
The lever matters because the fix differs. A count gap is a top-of-funnel problem, and it’s arithmetic runs backward from quota (how many leads you need). A size gap is discounting or segment mix. A win rate gap is qualification or one stage where deals die. A cycle gap is often a planning problem, a plan phased for a faster team than the one you have.
What to pull from the CRM
The whole calculation needs a surprisingly short list of fields on each deal:
- amount, in one currency;
- expected close date, and the actual won or lost date once it closes;
- stage, ideally with the date the deal entered it;
- lost reason;
- created date;
- owner.
From those you build five views: closed-won by month, open deals by expected close month with stage, average won amount by month, conversion from each stage to won, and median days from created to won. Any CRM we see on small teams produces these as saved reports or filtered lists, and the export fits in one spreadsheet tab.
Two rules about the period, because they settle most of the arguments later. Count closed-won by the won date, not the created date, so a deal created in March and won in May counts for May. And use the same period the plan uses. A plan set by calendar month and a report pulled “last 30 days” will disagree every time, and someone will spend the meeting explaining why.
The pull takes ten minutes. Cleaning the blanks out of it takes about an hour.
Three kinds of gap and what each one means
Almost every gap we have looked at falls into one of three shapes.
A top-of-funnel gap is a large real gap next to a small weighted pipeline. Deal count is short, and pushing the open deals harder will not add the deals that were never created. The honest reading is that this month is mostly decided and the work that follows is for next month.
A conversion gap looks different: raw pipeline is plentiful, the real gap is modest, and yet the number does not move. Deals sit in the same stage, close dates get pushed to the 30th and then to next month, and the weighted pipeline quietly shrinks as stages age. Win rate or cycle length is short, often both. This is the gap a mid-quarter review exists to catch (quarter checkpoints in the CRM).
The third kind is a data gap, where the gap you calculated is not the gap you have, because the inputs are blank. It is the cheapest to fix and the most common to miss.
When the gap is in the data, not the sales
A deal with no amount is a zero in every report. In the weighted pipeline it contributes nothing, so the real gap comes out larger than it is, and the owner starts pushing for new deals the team does not need. A deal with no close date never enters the period at all, with the same effect. A deal whose close date passed three weeks ago still sits in “this month” and inflates the pipeline with money that is probably not coming. And a deal lost without a reason cannot be assigned to a lever, so the win rate is right and the diagnosis is still blind.
Our rule before any gap calculation: count the open deals in the period with a blank amount, a blank close date or a close date in the past. More than a handful, and you fix the data first and compute the gap second. On dirty data the calculation can point at the the wrong lever entirely. We would rather see a rep type a rough amount than leave the field empty, because a rough number can be argued with and a blank cannot.
This is where the task meets the product we build. Deal Health in SalesBond checks every deal in the connected CRM against more than 20 rules, and among them are exactly these: no amount, no close date, a close date that has passed, a deal lost without a reason. Each deal gets a score from 0 to 100 with the violations behind it, so “fix the data first” is a list rather than a hunt. To see how much of your pipeline is affected before you touch anything, the free CRM audit is the shorter route: SalesBond looks at the last 30 days of your CRM and sends a PDF with money at risk, a CRM score and the top three findings, then a second PDF a week later with what changed. Check your CRM with SalesBond.
Stop at the lever, then write the plan
The gap analysis ends when you can say which lever is short and by how much money. It does not end with a list of things to do, and we think it should not, because the list is a different document with different owners. A size gap needs a pricing conversation with two named reps by a date. A conversion gap needs teh stuck deals revived or moved back a stage. A data gap needs an afternoon of cleaning and a required field. Each is an action with an owner, a date and a task in the CRM, so that on Friday you can see whether it happened. That document is the action plan for a sales owner when the month is behind plan, and it starts where this article stops.
Where plan and gap sit in SalesBond: Sales Plan and Closing the Gap
A disclosure, since we have been describing a Monday spreadsheet: we build SalesBond, a sales management layer on top of the CRM a team already uses, and that spreadsheet is what we got tired of rebuilding. The Sales Dashboard has widgets named Sales Plan and Closing the Gap, so the plan and the remaining gap sit on one screen next to win rate and deal cycle instead of in a file one person knows how to refresh. Behind the widget is Sales Plan, which links the target to the real state of the pipeline and keeps fact, forecast and recommended action apart, with the period, currency and assumptions stated. The owner’s version of the picture is the Owner Dashboard (what an owner’s KPI dashboard should show).
What SalesBond does not do is the four-lever reading for you. It keeps the inputs honest and the gap on a screen instead of in a Monday file; which lever is short is still the owner’s call, and we think that is the right split. The Sales Plan and Closing the Gap widgets come with a SalesBond account.
FAQ
How do you write a gap analysis for a sales team? Five lines: the plan for the period, closed-won to date, the weighted pipeline due in the period, the resulting gap, and the lever (count, size, win rate, cycle) with the largest money effect. Then a separate action plan with an owner and a date per line.
What is the difference between a SWOT analysis and a gap analysis? SWOT is a qualitative inventory of strengths, weaknesses, opportunities and threats; a gap analysis measures the distance between a current state and a target state so it can be closed. For a sales owner, the gap is a sum of money and the SWOT is at best the commentary on it.
What are the four types of gaps? General guides group gaps by area, and the count differs from guide to guide: Qualaroo, for example, lists six types (manpower, performance, profit, market, skills and IT gaps). For a sales plan the four types that matter are the four levers: deal count, average deal size, win rate and cycle length.