
Lead generation is the work of attracting people who may buy and getting them into your CRM as leads. To know how many you need, work backward from the revenue target with leads per month = monthly revenue target ÷ average won deal ÷ win rate ÷ lead-to-opportunity rate, taking every rate from your own CRM.
Lead generation in one paragraph (and what it is not)
Most guides on this topic are written for marketers and answer “where do leads come from”: ZoomInfo splits the work into inbound and outbound across a four-stage process (ZoomInfo: Lead Generation), Salesforce covers channels and best practices (Salesforce: What is Lead Generation?), and LinkedIn adds how to qualify B2B leads (LinkedIn: What is Lead Generation). The owner of a five-person team asks something else in a planning meeting, namely how many leads the team needs and whether that number is even possible, so our definition is narrow. A lead is a person or company that has shown up in your CRM and has not yet been qualified into an opportunity, and lead generation is everything that makes that record appear, from a form or a referral to a cold email that got a reply or a trade-show badge scan. Qualification and pipeline come after it. On the usual ladder of lead, MQL, SQL and opportunity, we count raw leads, meaning every new lead record in the CRM, qualified or not; if your team only counts marketing qualified leads, add one more conversion to the chain below (lead to MQL) and the math still holds.
Start from the quota, not from the channel
Most lead generation plans in small companies start with a channel. “We should do LinkedIn.” “We should try cold email.” Then a budget gets attached, a few months pass and nobody can say whether the volume was enough, because nobody wrote down how much was enough.
Start the other way round. The quota is a number someone already agreed to. Average won deal, win rate and lead-to-opportunity rate are fixed too, at least for the next quarter, because they are the record of how your team actually sells. Between those four numbers there is one unknown left, and that unknown is the lead count. Solve for it first. Pick channels after, once you know if you need twenty leads a week or two hundred, because those are different businesses.
We think this is the most useful change a sales manager can make to the lead conversation. It turns “marketing isn’t giving us enough” into a number both sides can check.
Step 1: won deals you need per month (average deal from CRM)
Take the revenue target for the period and divide by the number of months. Then open your won deals for the last six to twelve months and average the value. In any CRM this is a filter on deals with status won, a date range on the won date, and the value column averaged. That is the only field you need from this step.
Two cautions, both from experience. First use the median as a sanity check next to the mean. One outsized deal from last spring can double the average and halve the lead count you think you need; if the two numbers are far apart, plan on the median. Second, use the won date for the range. A deal created in January and won in June belongs to June’s revenue.
In formula form, won deals needed per month = monthly target ÷ average won deal, rounded up, since nobody closes half a customer.
Step 2: win rate and lead-to-opportunity rate: where the numbers live in your CRM
Win rate is won opportunities divided by won plus lost over the same period. It tells you how many opportunities you have to open to close one. Lead-to-opportunity rate is the share of leads that ever became an opportunity at all. Together they connect the quota to the top of the funnel.
In Pipedrive, leads sit in the Leads Inbox, separate from the pipeline, until a rep converts one to a deal (Pipedrive: Leads Inbox). That converted deal is your opportunity. Insights has a Lead conversion report for lead-to-deal rates and a Deal conversion report for how deals move through the pipeline (Pipedrive: Insights report types). In HubSpot, the lifecycle stages run from Lead through Marketing Qualified Lead and Sales Qualified Lead to Opportunity (HubSpot: lifecycle stages), and a funnel report can track progression through lifecycle and deal stages with stage-to-stage conversion rates (HubSpot: funnel report types). Salesforce and Zoho CRM also keep leads as separate records that get converted, so the same two numbers come from a report on leads and a report on opportunities by stage. If your CRM has no separate lead record and reps create an opportunity for everyone who replies, your first pipeline stage is effectively your lead list, and the conversion out of that stage is your lead-to-opportunity rate.
In most small teams the lead-to-opportunity rate is the least reliable number in the CRM, because leads get archived without a reason or never get logged when they go nowhere. If that is you, take the rate from the last quarter, write “rough” next to it, and fix the logging habit this quarter. We cover the logging routine in the prospecting block article, and the win rate calculation itself, with its traps, in how to read your win rate.
Step 3: leads per week, and per rep (worked example)
Per week the chain is leads per week = monthly target ÷ average won deal ÷ win rate ÷ lead-to-opportunity rate ÷ 4.33, where 4.33 is the average number of weeks in a month. For a team of three, with made-up figures to show the arithmetic, it runs as follows; put your own in.
- Annual revenue target: 600,000, so the monthly target is 600,000 ÷ 12 = 50,000.
- Average won deal, last 12 months: 10,000.
- Won deals needed per month: 50,000 ÷ 10,000 = 5.
- Win rate of 25%, so opportunities to open per month: 5 ÷ 0.25 = 20.
- Lead-to-opportunity rate of 20%, so leads needed per month: 20 ÷ 0.20 = 100.
- Leads per week: 100 ÷ 4.33, about 23.
- Per rep per week with three reps: about 8.
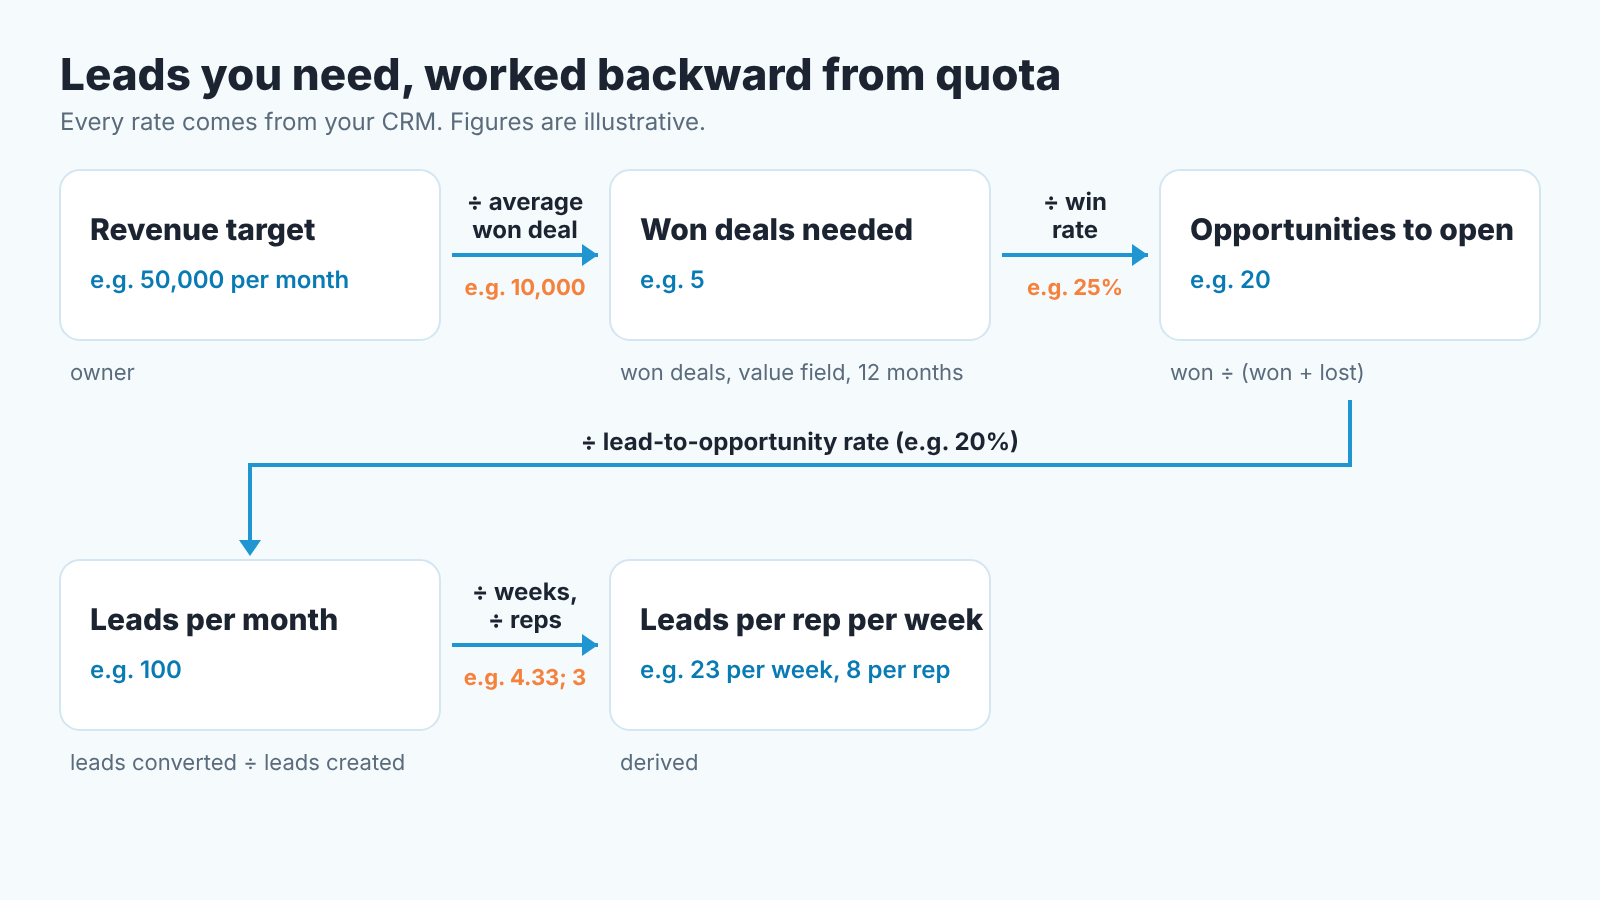
Eight new leads per rep per week sounds easy. It means eight new records every week, each with a source, each worked until it becomes an opportunity or gets closed out, on top of the live opportunities the same three people are carrying. Run the same chain with a 15% win rate instead of 25% and the number becomes thirteen a week per rep. So a ten-point drop in win rate raises the lead count per rep by more than half.
If the per-rep number comes out above what your team can physically do, you have a capacity problem, and more leads will not fix it. The fix is in the capacity planning article, and how many deals one rep can carry is the other half of the same constraint.
Who generates the leads: marketing, reps, or both (and the hours it costs)
In a company with a marketing person, the split is obvious on paper and messy in practice. Marketing owns inbound: forms, content, events, ads. Reps own outbound: lists, cold outreach, referrals from existing customers. Then the month ends, inbound delivered forty of the hundred, and the remaining sixty quietly became the reps’ problem without anyone saying so.
Make the split explicit, in leads per month, before the quarter starts. Marketing commits to a number of inbound leads; reps commit to a number of outbound leads each. Both numbers go on the same page as the quota. If marketing delivers thirty instead of forty, everyone knows on the first of the month that reps need to find ten more, and the conversation is about ten leads, with nobody looking for someone to blame. The attribution side, source of lead to won deal, is a separate exercise we wrote up for HubSpot teams in sales and marketing alignment for a small company. Here we only need the count.
The hours are the part nobody budgets. We don’t have a number for how long one outbound lead takes, and we would distrust anyone who did, because it depends on your list and your sector. What we suggest instead: for one week, have each rep log the time spent on prospecting as an activity in the CRM, then divide by the leads created. By Friday you have a cost per outbound lead in hours. Multiply it by the outbound quota per rep and you know how much of the the week is left for selling. If prospecting eats more than a day, the plan needs more inbound, a better list or one more person, and now you can say which.
Where the math breaks: cycle length, lead quality by source
The backward calculation assumes a lead generated this month closes this month; it does not. If your average sales cycle is ninety days, the leads you generate in January close around April on average, and January’s revenue was decided by last October’s leads. So set the lead quota for the month the won deals are needed, shifted back by the cycle. Pull the cycle from the CRM as the gap between created date and won date on won deals.
The second break is that one lead-to-opportunity rate hides very different sources. Referrals from existing customers often convert at a much higher rate than a purchased list. If marketing’s forty leads convert at one rate and the reps’ outbound at another, a blended rate gives the wrong lead count for both sides. Once you have the split from the previous section, run Step 3 separately for inbound and outbound, each with its own rate from the CRM. Its two extra lines of arithmetic, and it changes the answer more than any other refinement.
Seasonality is the third, and it is specific to your business, so the one suggestion here is to look at won deals by month for the last two years before you divide the annual target by twelve.
What to review weekly: leads in, lead-to-opportunity rate, source of won deals
Three numbers on Monday, all from the CRM, none from a spreadsheet someone has to maintain.
Leads created last week, against the weekly number from Step 3, split by inbound and outbound. Leads converted to opportunities last week and over the trailing month, so a falling rate shows up before it reaches the quota. And the source on every deal won last week, so that by the end of the quarter the lead-to-opportunity rate by source is a fact rather than a guess. SalesBond’s free CRM audit covers the deal side of the same pipeline, reading the last 30 days of the connected CRM and sending a PDF report with money at risk, the pipeline bottleneck and what to fix, then a second PDF seven days later showing what changed.
Your next step is small. Before the next planning meeting, pull average won deal, win rate and lead-to-opportunity rate out of your CRM, set them against the agreed quota, run the chain once, and put the weekly lead number on the same page as the quota. The one-page version of that page, with the lead line added to the deal and pipeline lines, is in a sales plan on one page.