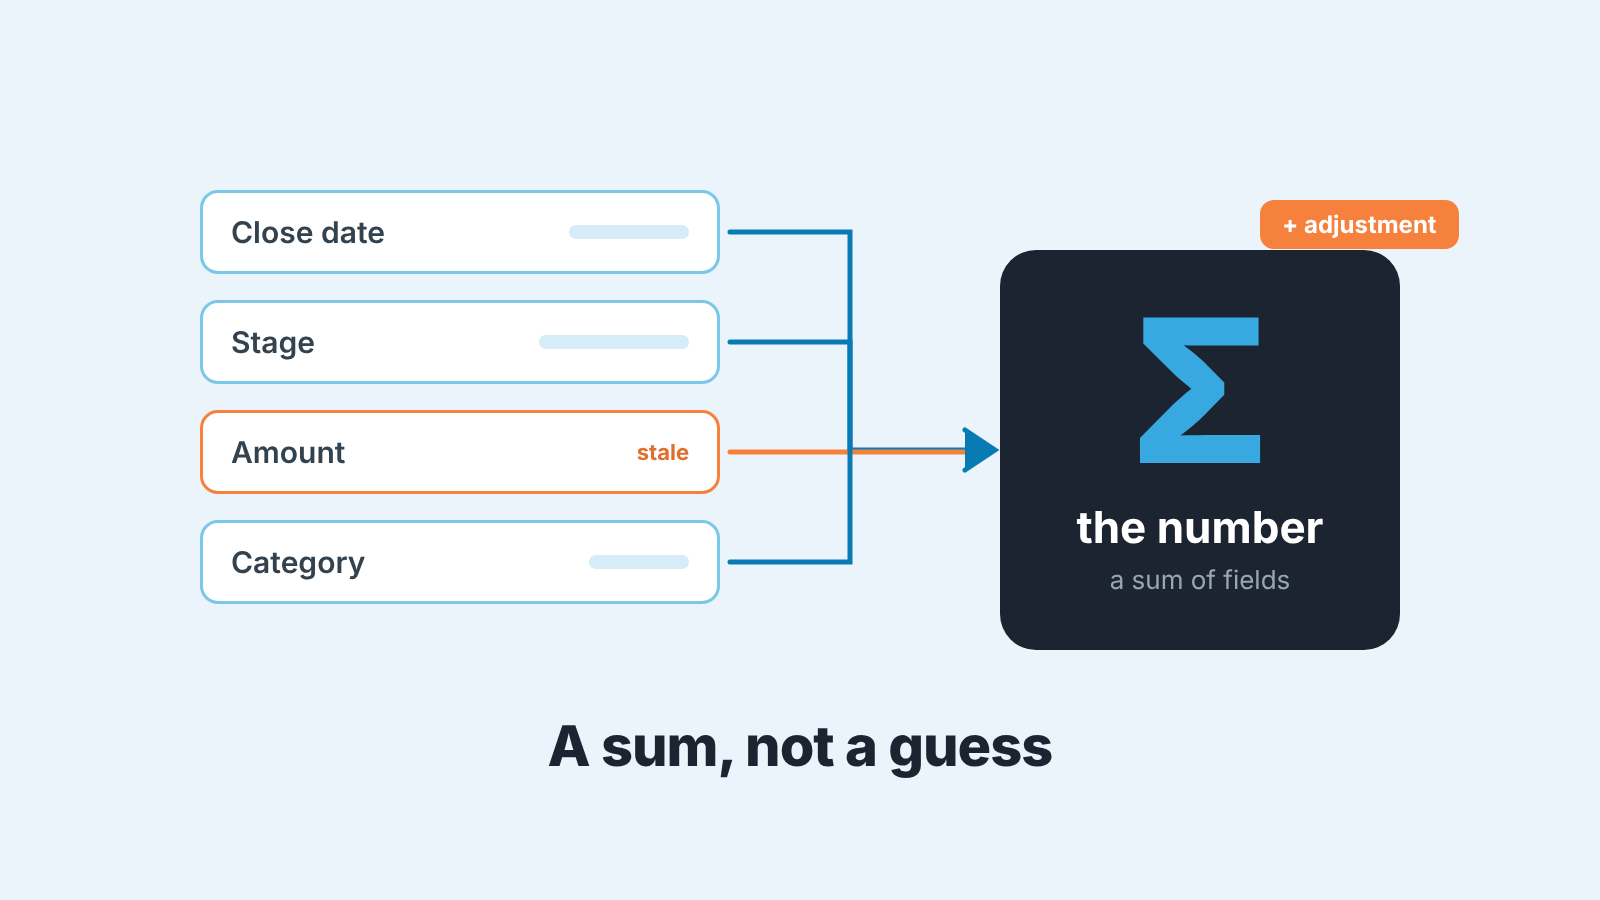
The Salesforce sales forecast is a roll-up of opportunities grouped by forecast category and close-date period, with manager adjustments on top. It is only as reliable as the close dates, stages and amounts under it, so check those fields on the deals before you trust the total. This article is for the manager who has to say “we will do 85 this quarter” on Thursday. An admin setting the feature up will find the forecast type and hierarchy steps in Trailhead’s unit on configuring sales forecasting.
A note on names. Older material calls the module Collaborative Forecasts; current Trailhead units call it Pipeline Forecasts or Salesforce Forecasting (Trailhead: Review Your Forecasts Setup). Same thing.
The forecast number is a sum, not a prediction
Nothing on the forecast page guesses. Salesforce’s own introduction says forecasting “allows you to analyze opportunities that are closing within a period” and lets your team “make adjustments as opportunities move through the sales cycle” (Trailhead: Predict Sales and Forecast with Confidence). Read that the way an accountant would. The number is a total of records that matched a few conditions, plus whatever a person typed over the total.
That matters because a sum goes wrong in only three ways: a record that shouldn’t be in it, a record that is missing, or a stale field. When the quarter closes at 70 against a forecast of 120, the the postmortem usually reads “two deals had last quarter’s close date and nobody moved them.”
So our position is that a manager who doubts the forecast should question the opportunities that produced it and leave the total alone until they are fixed.
What goes into a Salesforce forecast number
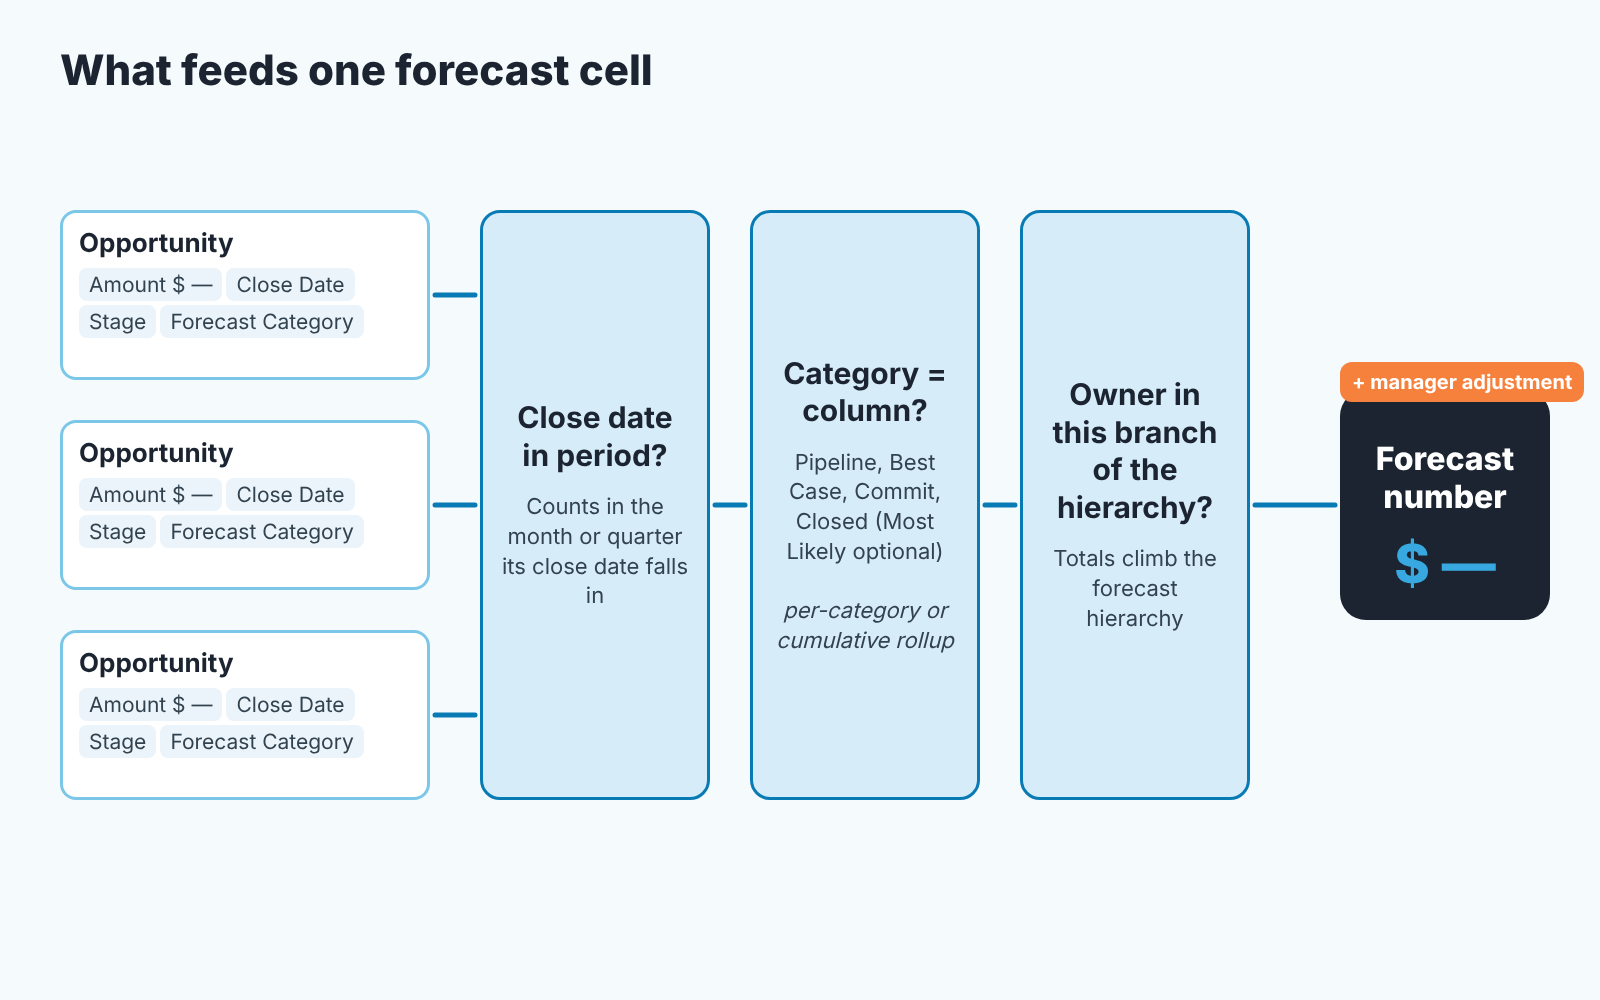
Start with the period. The default forecast type is built on the Opportunity object and measures Amount by Close Date (Trailhead: Configure Sales Forecasting). An opportunity counts in the month or quarter its close date falls in. A deal dated 30 September belongs to one number, the same deal dated 1 October to another, with nothing else changed. That makes the close date the most consequential field on the record.
Then the category. Each stage maps to a forecast category, and there’s a default mapping on the Stage field that an admin can change (same unit). The grid shows the categories as columns: Pipeline, Best Case, Commit and Closed, with Most Likely as an optional extra. Move a deal to a later stage and it moves columns.
One setting changes what a column means: totals roll up either per category or cumulatively. Before you quote a Commit figure, know if your Commit means Commit only or Commit plus Closed. We covered the rollup modes and the stage mapping in Salesforce forecast categories, rollups and manager adjustments.
The totals then climb the forecast hierarchy, which is generated from the role hierarchy, so whoever sits at the top reads a total of totals, stale close dates included.
What a manager’s adjustment changes, and what it doesn’t
An adjustment changes the rollup number “without modifying the underlying opportunities” (Trailhead: Review Your Forecasts Setup). The deal keeps its stage, date and amount. So before you trust a number find out how much of it is deals and how much is somebody’s judgement. A Commit of 120 that is 85 of opportunities and 35 of adjustment is a different object from 120 of opportunities, and the grid shows both as 120. When to adjust and when to fix the deal is in the adjustments article.
Five checks on the deals before you trust the number
The checks below take a filtered opportunity list: this period, open, sorted by amount descending. Start at the top; the five largest deals usually carry most of the number. Each check is a question you can put to the rep in one sentence.
- Close date. Is it this period because the buyer said so, or because that is where the date was when the deal was created? A close date that has never been edited on a four-month-old deal is a default nobody planned. Ask for the event the date is tied to: a signature meeting, a procurement deadline, a go-live. No event, no confidence in the period.
- Stage against category. Does the column the deal sits in match what the stage says? If the stage says Proposal and the deal is counted in Commit, the rep is forecasting on hope, and the number you are reading contains that hope at full value. There should be a reason you can repeat.
- Amount. Is this the number on the latest quote or the number from discovery? Amounts drift most on deals that have been open a long time: the scope shrank, a module dropped out, a discount was agreed on a call and never made it to the record. The forecast sums whatever is in the field.
- A next step with a date. A Commit deal with no next step written down, or one that just says “follow up”, isn’t being worked. It may still close. You can’t forecast it, because nobody can tell you what has to happen between now and the close date.
- Change history. Look at how the close date and stage got where they are. A deal whose close date has moved quarter to quarter three times tells you more about the odds of a fourth move than any category does. If nobody can see how a close date changed, that’s the one request we’d put to the admin this week.
Five checks on five deals is twenty-five questions. In practice it takes about twelve minutes, because most answers are fine and you move on, and the number you carry upstairs is then made of fields you have looked at. If you would rather not run the checks by hand every week, Deal Health in SalesBond checks every deal against more than 20 rules, with forecast among its rule categories, and Salesforce is one of the 15 CRMs it works with.
A worked example: the rep says 120, the deals say 85
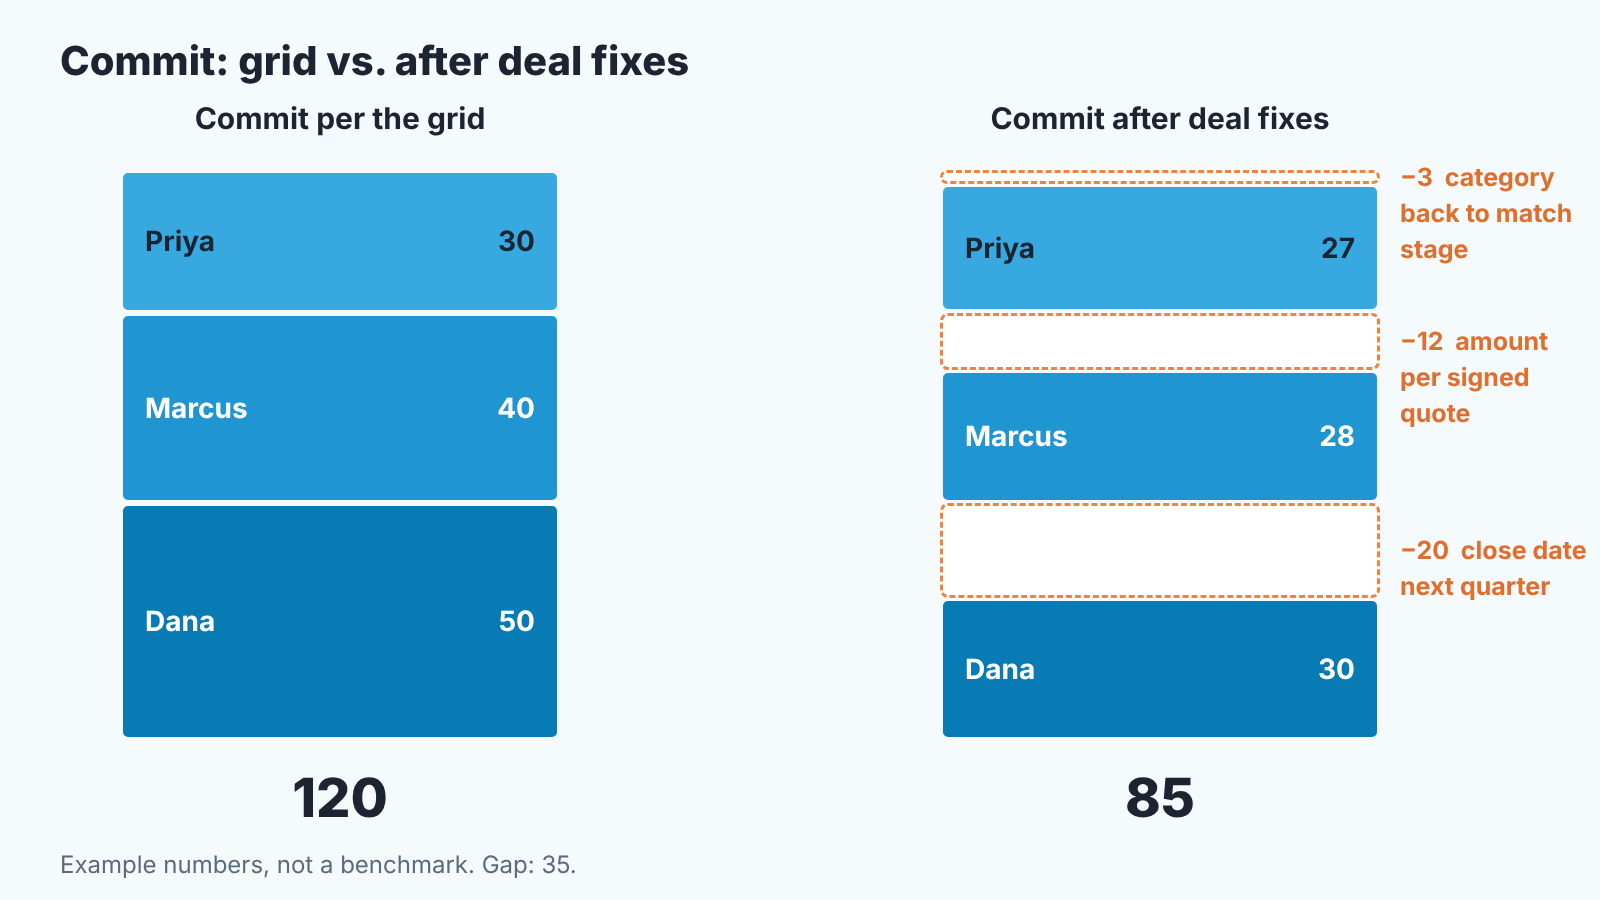
Example numbers only. Three reps, one quarter, Commit column, per-category rollup, so Commit means Commit only. The grid says 120.
Dana shows 50. One deal at 20 still has the close date it got when it was created in March, and the buyer’s procurement meets next quarter. Defensible: 30.
Marcus shows 40, but the amount on his largest deal is the discovery figure; the signed quote is 12 lower. Defensible: 28.
Priya shows 30. A deal worth 3 sits at stage Proposal yet counts in Commit, with no next step. Defensible: 27.
That’s 30 + 28 + 27 = 85 against 120, a gap of 35. Dana’s deal will probably close, just not in this period. Marcus’s will close at the quote amount, which is still a good deal. Priya’s small one might land. The grid said 120 because the grid sums fields, and three fields were stale.
Notice what did not fix it: a manager adjustment to 85. That gives the right number for one week, with the three stale fields still underneath. Next Monday Dana’s deal is still dated this quarter, the adjustment still says 85, and now two people disagree about why. The fix is a date change, an amount change and a category change on three opportunities. Then the grid says 85 on its own, and it will keep saying something true as the deals move.
Twenty minutes alone with the grid
The meeting itself is covered in the weekly review with Pipeline Inspection. This is the twenty minutes before it.
Minutes one to three: write down the number you report and its change since last week. One column is enough.
Minutes four to six: separate deals from adjustments. How much of the column is opportunity amounts, how much is override, and is any override older than two weeks? Treat an old adjustment as a question for its owner.
Minutes seven to eighteen: the five checks on the largest open deals in the period. Write each finding as one line next to the rep’s name, the way you’ll say it: “Dana, the 20 deal, close date.” If a finding is plainly a field error, fix the field now; the grid updates and the meeting starts from the corrected number.
Minutes nineteen and twenty: pick the two deals the meeting should actually be about, usually the two where the checks didn’t settle the question.
The same twenty-minute routine works in any CRM that rolls opportunities up into a forecast. If you want the thinking behind the words Commit and Best Case themselves, read commit vs best case next.