A KPI (key performance indicator) is a measurable value that tells you whether you are getting closer to a specific goal. What makes it work is what you attach to the number: the person who owns it, the data source it is read from, how often it is checked and a one-sentence definition. Without those four attributes, it stays an ordinary metric. For a company of 5 to 30 people, five to seven KPIs are enough. That limit is our working rule, and the sections below show how to get down to it and how to read the sales ones from your CRM.
KPI meaning: how a KPI differs from a metric and a goal
Databox defines a KPI as a measurable value that shows how effectively a company, team or individual is achieving a specific business objective. In the same guide it names “data overload”, tracking too many KPIs at once, as one big mistake many businesses make at the beginning (Databox: KPI meaning). That second point is where most owners lose the thread.
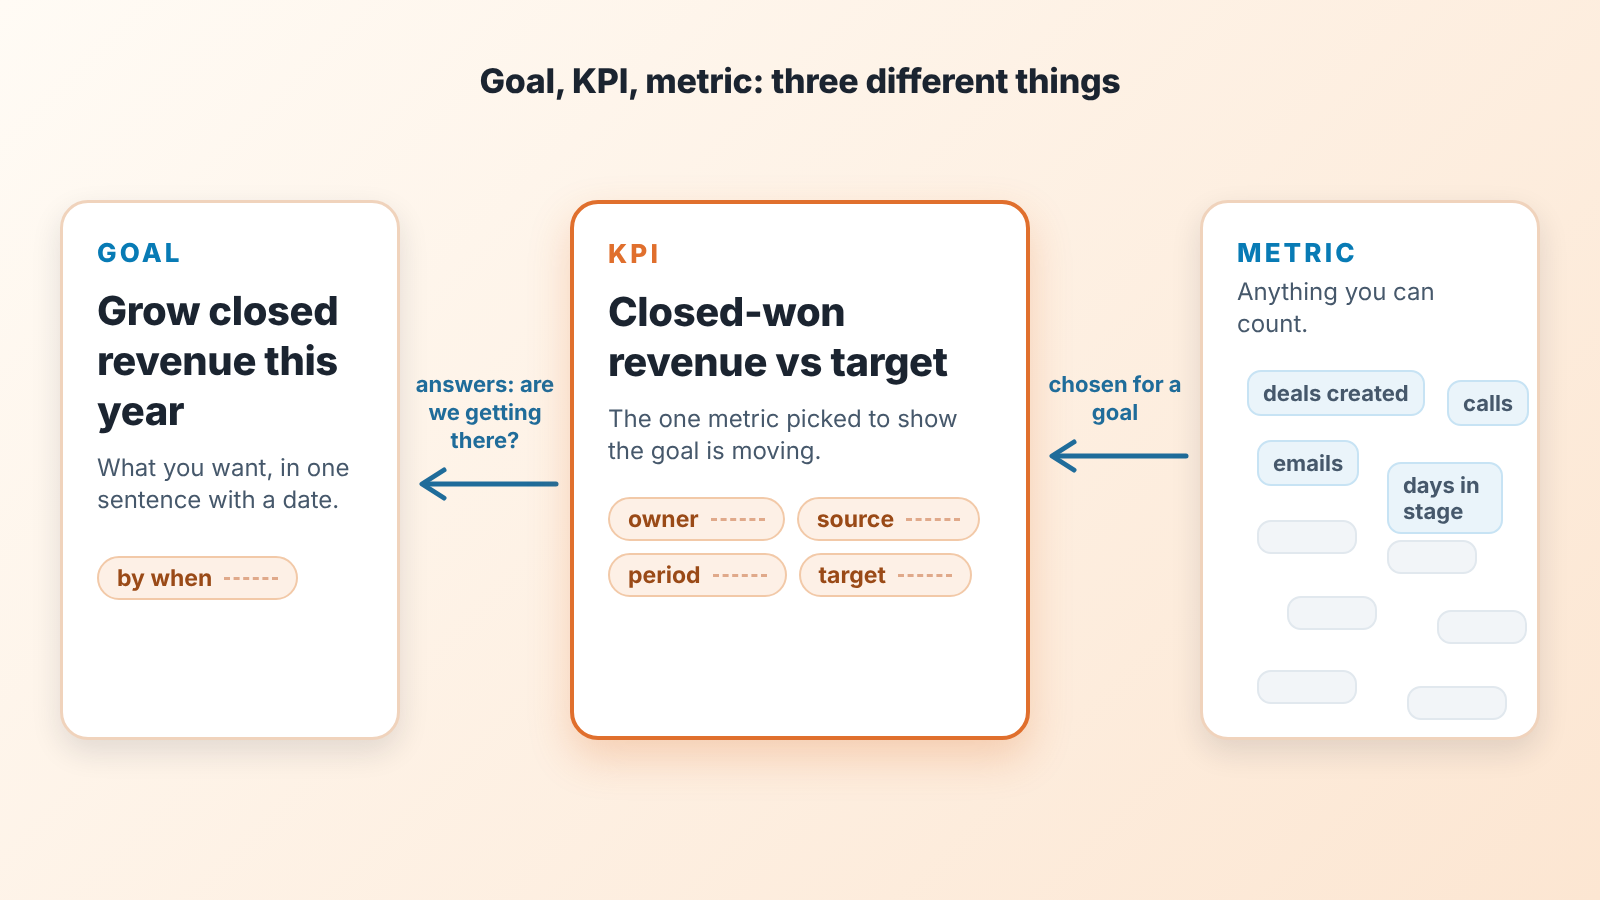
Three words get mixed up in this conversation. A goal is the state you want to reach, such as “grow closed revenue this year” or “stop losing repeat customers”; sometimes it has a target number and a date, sometimes it has neither yet. A metric is anything you can count, from deals created and calls logged to average deal size and days in stage. A CRM produces hundreds of them without anyone asking.
A KPI is a metric with a job: the one you pick to show whether a specific goal is being met, and it keeps the title only while that goal matters. If the goal is to grow closed revenue this year, closed-won revenue against the monthly target is the KPI, and deals created or emails opened stay ordinary metrics. Klipfolio ties KPIs both to business objectives and to the personal growth of the people who own them (Klipfolio: why KPIs matter), and the second link is the one small teams tend to forget.
One more neighbour is the OKR, and HubSpot separates it from the KPI by intent. KPIs show whether goals you have already set are being met, while OKRs set the ambition in the first place (HubSpot: how to choose KPIs). If your team runs on OKRs, the key results are where KPIs come from; we wrote about that pairing in OKRs for a sales team with key results pulled from CRM data.
Leading and lagging KPIs, with sales examples
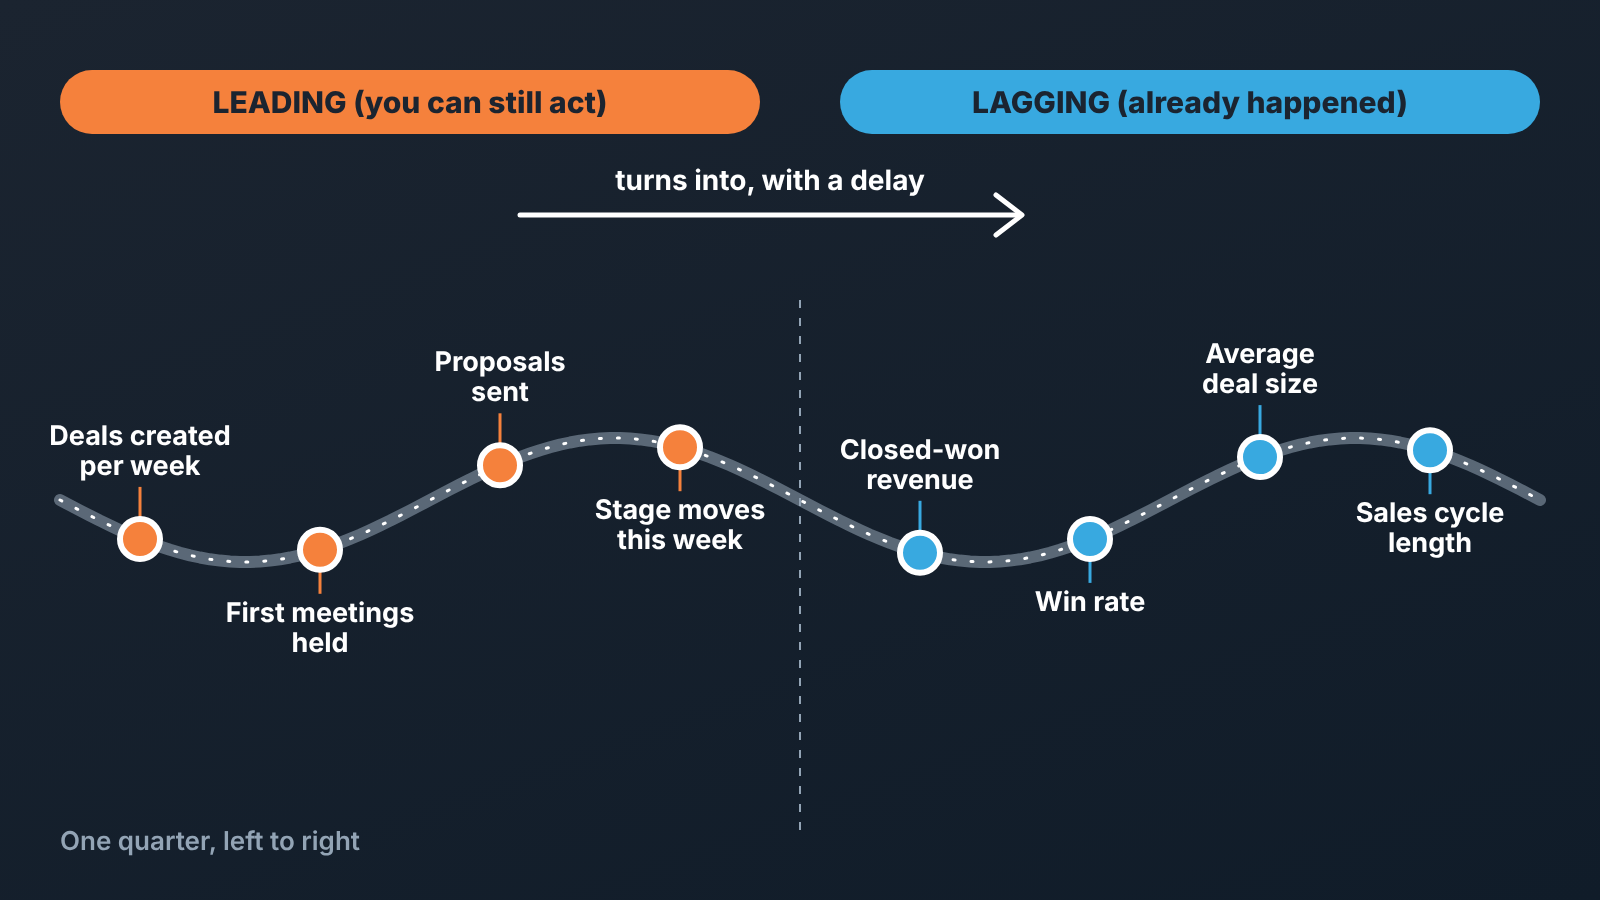
A lagging KPI measures something that has already happened. TechTarget’s examples are quarterly sales and revenue growth: by the time you read the number, the quarter is over and nothing you do changes it. A leading KPI points at what is coming; TechTarget’s example is sales bookings that will generate revenue in future quarters (TechTarget: what is a KPI).
In a sales team the split looks like this.
Lagging: closed-won revenue for the month, win rate for the quarter, average deal size, length of the sales cycle. These tell the owner what happened once the period is over.
Leading: new qualified deals created per week, first meetings held, proposals sent, deals that moved a stage this week. They give the manager a rough picture of next month’s revenue while there is still time to do something about it.
HubSpot’s advice is to carry both kinds (HubSpot: how to choose KPIs), and we would be more specific for a small company. The owner should read one lagging number per goal. The sales manager should run the week on one or two leading numbers that feed it. If the whole set is lagging, every review is a post-mortem. If the whole set is leading, you can hit every activity target and still miss the plan, because activity is a guess about revenue until the deal closes.
How to choose 5 to 7 KPIs for a small business
Start from goals, and write them down before you open the CRM. Two or three goals for the year is realistic for a company of 5 to 30 people. Add more and the KPI list balloons on its own, because every goal wants at least two numbers.
For each goal, pick one lagging KPI that proves the goal is happening and one leading KPI the team can move this week. Three goals, two KPIs each, and you are at six. That is the arithmetic behind our 5 to 7 rule. The rule is ours, so if you go to nine, do it on purpose and write down why. Databox lands close to it: their tip is to start with 5 to 8 KPIs and treat anything over ten as too much (Databox: KPI meaning). HubSpot’s guidance is to focus on a few key metrics, keep them tied to goals, and consider the company’s stage of growth (HubSpot: how to choose KPIs). A company still finding its first repeatable sale needs different numbers from one that is scaling a proven one.
Then give every KPI four attributes, in writing. An owner (one person, by name, because a number owned by a whole department has nobody who answers for it). A source (the exact report or filter the number is read from, so two people never argue about which spreadsheet is right). A frequency (weekly for leading, monthly or quarterly for lagging). A definition in one sentence, including what is excluded. Teams skip the definition line most often, and it is the line that settles the Monday argument about whether a renewal counts as new revenue.
Cross out everything without those four. If you cannot name a source, the KPI cannot be read. If you cannot name an owner, the KPI will be nobody’s and will quietly stop being updated.
Last, put a review date on the list. Databox reports that, according to its research, most businesses change or add to their KPIs at least quarterly (Databox: KPI meaning), and that matches what we see: a KPI that made sense in January can be irrelevant by June because the goal moved. If you run a one-page sales plan, the KPI review belongs in the same meeting; see the one-page sales plan for a small team.
So what makes a good KPI? It answers whether a specific goal is moving, it has one owner, one written source and a fixed period, and someone would act differently if it changed. A number missing any of that can stay a metric. It can still be useful to the person who tracks it, outside the owner’s short list.
KPI examples for an owner: company, sales, delivery
Treat what follows as a menu. You take five to seven items from it, and each one comes with the type, a typical owner, the source and how often to read it. The CRM wording is generic because field names differ between systems; we map them field by field in sales performance metrics and the CRM fields behind them.
For the company as a whole, all three are lagging and sit with the owner:
- Closed-won revenue vs target, from CRM won deals by won date, monthly.
- Gross margin on delivered work, from accounting by invoice date, monthly (owner or finance).
- Repeat customers who bought again on time, from CRM won deals per customer, quarterly.
Sales has the longest list, and the sales manager owns all of it:
- New qualified deals created: leading, weekly, deals by creation date and stage.
- First meetings held: leading, weekly, completed activities of type meeting.
- Proposals sent: leading, weekly, deals entering the proposal stage.
- Win rate: lagging, monthly, won divided by won plus lost.
- Sales cycle length: lagging, quarterly, won date minus creation date.
Delivery usually needs only two. Projects delivered on the promised date is lagging and monthly, read from the project tool or a custom field on the won deal. Open customer issues older than a week is leading and weekly, read from the the support tool. Both belong to the head of delivery.
A set we would actually hand to a ten-person services company: closed-won revenue vs target, win rate, new qualified deals per week, first meetings held per week, projects delivered on time, and repeat customers buying on time. Six numbers, two of them weekly, four monthly or quarterly, each with a name next to it.
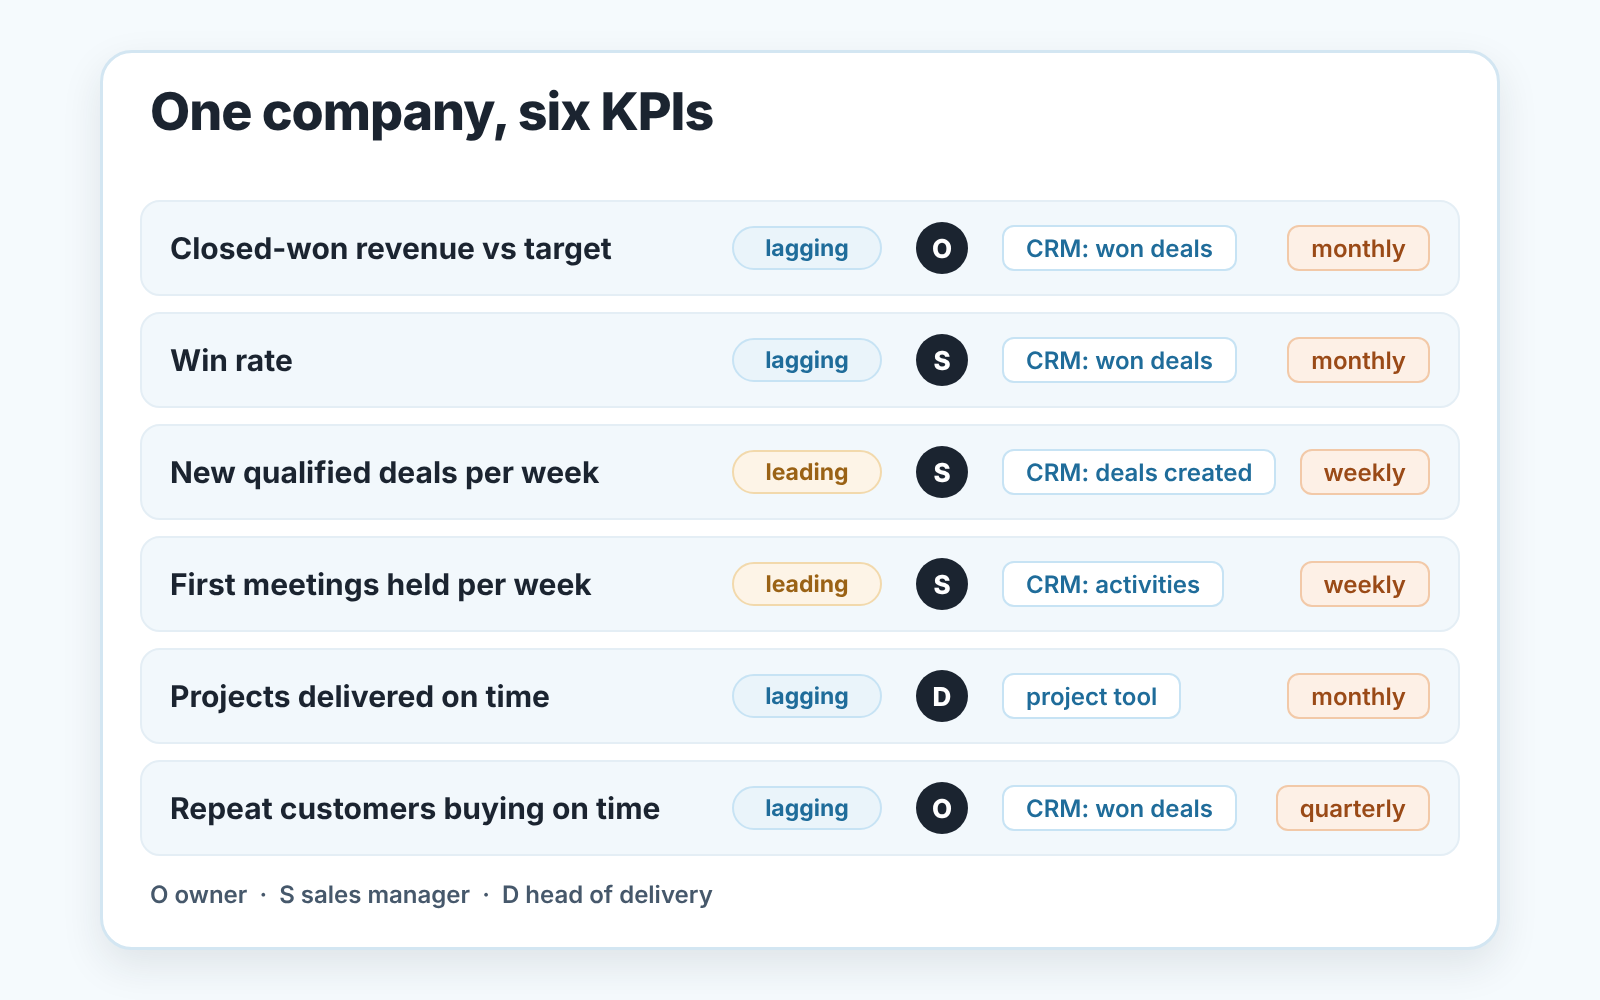
People also search for “the four KPIs” every business should track. We do not think a fixed four exists, because the KPI follows the goal and goals differ. For a small company selling through a CRM, the four that show up in almost every set we build are closed-won revenue against target, win rate, new qualified deals per week, and repeat customers buying on time. Swap any of them the moment your goals change. If an interviewer asks which KPIs you were held to, answer in the same shape, naming the number, its target, the period and where you landed against it.
Laying those six out on one screen is a separate job, and we cover it in the KPI dashboard an owner actually opens. What goes into a written monthly KPI report, with comments and targets, is in the KPI report for a business owner.
Reading sales KPIs from the CRM: pipeline, closed deals, activities
Whichever CRM you run, every sales KPI above is read from one of three places, and sales performance metrics and the CRM fields behind them gives the exact field for each of them in your system.
The pipeline. Open deals carry a stage, a value, a creation date, an expected close date and an owner. “New qualified deals created” counts deals that reached your qualification stage in the week; “proposals sent” counts deals that entered the proposal stage. Forecasts are built from the expected close date, so a pushed close date quietly breaks the forecast while every deal looks fine.
Closed deals. Won and lost deals carry an outcome date and a final value. Closed-won revenue, win rate and sales cycle length all come from here, and the owner field on each deal turns them into per-rep numbers.
Activities. Calls, meetings and emails logged against deals carry a type, a date, a done flag and an owner. Data quality dies here first, because logging is extra work for the rep and nobody checks.
That is the honest limit of every CRM-based KPI. A KPI is read from fields people fill in. If reps log meetings in a notes field instead of as activities, “first meetings held” reads zero for a team that is busy. Before you trust a KPI you have to trust the fields under it.
We build SalesBond, a sales management layer on top of the CRM a team already uses, and the free CRM audit exists for this step. SalesBond looks at the last 30 days of your connected CRM and sends a PDF report: money at risk, a CRM score, deal health, where the pipeline bottleneck sits, repeat customers, and a short list of what to fix. Seven days later a second PDF shows what changed. For an owner picking KPIs, it answers the question that comes before any KPI: can these fields be trusted yet? Check your CRM with SalesBond. Once the numbers hold, the Owner Dashboard shows plan attainment, forecast, gap to target and revenue at risk without opening individual deals.
How to calculate a KPI (the KPI formula)
Most KPIs come down to one of two formulas.
A ratio divides a part by a whole from the same period. Win rate is deals won divided by deals won plus deals lost, for deals closed in the period. The denominator matters more than people expect. Put open deals in it, or count deals created in the period instead of deals closed in it, and you get a different number with the same name.
An attainment divides the actual by the target. Closed-won revenue attainment is revenue won in the month divided by the monthly target.
An illustrative example, with made-up numbers. A team closes 40 deals in a quarter: 12 won and 28 lost. Win rate is 12 divided by 40, which is 30 percent. The same team had a quarterly target of 300,000 and won 240,000 in value. Attainment is 240,000 divided by 300,000, or 80 percent. Both change if someone reopens a lost deal, which is one more reason the period and the filter belong in the definition.
Write the formula on the KPI definition line, including the period and the filter. “Win rate: won divided by won plus lost, deals closed this calendar quarter, all pipelines” is a definition. “Win rate” alone leaves the denominator open to argument. On the target side of attainment, the words target, quota, goal and forecast each mean something different, and mixing them up shows in the KPI; we untangle them in sales quota vs target vs goal vs forecast.
Three ways a KPI goes wrong, and one check that catches the fourth
Vanity metrics come first. A number that only goes up and never changes a decision is decoration: total contacts in the CRM, lifetime deals created, followers. Ask what you would do differently on Monday if the number dropped by a quarter. If the answer is nothing, it leaves the KPI list.
Then there is having too many, the data overload Databox warns about. With fifteen KPIs the weekly review takes an hour, ends with nobody owning anything, and the owner quietly stops opening the dashboard.
A KPI without an owner is the third. The number goes red and the meeting turns into a search for whose it was. Put one name on each KPI, and let that person say what they will do about it.
The fourth failure is quieter. A KPI changes behavior, which is the point, and sometimes it changes it in a direction you did not want. Reward “proposals sent” alone and reps send proposals to unqualified deals. Reward “deals created” and the pipeline fills with contacts who said hello at a trade show. Our check for every leading KPI is one question asked out loud when it is adopted: what is the laziest way to make this number go up? If the lazy way hurts the goal, pair the KPI with the lagging number it is supposed to feed and review them together. Read next to win rate, a burst of proposals to bad deals shows up as a falling win rate within a month or two.
If you do one thing this week
Write your two or three goals at teh top of a page. Under each, write one lagging and one leading KPI, and next to every KPI put a name, the report it comes from, how often you read it and a one-sentence definition. Anything you cannot fill in that way stays off the list for now. Then pick a date next quarter to look at the page again, and put it in the calendar before you close the document.