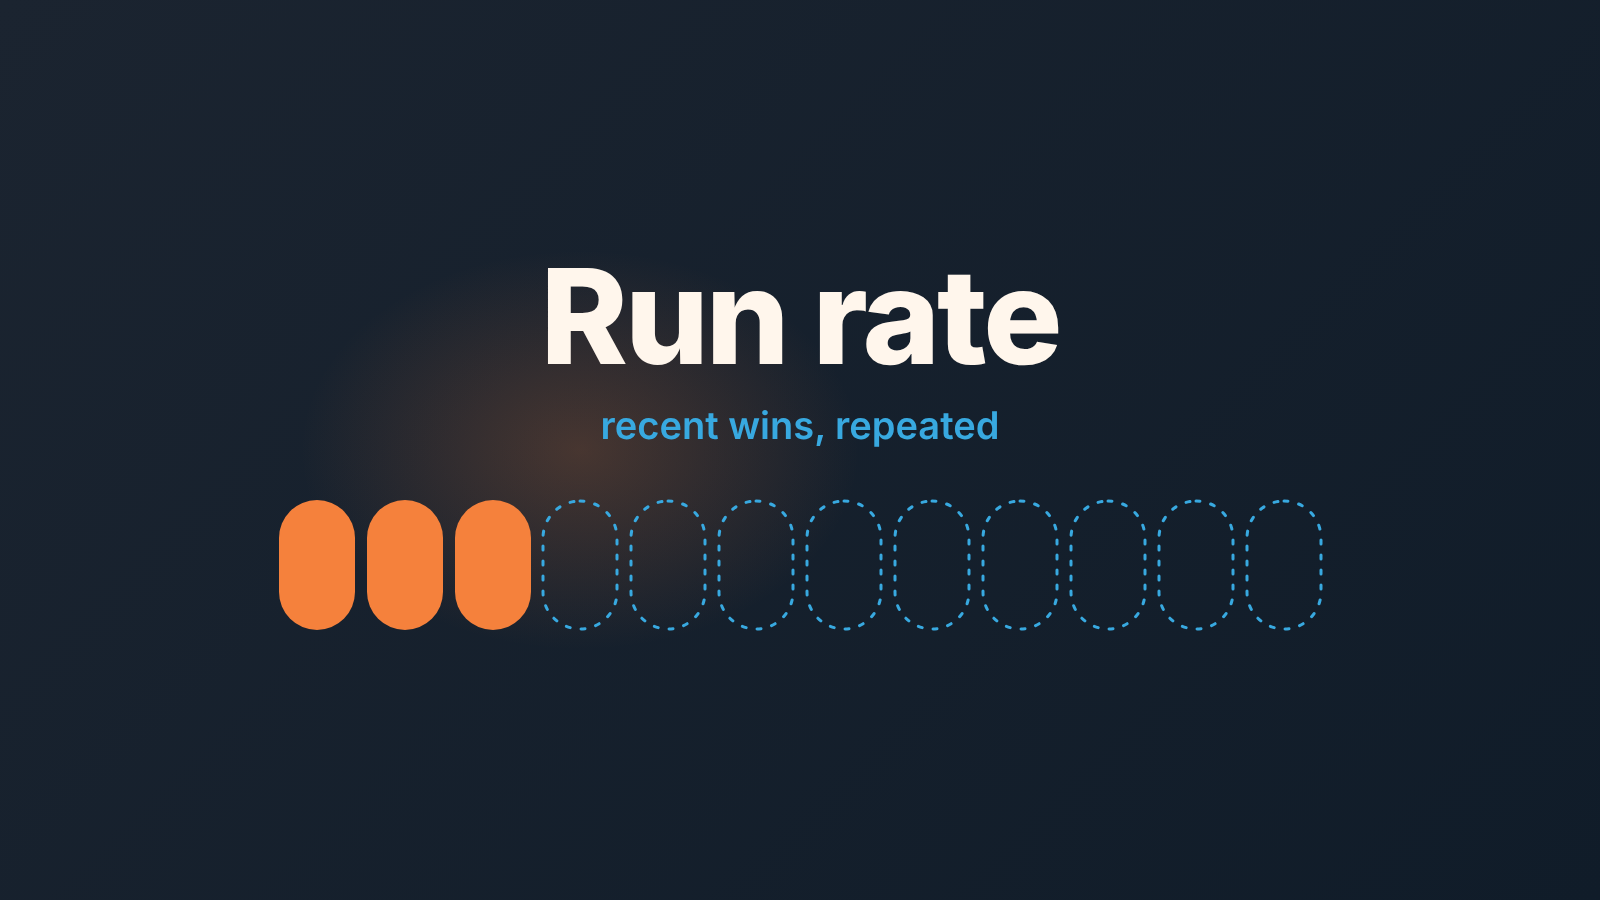
Annual run rate, or run rate revenue, is the revenue of a recent period multiplied up to a year. The formula is annual run rate = recurring closed-won revenue in the period × periods in a year, so you take the last month or quarter of closed-won recurring revenue, multiply by 12 or 4, and leave one-off deals out. It looks only at what you already closed, and it is only as honest as the deal amounts and dates in your CRM.
Run rate is arithmetic on closed deals, not a forecast
Zendesk’s guide calls run rate “a rough estimate of a company’s annual earnings based on monthly or quarterly financial performance data”, and notes that a lot of sales teams rely on it to predict the next 12 months of revenue (Zendesk on run rate and ARR). That is how the number quietly turns into a promise to the bank, the board or yourself.
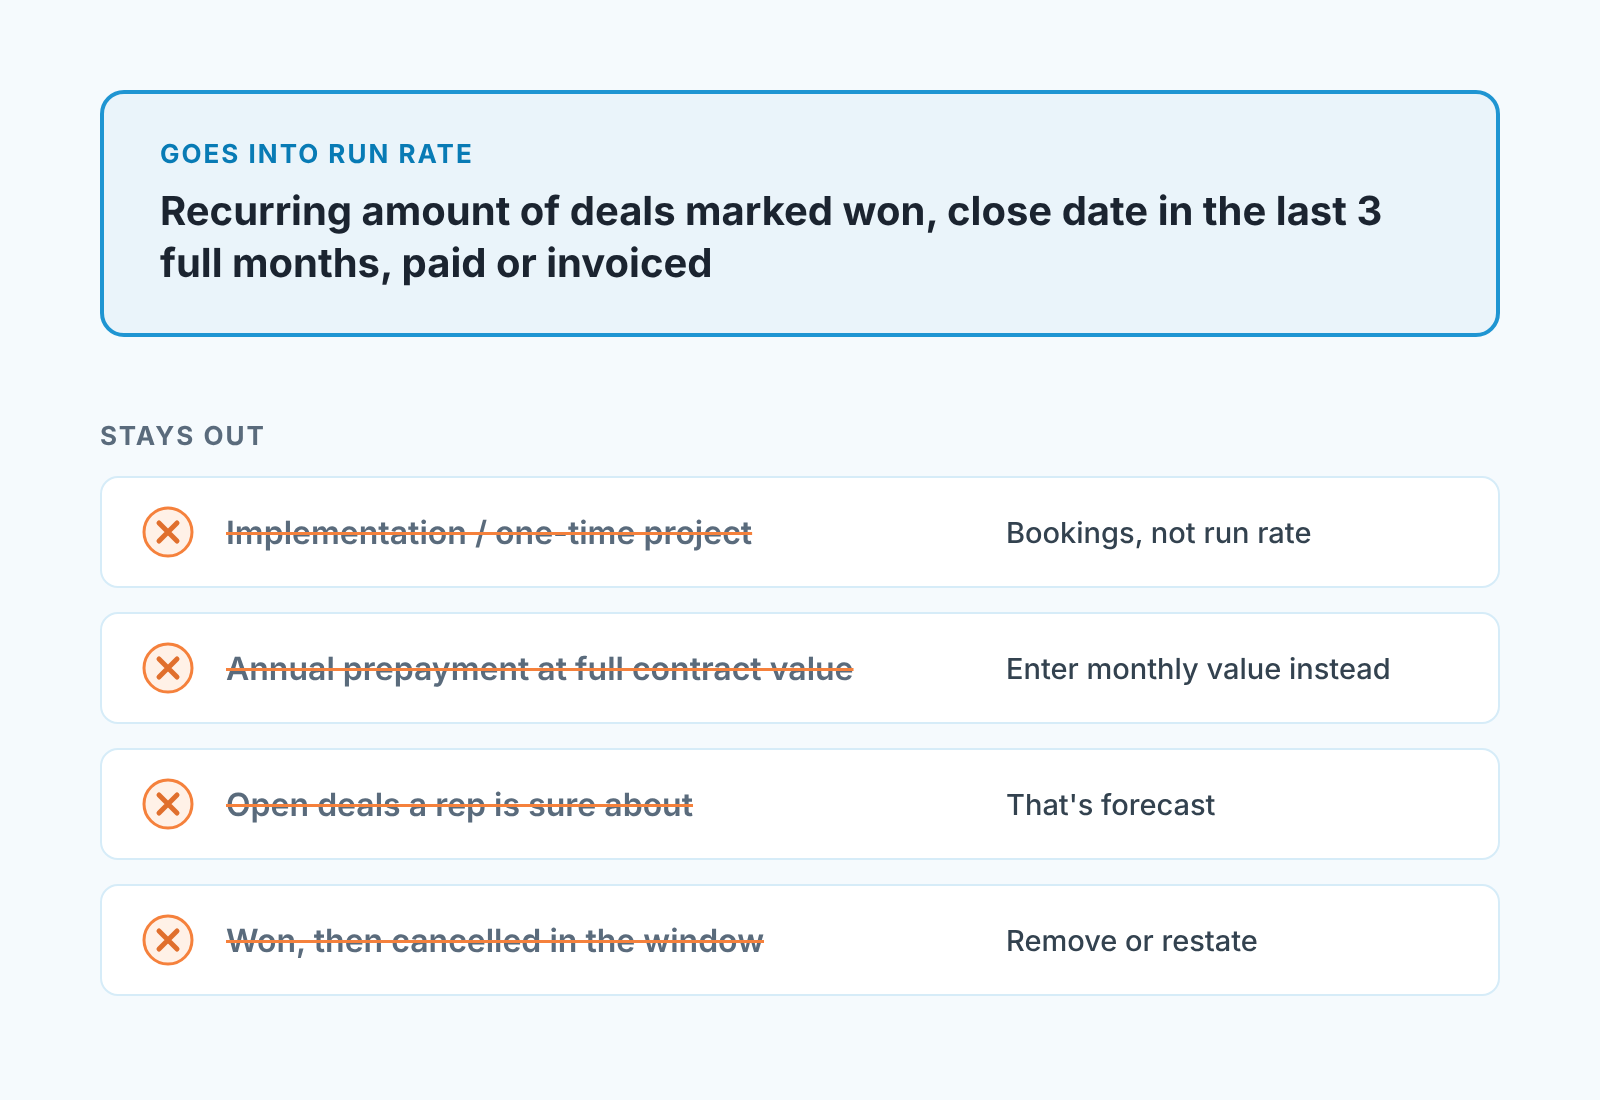
We read it more narrowly. Run rate answers one question: if the business keeps doing exactly what it did in the last period, what does a year of that look like? Nothing from the open pipeline goes in. Only deals marked won, with a close date inside the period. A forecast can be argued with. Run rate can only be wrong if the CRM is wrong, and that you can go and fix. For the recurring part only, the method and what counts are in how to calculate ARR from CRM deals.
How to calculate run rate revenue from CRM deals
The general form: period revenue times the number of periods in a year. The same Zendesk page shows why the period matters: $20,000 in a first month annualizes to $240,000, while the full first quarter, $53,000, gives $212,000. For a small team we use the last three months. A single month is too lumpy.
The steps work the same in whatever CRM you run.
- Filter deals by status “won” and close date in the last three full calendar months. Not “last 90 days”: a partial month at either end distorts the sum.
- Keep only the recurring part of each deal’s amount. If the deal has one amount field and no split, stop and read the section on fields below.
- Sum the recurring amounts, divide by 3, multiply by 12.
A made-up example so the arithmetic is visible. Say July to September closed-won deals in a Pipedrive account sum to 96,000: eleven subscription deals worth 7,000 each in recurring value, plus one 19,000 implementation project. The recurring sum is 77,000, or 25,667 a month. Annual run rate is 25,667 × 12, about 308,000. The number most owners would say out loud is 96,000 × 4, or 384,000. The gap is the implementation project, annualized as if a new one arrives every quarter. Once you have that figure, divide it two ways, as in revenue per employee vs revenue per sales rep, and to see how fast it is changing, take the sales growth rate from CRM closed-won deals month over month.
What to leave out: one-off deals, prepaid annual contracts, seasonal peaks
Three kinds of deals sit in closed-won and do not belong in the numerator.
One-off deals are the easy case, and still the one most teams get wrong, because the the CRM does not distinguish a project from a subscription unless someone made it. An implementation fee or a one-time training is real revenue that does not repeat. Count it in bookings, keep it out of run rate; see bookings vs billings vs revenue in Pipedrive.
Multi-year prepaid contracts are the sneaky case. A customer signs for three years and pays 72,000 up front, so one year of recurring value is 72,000 ÷ 3, or 24,000. If the rep enters 72,000 as the deal amount, step 3 turns that one deal into 72,000 ÷ 3 × 12 = 288,000 of run rate instead of 96,000. The fix belongs in the deal record, where one year of recurring value is stored separately from the contract total. How that looks in HubSpot’s amount, ARR and MRR fields is in HubSpot ARR, MRR and deal amount, and for Pipedrive in recurring products vs installments.
Seasonal peaks are a judgement call, and we think the honest answer is to label rather than adjust. If Q4 is your best quarter every year, a run rate taken in January describes a year of Q4s. Either take the last twelve months of recurring closed-won revenue, which removes the season, or call the number “Q4 run rate” and never let it travel without the label.
One more: a deal won and then cancelled inside the window still reads won if the CRM has no “lost after won” status, so remove it or restate the window.
Three deal fields run rate depends on
If the deal record cannot answer these three questions, the run rate is a guess with a decimal point.
Recurring versus one-time amount. Two amount fields, a product line with a billing frequency, or at minimum a deal type field with the values “subscription” and “project”. Without it, step 2 above is impossible.
The second is the close date, meaning the date the deal was actually won. Ignore the date the rep expected and the date someone finally moved the card. We have seen close dates edited after the fact to make a month look better, and run rate then measures editing discipline. A team rule that nobody touches the close date of a won deal by hand ends the argument.
Payment status. Won is a sales event. Paid is a finance event. A deal that is won, invoiced and unpaid for sixty days is a collection problem wearing a green badge. A yes/no “paid” field or a payment date lets the owner run the report twice, on won deals and on paid deals. If the two drift apart you have found the real number before the accountant does.
Run rate vs ARR vs pipeline forecast
Run rate annualizes recent wins; ARR annualizes all active contracts; a forecast weighs open deals.
Run rate looks back at a window of new wins. ARR looks at the current contract base, including customers who signed two years ago and still pay. A business with slow new sales and loyal old customers has a healthy ARR and a weak run rate. Both are true. The HubSpot piece above defines ARR field by field.
A pipeline forecast is the only one of the three that looks forward: open deals, weighted by stage or probability. The method lives in revenue forecasting for a sales manager and weighted pipeline forecast. The rule for a planning meeting: the forecast decides how many reps to hire; run rate checks whether last quarter’s forecast was right.
How an owner reads it once a month, and when to stop trusting it
Run rate is a monthly ritual we do by hand, away from any dashboard tile. On the first working day of the month we pull three figures: the recurring closed-won sum for the last three months, the same sum for the three months before, and the paid version of the current one. Three numbers on one line in a notes file, with the date. Is the trailing window above the previous one? Is the paid figure opening a gap against the won figure? Whichever moved is the one question for the head of sales this month.
Then there are moments to put the number down for a while.
When one customer is a large share of the window. If a single deal is a third of three months of wins, it is that customer’s run rate; the diagnosis is in customer concentration risk.
When the recurring field is not being filled. Sort won deals by amount and open the top ten. If project fees and subscriptions sit in the same field, the monthly figure is not worth multiplying.
When the window straddles a pricing change, a lost rep or a product launch. Wait a quarter, or shorten the window and say so.
A disclosure: we build SalesBond, a sales management layer on top of the CRM a team already uses; we started with Pipedrive. Its Owner Dashboard gives the owner plan, forecast and the gap to target in one view; run rate is the backward check beside them. If you want to see how your deal data holds up, check your CRM with SalesBond. The arithmetic works just as well in a spreadsheet, as long as the three fields exist.