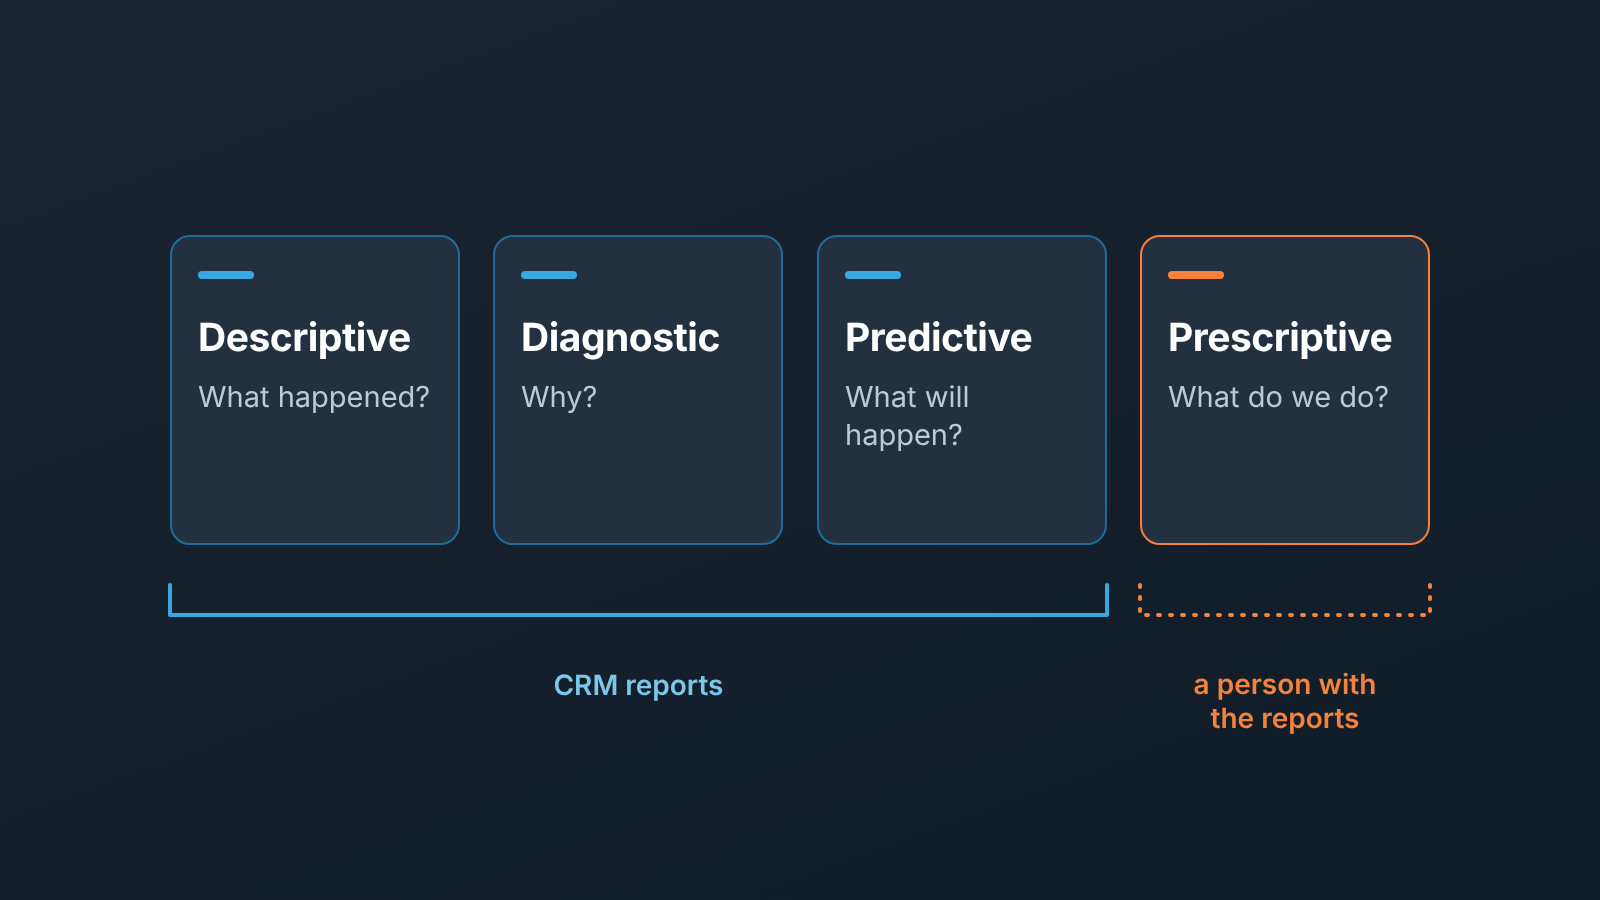
Business analytics is the use of a company’s own data to answer four business questions: what happened, why it happened, what is likely to happen next, and what to do about it. On a small sales team, CRM reports answer the first two and a plain version of the third; the fourth is a person’s call.
In Pipedrive, HubSpot, Salesforce or Zoho CRM, each of the four can be worked from deals, contacts and activities alone, up to a point that is different for each type.
The four types of business analytics, and why INFORMS counts three
Most of what ranks for “business analytics” is written for people choosing a degree or a BI platform. The definitions are fine, but they describe a bank or a retailer. If you run a small sales team, the useful version is shorter: business analytics is asking a question about the business, finding the data that answers it, and acting on the answer.
The question types are where the field disagrees with itself. INFORMS, the Institute for Operations Research and the Management Sciences, divides it into three: descriptive, predictive and prescriptive (Masters in Data Science: What is business analytics?). Most current guides, IBM’s among them, list four: they split “why” out of descriptive and call it diagnostic. We use four below because “what happened” and “why” are different questions with different fields behind them, and in a CRM they are answered by different reports.
What matters more than the count is the order. Each type depends on the one before it. You cannot explain a drop you have not measured, and you cannot forecast from a pipeline whose history you never kept. Small teams that skip to prediction usually end up with a weighted pipeline number nobody believes, and then conclude that analytics is for bigger companies. It isn’t. They started at the wrong end.
Descriptive: what happened last month, in deals and money
Descriptive analytics is the report you probably already open: how many deals closed won, how many closed lost, and how much is sitting open in each stage. It is the most honest report you have, because it only counts.
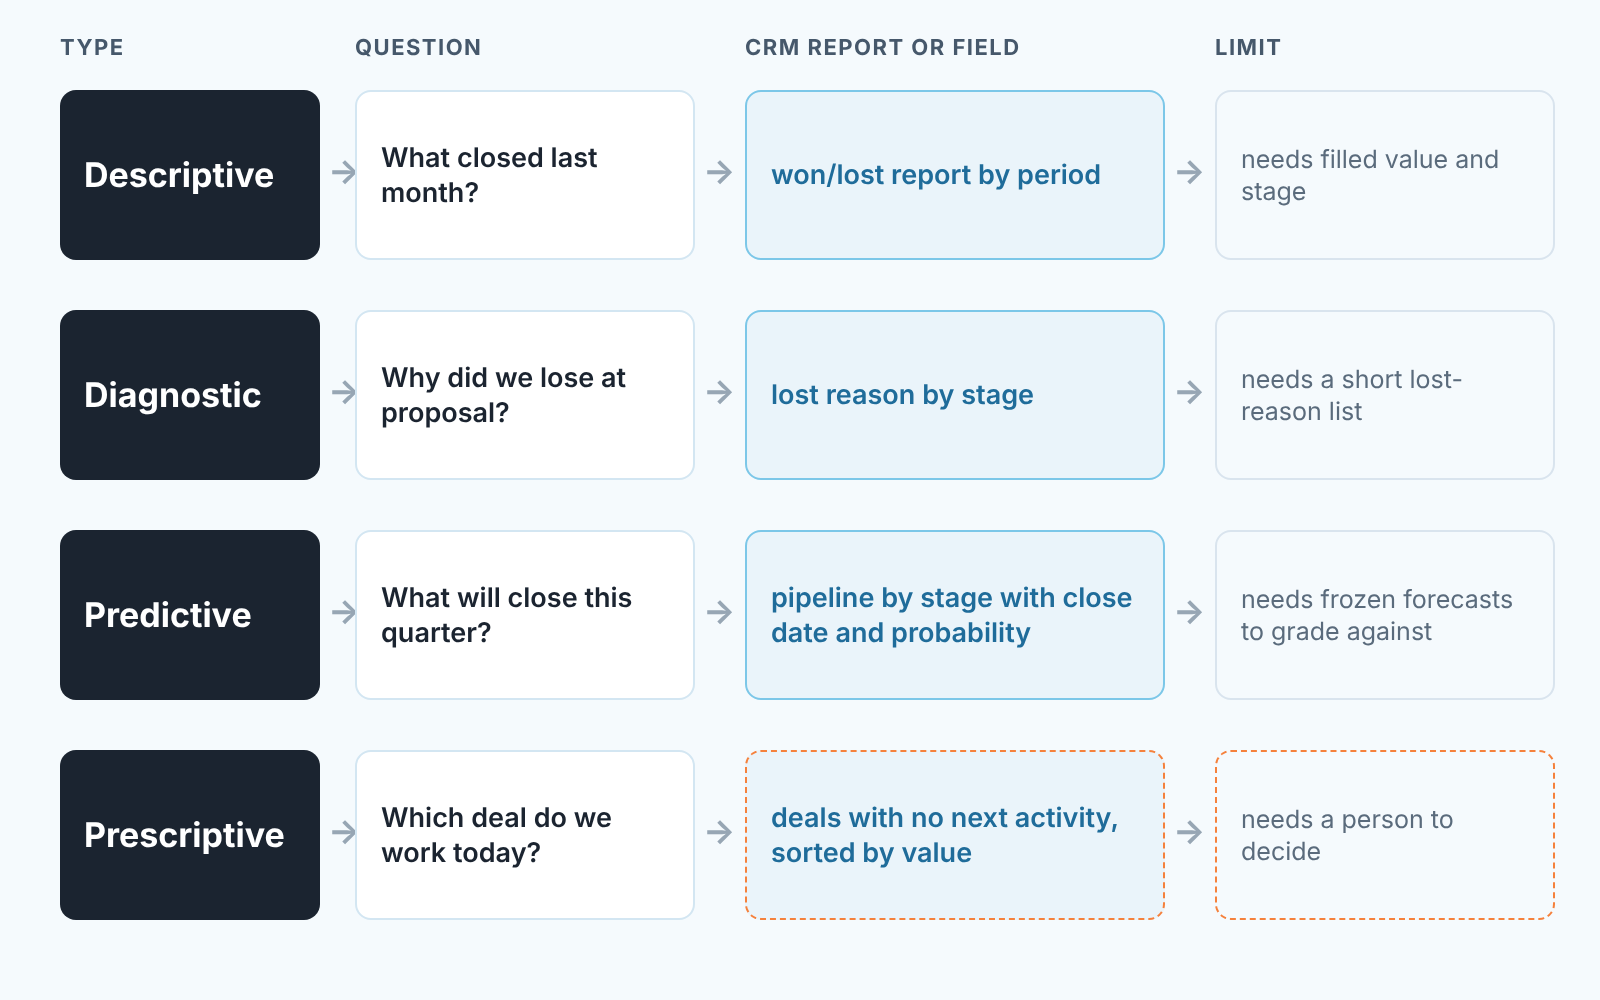
The owner’s question here is “what did we actually do last month?” The report is won and lost deals by period, plus open pipeline by stage with the value summed. The decision it supports is small but real: did we hit the month, and is there enough in the pipeline to hit the next one? If the open value in the last two stages is less than next month’s target, you know that on the first of the month, with weeks to spare.
Two habits turn this from a number into a picture. Look at the same report at the same time every week, so a change stands out. And group by owner as well as by stage, because a team total can hide the fact that one rep’s deals make up most of it. The weekly report set for an owner and a head of sales is a ready cadence for exactly this.
The limit is also the strength: a descriptive report cannot tell you anything the fields do not contain. Deals with no value sum to zero and vanish. Deals parked in the wrong stage make the pipeline look fat where it is thin. So before you read the number read the filter “open deals with no value” and fix those first. Five minutes.
Diagnostic: why we lost, and where deals leave the funnel
Diagnostic analytics answers why. Say a descriptive report shows you lost twelve deals last quarter. A diagnostic report might show that eight of them died at the proposal stage with “price” as the reason, and that is a sentence you can do something with.
This is the type small teams underuse, and almost always for one reason: the lost reason field is empty or free text. “No budget”, “no $”, “budget cut” and “nobudget” cannot be grouped. The fix is a CRM setting, a short predefined list of lost reasons, under ten, with “other” requiring a note. Once that exists, two reports do most of the diagnostic work.
The first is lost reasons by stage. Losses in the first stage are a lead quality conversation, usually with marketing or with whoever qualifies. Losses at proposal are a pricing or qualification conversation with the rep. Same count of lost deals, completely different Monday.
The second is stage drop-off: of the deals that entered stage two this quarter, how many reached stage three? In Pipedrive this is the funnel conversion report (Pipedrive: deal conversion reports); in another CRM, look for a funnel or conversion report, and we wrote up how to read stage conversion rates separately. A sharp fall between two stages tells you where to sit in on calls, and it is a better coaching signal than any score, because it points to a moment in the sale rather than to a person.
Where diagnostic stops in a CRM: it can tell you that a rep’s deals stall after the demo. It cannot tell you what was said on the demo. That needs a call recording or a conversation with the rep, and we would rather you knew the limit than bought a dashboard that pretends otherwise.
Predictive: what will close this quarter, from your own history
Predictive analytics in a small team is the weighted pipeline: each open deal’s value multiplied by the probability of its stage, summed, and read as “what we expect to close”. Pipedrive, for one, shows a weighted total for each stage once stage probabilities are set (Pipedrive: probability in Pipedrive), and any CRM that stores a probability per stage lets you build the same number.
The question is “how much will we close this quarter?” The decision is whether to push harder on the current pipeline, add more at the top, or adjust the target. Fine so far.
Here is the catch. The probabilities in a new CRM are defaults, and a default is not your funnel. In Pipedrive every stage starts at 100% until someone changes it, which quietly inflates the weighted forecast. A forecast is only predictive if the probabilities come from your own history: of the deals that sat in stage three over the last two quarters, what share actually closed? Until you have that history, the weighted pipeline is a tidy way of writing down a guess, and you should treat it as a guess.
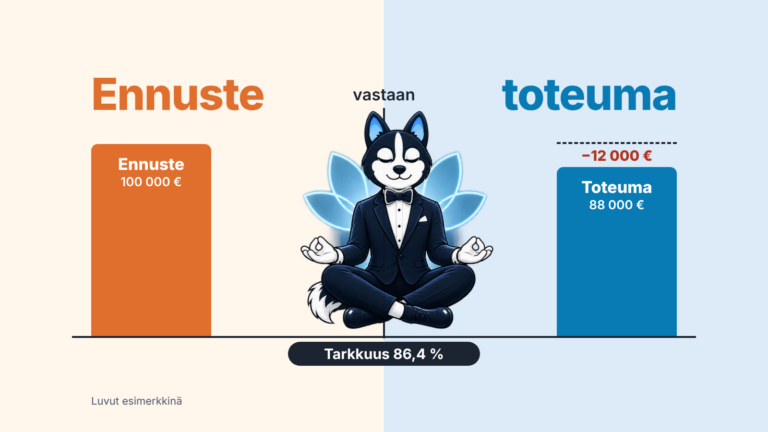
The second trap is that a CRM stores the present. When a rep moves a close date from March to April, the March forecast is gone. If you want to know whether your forecasts are any good, you have to save them on day one and grade them after the quarter; the method and a worked scorecard are in forecast accuracy for small teams. We think this is the single most valuable analytics habit a small team can start, and it costs a spreadsheet column a month.
So: run the weighted pipeline, yes. But run it next to last quarter’s frozen forecast and what actually closed. The gap between the two shows which stage probabilities to correct before the next quarter.
Prescriptive: which deal to work today, and why that is still a human call
Prescriptive analytics answers “what should we do?”, and in a sales team the honest answer is that the CRM can shortlist and a person decides.
The shortlist is a filter: open deals with no next activity scheduled, sorted by value, with the expected close date next to them. That list is the the closest thing a small team has to a prescription. Top of it is the deal to call today. A deal with a demo booked next week is not on it, and should not be; slow is not the same as stalled.
Why not let the CRM decide? Because the data that would make the decision does not live in it. The CRM does not know the buyer is on holiday, that the champion just changed jobs, or that the rep already agreed to call back on Thursday and did not log it. A person with the list open knows those things, or can find out with one message. Automation can nudge: a reminder when a deal has gone quiet for longer than your stage allows, a task created when a stage changes. We like those. They are prompts, and a person still decides.
If the decision is “which deal”, the shortlist above is enough. If the decision is “which rep needs help”, put the diagnostic report (drop-off by stage, by owner) next to the shortlist. The six numbers worth keeping on one screen for that purpose are in a sales dashboard for a manager.
What a small team can do in the CRM, and what honestly needs BI
Descriptive, fully. Diagnostic, mostly, once lost reasons are a list and stages are used the same way by everyone. Predictive, the simple version, with your own probabilities and a frozen forecast to grade against. Prescriptive, as a filtered list that a person reads.
That covers more than most five-person teams will use in a year, and none of it needs a data analyst or a BI licence. We have seen owners spend a quarter choosing a BI tool and then point it at a CRM where half the deals had no value. The dashboard rendered a very professional blank.
When a BI tool does become the right answer is a question of its own, worked through in CRM analytics before you buy a BI tool. Between the CRM’s own reports and a BI project there is a middle layer of tools that read the CRM and do the shortlisting and the history-keeping for you, and we described what sales analytics software adds on top of CRM reports, limits included. The free CRM audit from SalesBond is one example: it reads the last 30 days of the connected CRM and sends a PDF report with money at risk, deal health, the pipeline bottleneck and what to fix.
Data quality before any analytics: the fields that carry all four
Every question above rests on the same handful of fields, and a wrong value on the biggest deal can distort the answer more than a pile of empty ones on small deals. So the clean-up comes down to one filter per question.
Deal value: filter for empty and for suspiciously round. A rep who typed 10,000 to get past a required field has not estimated anything.
Stage: everyone moves deals at the same moment, or stage conversion means nothing. Write the entry rule for each stage in one line and pin it were the team sees it.
Lost reason: a predefined list, short, with a note on “other”. In our experience, free text is why most teams believe they have no diagnostic data.
Expected close date and next activity: the forecast depends on the first, the shortlist on the second. A deal with neither is not in the pipeline, whatever stage it shows.
Owner and source: group by them, and keep source filled from the moment the deal is created.
Read each filter together with the rep. The lists are short in a small team, and the conversation is the clean-up.
FAQ
Is business analytics the same as data analytics?
Close, but the starting point differs. Data analytics is the wider practice of examining data for patterns, in any field; business analytics starts from a business question and uses whatever data answers it, often a standard report. Data science goes further and builds models, which need volume and history a five-person team rarely has. The weighted pipeline above is business analytics.
Is business analytics the same as business intelligence?
Not quite, and the big vendors draw the line differently. AWS describes BI as understanding past performance and business analytics as the forward-looking part, while IBM treats business analytics as a subset of BI. For a small team the useful split is simple: BI shows what happened, and analytics adds why and what next. Whether you need a BI tool for that is a separate question, covered in CRM analytics before you buy a BI tool.
What is the difference between business analytics and sales analytics?
Sales analytics is business analytics applied to one department’s data: deals, activities, conversion and forecast. The four question types are the same; the fields are just the ones in your CRM.
Where should a team with no analyst start?
With descriptive, this week: won and lost by month, and open pipeline by stage, read at the same time every Monday. Add lost reasons as a list the same day. Freeze this quarter’s forecast in a spreadsheet so there is something to grade in three months. Everything else follows from those three.