

To identify your top customers by revenue, sum closed-won amounts per company over the last 12 months, sort from largest to smallest, and count how many companies it takes to reach 80% of the total. The 80/20 rule, also called the Pareto principle, says that roughly 80% of outcomes come from 20% of causes, and in sales that usually means about a fifth of your customers bring most of the revenue. If your count is close to a fifth of your paying customers, the rule holds for you; if it is three companies, you have a different problem, and we get to it below.
What the 80/20 rule means, and what it means in sales
Customers are the obvious place to look for the pattern in a business, but the same lopsided shape turns up in products, in support tickets, in the hours a rep spends on deals that never close. Wikipedia even lists “80% of sales come from 20% of clients” as an adage of business management.
The idea is older than CRM software. Vilfredo Pareto wrote in 1906 that about 80% of the land in the Kingdom of Italy belonged to 20% of the population; Joseph Juran picked the pattern up in 1941 for quality control and later called it “the vital few and the useful many” (Wikipedia: Pareto principle). Juran chose “useful” over “trivial”, and the wording fits sales, because the other 80% of customers are where next year’s vital few come from.
For a sales owner the rule is a question worth asking, with no fixed split. Nobody promises you 80 and 20. Your split might be 70/30 or 90/10. What the exercise gives you is a named list: the companies that, if one of them left, would show up in the P&L. Most owners can guess the top three. Almost nobody guesses the full list correctly, and the surprises are the point.
Two things the rule is not. It is not a reason to drop small customers; a company that buys twice a year for a small amount costs you little and may grow. And it is not a forecast: last year’s top 20% tells you who carried the revenue. Who carries it next year is a separate question.
Finding your 20% from closed-won deals
Every CRM stores the three things you need: a won deal, its amount, and the company it belongs to. So the method is the same whichever one you use. Here is how we do it.
- Pull won deals for the last 12 months. Filter by status won and by a close date inside the period. Twelve months smooths seasonality; a quarter is too short for most B2B teams, because one large deal distorts it.
- Export three columns: company, amount, close date. If your CRM can group won value by company in a report, use that instead of the export. In HubSpot, for example, the custom report builder lets you pick a primary data source, add secondary ones, and set a numeric property as a measure with an aggregation (HubSpot: Create reports with the custom report builder). A spreadsheet pivot does the same job for any CRM.
- Sum the amount per company, one row each.
- Sort descending and add a running total: cumulative revenue divided by total revenue, next to every row.
- Find the row where the cumulative share crosses 80%. Count the rows above it and divide by the number of companies in the list. That is your share.
In Excel or Google Sheets this is a sort and one running-total column, nothing more.
What to sum, though? Revenue from won deals is the one number every CRM can give you today, so start there. Margin is the better measure of who really carries the business, but most CRMs do not store cost per deal, and you will need finance data for it. Deal count answers a different question (who buys often) and is worth running as a second pass.
An illustrative example, with numbers invented for the arithmetic. A team closed 1,000,000 across 50 companies in the year. Sorted, the top company did 180,000, the next 120,000, the third 95,000. By the tenth row the running total reaches 805,000. So 10 of 50 companies, 20%, carry 80.5% of revenue. Textbook. Real lists are rarely this neat, and the lopsided ones are the interesting ones.
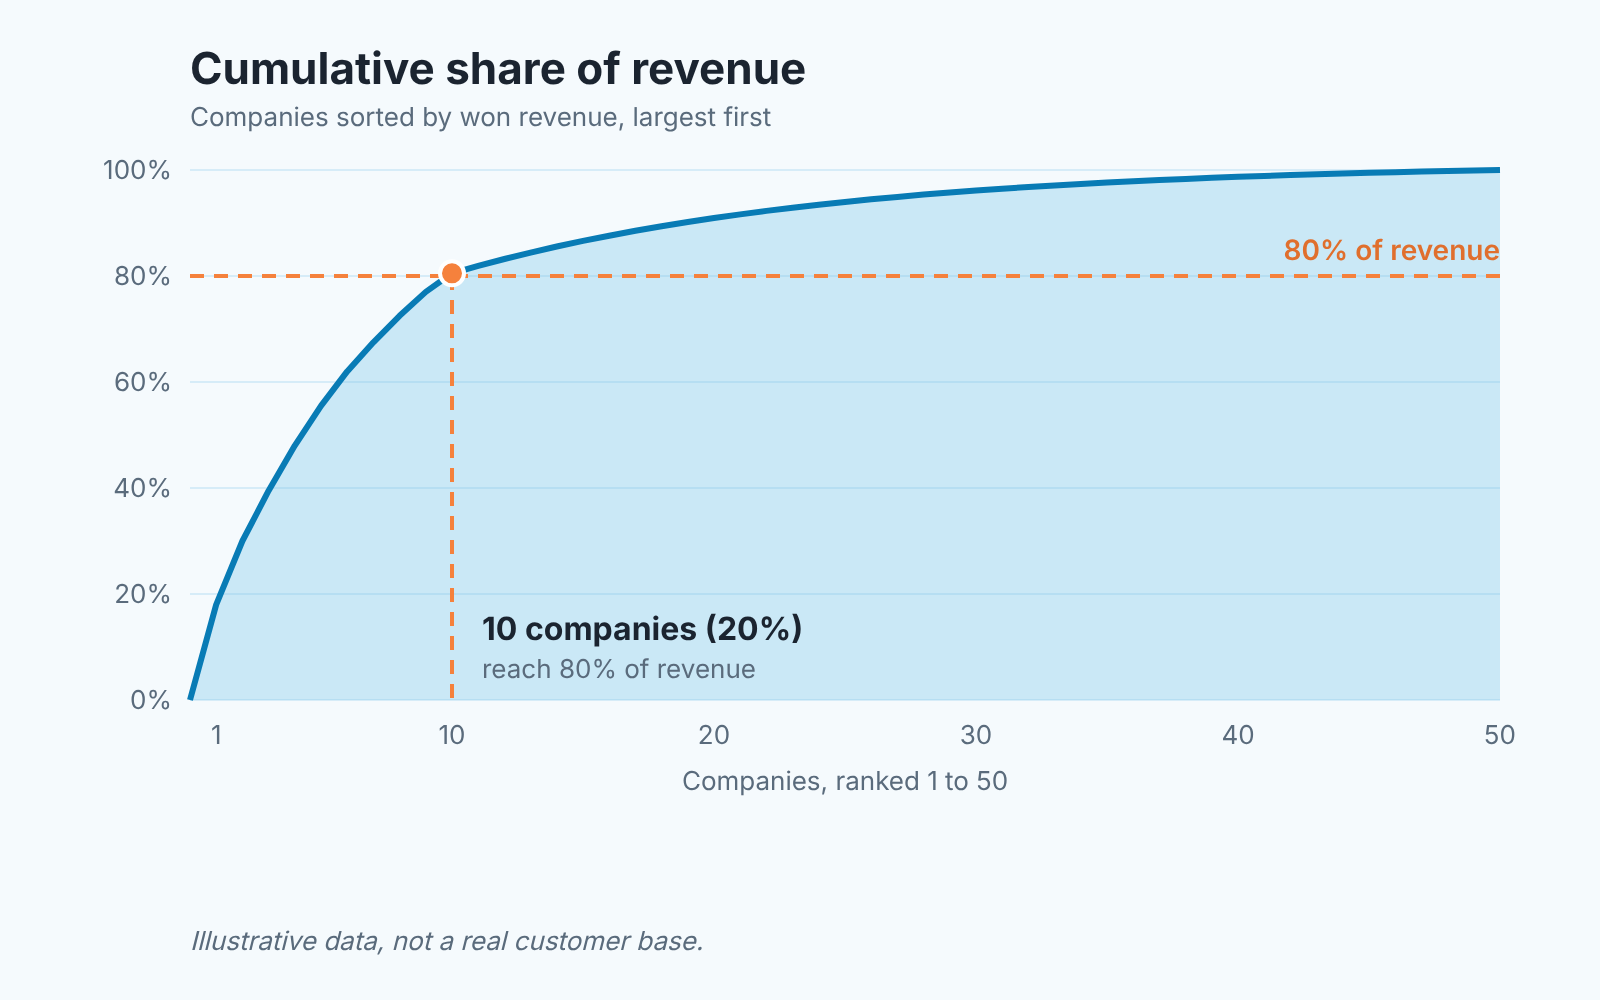
That curve is what people call a Pareto chart. Keep the spreadsheet behind it. You will run this again next quarter, and the movement between runs says more than any single snapshot.
Where the rule breaks
Does the 80/20 rule really work in sales? As a pattern, often enough to have become a business saying. As an exact ratio, rarely. And in four situations the list itself lies to you.
With fewer than about 30 paying customers, the arithmetic still works, but “20%” is now five companies and one deal reshuffles the whole ranking. For a small base the question changes from “who are my 20%” to “how many customers can leave before I miss payroll”. That is a concentration question, and we wrote it up separately: customer concentration risk and how to see it in Pipedrive.
Repeat customers mixed with one-off projects are the second trap. A company that bought one large implementation and will never buy again sits at the top of your list next to a company that reorders every six weeks. Same revenue, opposite meaning. Split the list in two, companies with two or more won deals in the period and companies with one, and run the 80/20 on each. The repeat list is the one you protect. The one-off list is where you look for a second deal. (In SalesBond, Repeat Sales draws this line on its own: one won deal makes a new customer, two or more a repeat customer.)
Then there is revenue booked to the wrong record. If one rep created “Acme Ltd” and another created “ACME Limited”, your biggest customer may be showing as two mid-sized rows. This happens in any CRM where more than one person creates companies, and it is the reason the last section of this article exists.
The fourth one is about the people who handle the accounts. If your top 20% are all handled by one rep, that rep is a concentration risk too. Pair a second person on the biggest accounts before you need to, and make sure deal history and contacts live in the CRM, not in someone’s notebook.
There is a quieter failure as well: comparing deal values when contracts renew on different terms. If won deals carry an annual value in one pipeline and a monthly value in another, normalise before you sort or the ranking is meaningless. Pick one unit, usually annual, and convert.
What to change once you have the list
Not much and that is deliberate. The list is a reason to move where the team’s hours go. The process can stay as it is.
Give every company on the list a named owner, a person whose name sits in the owner field and who knows they are accountable for the account’s next purchase. In most SMB teams this already exists for the top three and quietly stops at the fourth.
Put a review on the calendar. A quarterly business review sounds corporate for a 12-person company, but a 30-minute call with each of your vital few, four times a year, is cheap next to replacing one of them. The agenda is short: what they bought, what changed on their side, what comes next.
Stop discounting to them by reflex. The instinct is to reward big customers with price. We think the better reward is response time and a person who answers the phone; price cuts on your largest accounts take the most money off the the table and are the hardest to reverse.
Look at the ten rows just below the line. These are the companies one deal away from the top group. Many of them buy from you occasionally and from someone else regularly. A rep with ten such names and one question (“what do you buy elsewhere that we also sell?”) usually finds more revenue than a rep with a hundred cold leads.
And leave the long tail alone, in the best sense. Serve it with the lowest-touch process you have, keep it in the CRM, and watch for the companies whose order size is climbing; ARPU for a B2B sales owner covers revenue per account, which is where a climbing order size shows up first.
Fields that have to be clean before the number means anything
The 80/20 list is only as good as the company field on your won deals. Before you trust it, check four things.
One company, one record. Search for duplicates by name and by domain, then merge. Until this is done the sum per company undercounts your real top accounts and makes revenue look more spread out than it is.
Every won deal linked to a company. Deals attached only to a contact, or to nothing drop out of the sum silently. Filter won deals where the company field is empty and fix the link.
Amount filled, in one currency. A won deal with an empty or zero amount is revenue you earned and cannot see. If you sell in two currencies, pick a reporting currency and make sure either the CRM or the export converts.
Close date set to when the deal was actually won. Deals won in January and moved to won in March land in the wrong period, and for a 12-month window that matters at the edges.
To see how much of this cleaning is ahead of you, run the free CRM audit we built into SalesBond. It looks at the last 30 days of the connected CRM and sends a PDF with a CRM score, money at risk, repeat customers, the top-10 clients and a list of what to fix; a week later a second PDF shows what changed. The top-10 clients are the head of your list, read from the CRM as it stands. If a customer you expected is missing, or appears twice, you know where to start. Check your CRM with SalesBond, or read what a 30-day CRM check finds first. The full 12-month split is still the spreadsheet exercise above.
So, this week: export last year’s won deals, build the running total, and write down the names above the 80% line. Then sit with your reps and ask who spoke to each of those companies in the last month. Wherever the answer is a shrug, that is your first job next quarter. If the CRM is too thin to run the export at all, start with what a CRM is, for a sales team; if you want SalesBond watching the data with you, sign up for SalesBond.


