
ARPU is average revenue per user: total revenue for a period divided by the number of users, subscribers or units in that period (Wikipedia). In B2B, where one customer is a company with several people in it, the useful version is revenue per account, usually called ARPA: ARPA = closed-won revenue in the period ÷ accounts with a won deal in the period, counting one-off and repeat deals alike. It is a different number from your average deal size, and you can calculate it from the CRM you already have, as long as your company records and deal amounts are clean.
ARPU vs ARPA: one formula, two denominators
ARPU divides revenue by users; ARPA divides the same revenue by accounts. That’s the whole difference. Telecom made the metric famous, and Wikipedia’s ARPU entry notes that carriers usually count by the month, divide by subscribers, and argue mostly about which revenue lines belong in the top half (in mobile telephony, for example, revenue from incoming calls is included). “Revenue per client” is the B2B owner’s plain-English name for ARPA. For a sales team, a client is a company that signed, so the account version is the one that fits.
Per account, not per user: three ways to define “account”
Decide what sits in the denominator before you divide. We have seen three definitions in small B2B teams, each giving a different ARPA from the same CRM.
Counting contacts is the consumer habit, and its the wrong choice for most B2B teams. A company that buys through three people shows up as three accounts, and your ARPA drops by two thirds for no business reason. It only works when the person really is the customer, say a freelancer buying for themselves.
Counting companies is the default we recommend: every organization record with at least one closed-won deal in the period. It matches how the owner thinks (“we have 40 customers”, not “we have 112 contacts”). It needs one thing from the CRM, deals linked to an organization and not only to a person.
Then there is the seat. Count paid units (seats, locations, devices) and you get ARPU in its original form, which is right for a team that sells per seat and wants to see price per unit drift. It says nothing about what a relationship is worth, because one customer with 50 seats and ten customers with 5 seats look identical.
Pick one, write it next to the number and don’t switch mid-year. The company definition belongs in the owner’s report; the seat definition belongs in a pricing review.
The formula and a worked example
Revenue per account (ARPA) = closed-won revenue in the period ÷ distinct accounts with at least one closed-won deal in the period
Two decisions hide in that formula. The period: a month is noisy for a team that closes fifteen deals, a quarter is usually readable, a year hides the trend. And “revenue in the period” means the amount of deals won in the period, which is what the CRM can give you. It is not invoiced or collected cash, and if finance keeps a different number, say so in a footnote.
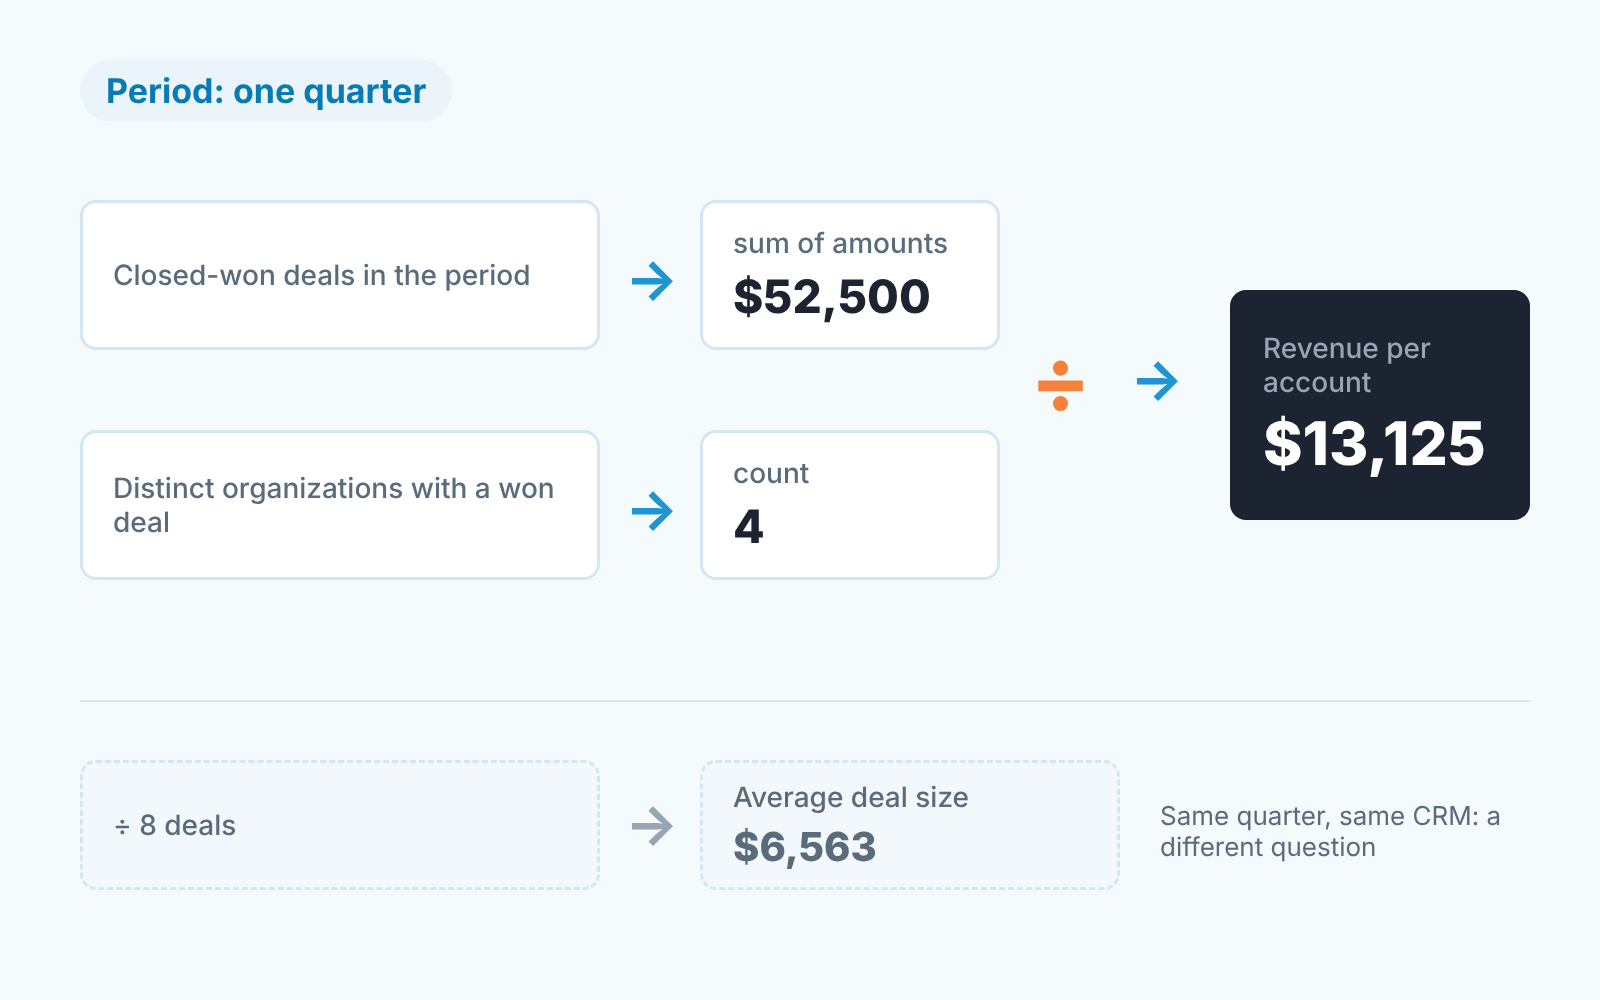
An example for one quarter, with made-up numbers and each company counted as one account. These are illustrations only, so do not benchmark against them.
| Account | Deals won in Q3 | Revenue in Q3 |
|---|---|---|
| Northwind | 1 new deal | $18,000 |
| Harbor Clinic | 3 reorders | $7,500 |
| Delta Print | 1 new deal, 1 reorder | $24,000 |
| Oakline | 2 reorders | $3,000 |
| Total | 8 deals | $52,500 |
Average deal size is $52,500 ÷ 8 = $6,563. ARPA for the quarter is $52,500 ÷ 4 = $13,125. Same CRM, same quarter, two numbers that differ by a factor of two. Neither is wrong. They answer different questions.
ARPA vs average deal size vs lifetime value
Average deal size describes one transaction. Watch it when you change pricing, packaging or who the reps call on; it moves fast. Revenue per account describes one customer relationship per period. Watch it when you want to know whether the team sells deeper into accounts it already has. It moves slowly.
The two can move in opposite directions. If reps close many small reorders with existing customers, deal size goes down and ARPA goes up. That is a healthy quarter, and a dashboard that only shows deal size will call it a bad one.
Customer lifetime value is the the third number people mix in: the revenue one customer produces over the whole relationship, across every period. The historical version is the sum of a customer’s won deals, and we have written up how to calculate historical LTV from the CRM separately. Subscription businesses have a fourth cousin, recurring revenue: what counts as ARR from CRM deals is its own question, as is how deal amount relates to MRR and ARR in HubSpot.
So what is a good ARPU? We found no universal benchmark worth quoting. Compare this quarter with your own last four. On the owner’s page, keep ARPA for the period and deal size next to it; lifetime value is a planning number for the quarterly review.
Pulling it from the CRM
Pulling it needs nothing more than the reports Pipedrive, HubSpot, Salesforce or Zoho CRM ship with: two filtered lists and a division.
The first list is closed-won deals with a won date inside the period. Filter by status won, won time between the period’s start and end, and the pipelines that carry real sales (leave out an internal pipeline, or include it on purpose and say so). Sum the amount column.
Should one-off deals count, or only recurring revenue? For a sales owner’s report, both. A one-off project and a renewal are both revenue from the account in the period, and leaving out reorders turns ARPA back into average first-deal size, a different metric. A recurring-only figure is ARR or MRR per account, which is a separate calculation.
The second list is the same deals grouped by organization. Count the distinct organizations: that is your active accounts for the period. A customer who paid in Q2 and bought nothing in Q3 is not in the Q3 denominator. That is the point of a per-period number, and it is also why ARPA alone will not show you a shrinking customer base; read the churn figure next to it (B2B customer churn from closed-won data).
Then divide, and label the result “revenue per account, Q3, won deals, company definition, sales pipelines only”. That footnote is what lets you compare Q3 with Q4 and trust it. If deals come in more than one currency, check the report’s exchange rate first.
Four mistakes that distort it
Duplicate companies come first and are the most common. “Delta Print”, “Delta Print Ltd” and “delta print” are three organization records and one customer. Each duplicate adds one to the denominator and lowers ARPA. Merge them before you divide, or export the organization list sorted by name so near-matches sit together.
Closed-won deals without an amount come second. Every CRM lets a rep mark a deal won with the amount field empty, and some teams do it on purpose for “paperwork” deals. Those deals add to the account count and nothing to revenue. Pull the won list with amount blank or zero and fix those first. In SalesBond, Deal Health checks every deal against rules that include a Data category, so gaps in deal data show up on the deal itself rather than in a strange average a quarter later.
Edited amounts are the quietest. A deal is won in September for $20,000; in November someone changes the amount to $12,000 after a scope cut, or to $0 after a cancellation. The won date stays in September, so last quarter’s ARPA has changed without anyone recalculating it. We think the won amount should be frozen at the won date, with later changes in a separate deal or a note. If your CRM can lock the amount field on won deals, do it.
The wrong period is the fourth. Mixing created date with won date moves deals between periods, and so does a deal won at 11 pm on the last day of the quarter that lands in the next one because of time zones. Use the won time, in one time zone, every time.
What to do with the number
ARPA on its own is a curiosity. Split, it starts telling you things.
Splitting ARPA by segment is one cut; the 80/20 rule for a sales owner is another, and it shows which accounts carry the average.
Split it by new vs repeat accounts first. Revenue per new account tells you what a first deal is worth, revenue per repeat account tells you what an existing relationship produces. For many small B2B teams the second is the larger number, and the gap between them is the clearest argument for giving reps time on the existing base instead of only new leads. If you want to see which existing customers are late for their usual reorder, that list is what Repeat Sales in SalesBond shows: each customer’s buying cycle and whether the next purchase is on time, overdue or probably not coming.
Then split by segment: company size, industry, product line, the rep who owns the account. The point of the split is to see where selling effort returns more than it gets today. A segment with high ARPA and few accounts is often the one nobody prospects on purpose.
Read it next to deal size, the conversion rate you decided to track and revenue per sales rep. A change in how deals are entered can move any one of them; together they tend to catch each other.
Check the data before you divide
The four mistakes above are a data audit, and SalesBond runs one for free. The CRM audit looks at the last 30 days of the connected CRM and sends a PDF report with money at risk, your repeat customers and the top-10 clients by revenue, among other things. Seven days later a second PDF shows what changed. It does not calculate ARPA for you. It shows how clean the data under the number is, so the figure you compute afterward is one you can defend.
If your next quarterly review is coming up, check your CRM with SalesBond first, then pull the two lists and divide.


