
Customer churn is the share of customers (or of their revenue) you had at the start of a period that did not buy again by the end of it. The textbook formula is customers lost divided by customers at the start of the period, times 100 (ZoomInfo: how to calculate churn rate). The problem for a B2B sales team without subscriptions is the word “lost”. Nobody cancels. A customer just stops placing orders, and your CRM records nothing, because nothing happened. So you have to define “lost” yourself, for example no won deal for longer than that customer’s usual buying cycle, and then count it from the closed-won history that is already in the CRM.
This is for the owner or head of sales of a small B2B team that sells repeat business through deals with no billing plan behind them: distributors, agencies, manufacturers, service firms with reorders. If you have monthly invoices and a cancel button, the SaaS guides already cover you.
Churn without subscriptions is an absence, not an event
In a subscription business churn is a row in the billing system: a cancellation on a date, with an amount. Most churn guides are written from that row.
In deal-based B2B the row does not exist. Your CRM has won deals with a close date and a value, and lost deals with a lost reason. It does not have “the customer who used to order every quarter and has not called since March.” That customer sits in your company list looking exactly like the the one who ordered last week.
So the first decision is a rule; the formula comes later. How long can a customer go without a won deal before you stop counting them as yours? Logo churn, revenue churn and the yearly number for the owner all follow from that answer, so a wrong rule spoils all three. Read from the other side, the same rule shows your loyal customers in B2B, the ones who come back for a second and third order.
Logo churn and revenue churn answer different questions
Logo churn counts lost customers; revenue churn weighs them by what they spent.
The logo version tells you how often the relationship fails. Forty customers on January 1, seven gone by December 31: 17.5 percent (illustrative numbers). For revenue, ZoomInfo divides recurring revenue lost by recurring revenue at the start of the period (ZoomInfo). You have no recurring revenue line, so the honest substitute is each customer’s closed-won total over the previous twelve months.
Logo churn is the coaching number. A rep who loses four small accounts in a quarter has a habit, and habits are cheap to fix early. Revenue churn is the owner’s number: it says whether the customers who left were the ones paying the rent. The two can disagree by a lot. Seven small accounts gone is 17.5 percent of logos and a rounding error in revenue; one anchor customer gone is 2.5 percent of logos and a bad year. If you don’t know yet which accounts could move revenue churn on their own, customer concentration risk is the companion read.
Someone will ask how this compares with gross revenue retention. Not directly: GRR is a subscription metric built on recurring revenue and contract changes, covered in gross revenue retention for Pipedrive teams. The trailing-twelve-month figure is the closest a deal-based team gets; label it that way in any report for a bank or an investor.
Define “lost” from the customer’s own buying cycle
The rule we use: a customer is lost when the time since their last won deal is longer than twice their usual buying cycle.
Why their own cycle and not one company-wide cutoff? Because a distributor that reorders every six weeks and a client that buys an annual project are both your customers. A single 90-day cutoff calls the first one lost too late and the second one lost while they are perfectly on schedule. With the customer’s own cycle, one rule covers both: the annual buyer counts as lost after about two years without a won deal, the six-week one after about twelve weeks.
The cycle is the median gap, in days, between a customer’s won deals. It needs at least two won deals to exist. Three or four gaps give a median you can trust; two give a guess, so treat it as one.
Why twice? One cycle past the expected date is “late”, and late customers are a sales task. Someone should call. Two cycles past is where we draw the line: by then the call is a win-back, and the customer belongs in the churn count. The threshold is a judgement call. A team with very regular reorders can tighten it to 1.5; a team with lumpy project work may want 2.5. Pick one, write it down and keep it between reports, because churn is only useful as a trend. For the same reason, a customer who comes back after being counted as lost stays in that period’s churn and shows up as a win-back in the period they returned.
Customers with a single won deal have no cycle. Don’t force them into the churn count, and don’t quietly drop them either. Report them as a separate line, “new, no repeat yet”, with the oldest first-purchase date. A team whose new-customer line grows while the repeat base shrinks has a different problem from a team losing long-standing accounts, and one churn number would hide it.
This is the rule we built into our own product. We build SalesBond, a sales management layer on top of the CRM a team already uses; we started with Pipedrive. Its Repeat Sales product, called Customer Health before the rename, works out each customer’s buying cycle from won deals and marks them on track, overdue past one cycle or leaving past two, with no score and no prediction. Check your CRM with SalesBond to see your own base sorted that way, or keep to the spreadsheet version.
How to calculate customer churn rate: a worked example
Customer churn rate is customers lost during the period / customers at the start × 100; revenue churn does the same division with their trailing twelve-month closed-won revenue.
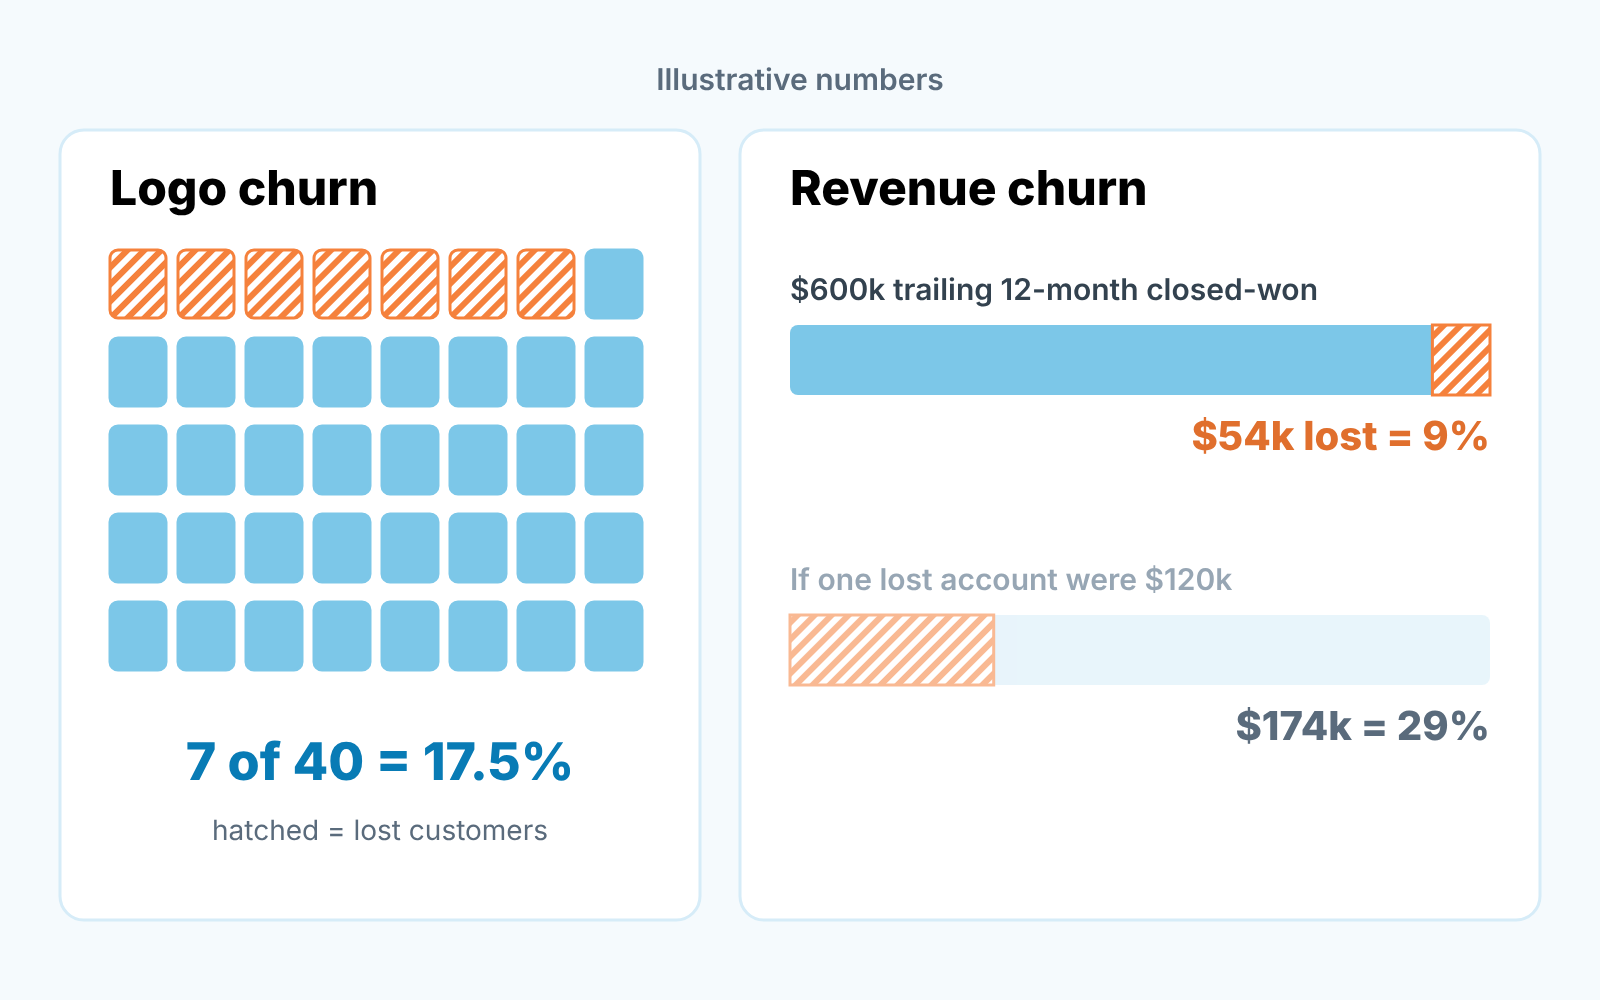
All numbers in this section are illustrative and made up.
On January 1 you have 40 active customers: each has at least two won deals, and their last won deal falls within two cycles of today. Together they produced $600,000 of closed-won revenue in the previous twelve months.
During the year you also win 9 brand-new customers. They stay out of the denominator. ZoomInfo’s rule holds for SaaS and for us alike: do not include customers acquired during the period in the starting count (ZoomInfo). Mixing them in makes churn look better in exactly the quarter when new business is hiding a retention problem.
On December 31 you run the rule. Seven of the original 40 are more than two cycles past their last won deal. Logo churn: 7 ÷ 40 × 100 = 17.5 percent for the year.
Those seven bought $54,000 in the twelve months before January 1. Revenue churn: 54,000 ÷ 600,000 × 100 = 9 percent.
Now the uncomfortable version. Suppose one of the seven had been your $120,000 account instead of a $12,000 one. Logo churn stays at 17.5 percent. Revenue churn becomes 162,000 ÷ 600,000, or 27 percent. Same number of lost relationships, three times the hole in next year’s plan, which is why the owner should see both numbers on one page.
Put one more line on that page: how many of the 9 new customers bought a second time by year end. It isn’t churn. It tells you whether this year’s new business will still be here in two years.
And if you track churn monthly and someone asks for the annual figure, don’t multiply by twelve. Churn compounds on a shrinking base: annual churn = 1 − (1 − monthly churn)^12, so 5 percent a month comes to about 46 percent a year, where multiplying would give 60 (ZoomInfo). For a deal-based team the yearly view wins anyway. A customer on a five-month cycle can’t be “lost” within one month under the two-cycle rule, so monthly churn shows zeros and then a spike that belongs to decisions made ten months earlier.
The four fields you need, and the one most teams get wrong
All of this runs on an export of won deals and a pivot table. You need four fields. The company: the organization or account record, because contacts change jobs and the account is what reorders. The won date, the day the deal was marked won (not the created date or the expected close date); two consecutive won dates give one gap. The deal value, in one currency, since mixed currencies quietly break the revenue number. And the owner, so you can cut churn by rep: logo churn by owner is the coaching report, revenue churn by owner shows where the risk sits.
The one most teams get wrong is the company. A pivot that shows 400 “customers” for a team that knows it has about 120 is telling you the company field was optional for too long. Every deal created against a person with no company attached becomes a customer of one. Merge the duplicates and attach the orphan deals before you count anything; its the cheapest moment to do it. A churn number computed on the dirty list will be wrong in a direction you cannot predict.
Then one filter: which pipelines count as purchases. If support renewals or small add-ons run in a separate pipeline, decide whether a won deal there resets the clock. We say yes if the customer pays for it, no if it is a zero-value administrative deal. Write the decision down next to the threshold.
What churn cannot tell you
Churn tells you how many customers left and how much they took. It says nothing about why, and “we lost seven, so pricing must be off” is a guess dressed as analysis.
The reasons are not in the churn report, and for a customer who drifted away they are often nowhere in the CRM. A lost reason gets filled when a rep marks a deal lost. A customer who simply stopped ordering had no open deal, so there is no lost reason for thier departure.
The fix is a little paperwork. When the Monday list moves a customer into “lost”, the account owner opens a deal for the expected reorder and marks it lost with a real reason. Keep the reason list short, because a dropdown with 23 options produces “Other” as the top answer; we wrote up how to set one in HubSpot’s closed-lost reason, and the logic carries to any CRM. What to do with the customers who are gone is a separate topic: winning back churned customers.
The Monday list, and who owns the number
Churn is reported quarterly or yearly. The list that prevents it is weekly: fifteen minutes every Monday.
- Pull customers past one cycle with no won deal and no open deal. They are overdue, and each gets a call or a visit from the account owner this week. A conversation, in person or by phone.
- Pull customers past two cycles. They move into the lost count for the period, and the owner logs the reorder deal with its lost reason.
- Check the new-customer line: anyone with a single purchase who is past the company’s median cycle gets the same call as an overdue customer.
Ownership splits in two. The account owner owns the action on every name on the list. The head of sales owns the number: the threshold, the definition of a purchase, the quarterly report and the trend. When the business owner asks “what is our churn?”, the head of sales should answer with a percentage, the rule behind it and the three accounts that moved it most. If the answer is a percentage alone the rule has not been written down yet.
FAQ
Is customer churn the same as customer attrition?
In practice, yes. ZoomInfo notes that churn rate is sometimes called customer attrition rate (ZoomInfo), and in a sales meeting the two mean the same thing. Pick one word for your reports so nobody wonders whether they are two metrics.
What is a good churn rate for a B2B team like ours?
We have no sourced benchmark for deal-based B2B and will not invent one. The published tables, ZoomInfo’s included, are organized by SaaS and subscription segment and measure cancellations, which you don’t have. Your useful benchmark is your own trend: this year’s rule applied to last year’s data, then the same rule every year after.


