

The Rule of 40 is a benchmark for subscription businesses: your yearly revenue growth rate plus your profit margin should add up to at least 40%. Take the growth half of that sum from the closed deals in your CRM, and take the margin half from your accounting.
Most explanations stop at the formula and are written for a CFO. I wrote this one for the owner who also runs sales, or who has a head of sales reporting to them, and wants to know which records produce the growth figure and how much of it the team can change.
What the Rule of 40 says (and who it was made for)
The rule adds two percentages. One is how fast revenue grew over the year. The other is how much of that revenue was left as profit. If the two together reach 40% or more, the company clears the bar (Recurly: Rule of 40).
It was written for software and subscription companies, and that origin matters more than the number 40. In a subscription business, revenue repeats. A customer signed in March is still paying next March unless they cancel, so growth in one year carries into the next and a single percentage describes it fairly.
The useful part for an owner is the trade the rule allows. Recurly’s example is a company growing 60% a year, which can lose the equivalent of 20% of revenue and still pass, because 60 minus 20 is 40. Cube shows the opposite end: a company shrinking by 5% with a 45% margin also lands on 40, and Cube calls the rule a metric for evaluating how sustainable the business is (Cube: Rule of 40).
The Rule of 40 formula, line by line
There are three lines to it.
- Growth rate = (ARR (annual recurring revenue) at the end of the year − ARR at the start) ÷ ARR at the start.
- Profit margin = profit for the same twelve months ÷ revenue for the same twelve months.
- Rule of 40 score = growth rate + profit margin, both written as percentages.
Two decisions sit inside those lines, and both belong to you. The first is which profit figure to use. No accounting standard fixes it. Cube recommends EBITDA margin, Fuelfinance names EBITDA as the baseline Brad Feld suggested, and Recurly lists EBITDA, free cash flow and operating margin as the common choices. Pick one with your accountant, write it down and use the same one every year, because two scores built on different margins can’t be compared. We have a separate piece on where revenue and profit each live, so I will leave the margin side there.
The second decision is what counts as “revenue” in the growth line. For a subscription company I would use ARR built from deals. Invoiced revenue moves with billing dates, prepayments and one-off setup fees. None of those tell you whether the subscription base got bigger.
Where the growth number lives in your CRM (new, expansion, churned)
Open your CRM and look at won deals for teh last twelve months. The growth rate comes out of three piles of records, and most CRMs can separate them if the team has been tagging deals with any discipline.
New ARR is the yearly value of won deals from customers who had never bought before. You need the won date and a deal value that means “per year”. If reps type the full contract value of a three-year deal into the amount field, the pile is inflated before you start. Our guide on what counts as ARR in CRM deals covers the cleaning rules.
Expansion ARR is the added yearly value from customers who already pay you: more seats, a higher plan, a second product. You can only count it if upsells are logged as their own won deals, with a deal type or label that marks them. When an account manager edits the amount on the original deal, the expansion disappears into history and nobody can count it later.
Churned ARR is the yearly value of subscriptions that ended, plus the value lost on downgrades. Most CRMs hold this pile worst. A new sale produces a won deal. A cancellation often produces an email to support and nothing else. If you run renewals as deals in their own pipeline a lost renewal is your churn record. If you do not, you will be pulling this figure from billing and reconciling it by hand.
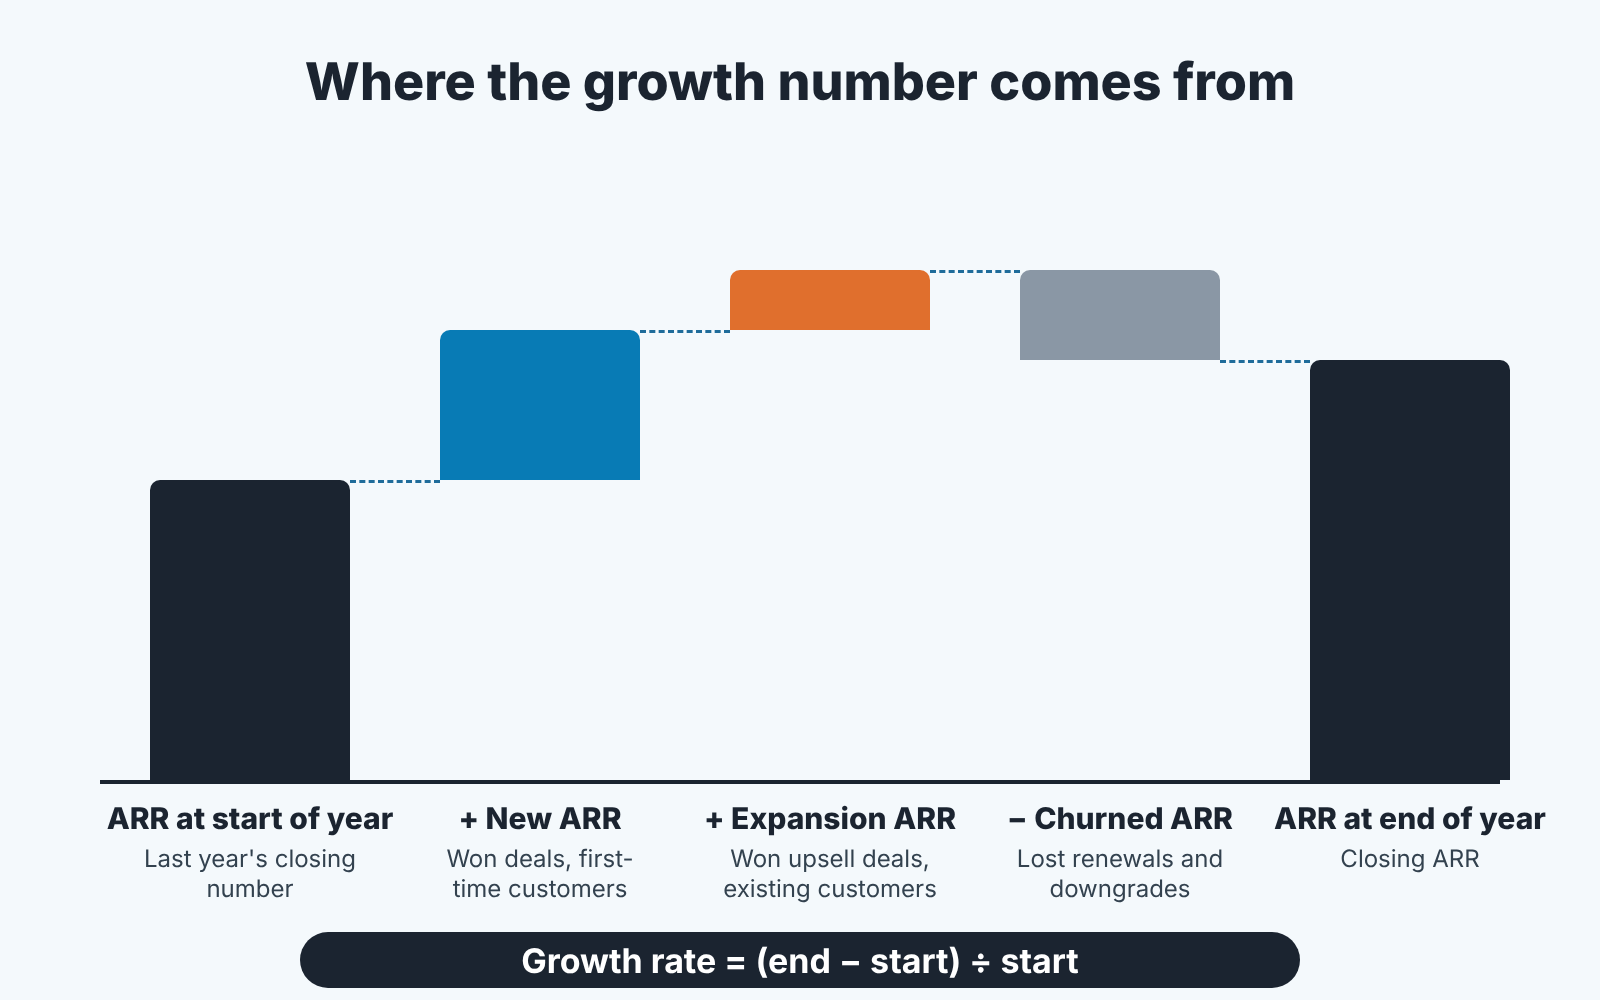
Add the first two piles, subtract the third, and you have net new ARR for the year. Divide it by the ARR you started with. That is the growth rate the formula wants.
One check before you trust it: pick five customers at random and compare what the CRM says they pay per year with what billing says. If three of five disagree, fix the deal values first and calculate later.
A worked example with illustrative numbers
This is an illustrative example. The figures are invented and come from no real company and no benchmark.
Say a subscription business starts the year with $1,000,000 in ARR. Over twelve months the CRM shows $300,000 of new ARR from first-time customers and $80,000 of expansion from existing ones. Lost renewals and downgrades add up to $130,000.
Net new ARR is 300,000 + 80,000 − 130,000 = $250,000. Divided by the starting $1,000,000, growth is 25%.
The accountant reports a 12% EBITDA margin for the same period. The score is 25 + 12 = 37, three points under the bar.
Now look at what those three points would cost on each side. On the margin side, three points means finding $37,500 of extra profit on $1,250,000 of revenue, assuming revenue for the year roughly matches closing ARR. On the growth side, three points means $30,000 more net new ARR. That could be one more mid-sized customer, or keeping two small accounts taht cancelled. In this example the cheapest route to 40 probably runs through the churn pile. You only see that when the three piles are counted separately.
What your sales team can move, and what it cannot
Sales moves the growth half, through the same three piles.
New deals get the most attention in any sales meeting. They depend on pipeline volume, win rate and deal size, and they change slowest because every one of them has to travel the full sales cycle.
Expansion is quicker. Existing customers already trust you, so the cycle is shorter. It needs an owner by name: if nobody has an expansion number in their plan, the pile stays small.
And retention? A renewal call made well ahead of the renewal date is sales work, even when the org chart puts it under customer success.
Margin is mostly outside the team’s reach. Reps influence it through discounting and through the cost of winning a customer, which is why I would read this score next to CAC payback. Hosting, salaries and rent belong to you.
A disclosure, since we are on the question of where these figures come from. We build SalesBond, a sales management layer on top of the CRM a team already uses; Pipedrive was our first integration. SalesBond does not calculate a Rule of 40 score, and I would be wary of any sales tool that claims to, because half of the formula lives in accounting. What it does cover is the raw material for the growth half. The free CRM audit reads the last 30 days of your CRM and sends a PDF with deal health, the pipeline bottleneck, repeat customers and your top-10 clients, then a second PDF seven days later showing what changed. Repeat Sales works out each customer’s buying cycle from their purchases and flags the ones who are overdue against it, which is the list a renewal owner needs. If you want to see how clean your deal data is before you build an ARR bridge on it, check your CRM with SalesBond.
When the rule misleads a small company
I think the Rule of 40 is a poor fit for many small companies. Most of the trouble I see comes from a small base, from project revenue or from owner pay.
Start with the small base. Growth is a ratio, and a ratio on a small starting number swings hard. Take an illustrative company with $200,000 of ARR. One large customer signed there can lift the score by a wide margin, and the the same customer leaving takes all of it away. At that point the score describes one account.
Project revenue is a different problem. An agency or an implementation shop sells work that ends. Last year’s revenue does not repeat by default, so “growth” compares two unrelated sets of projects, and a 40 this year says little about next year. If most of your income is projects, track win rate, revenue per account and margin per project. They will tell you more.
Then there’s owner pay. In a small company the margin shifts depending on how much the owner takes as salary, so two identical businesses can show very different scores for that reason alone.
Even the guides that teach the rule hedge it. Fuelfinance has a section titled “Does the Rule of 40 still apply?” and answers that it does in SaaS, while adding that the metric is not particularly informative on its own (Fuelfinance: Rule of 40). I treat my own score as the start of a conversation about the trade between growth and profit. Put this year’s number next to last year’s before you hold it up against anyone else’s.
FAQ
What is the Rule of 40 in finance?
It is a benchmark that adds a company’s revenue growth rate to its profit margin and checks whether the sum reaches 40%. It is used for software and subscription companies (Recurly).
Should the Rule of 40 use ARR or revenue?
For a subscription company, use ARR built from won deals. Invoiced revenue moves with billing dates, prepayments and setup fees. Whichever you pick, use the same basis every year.
Which companies are included in the Rule of 40 list?
None of the guides we checked publishes a list. Investors run the rule as a screen to compare software companies (Recurly), so any “Rule of 40 list” you find is someone’s own calculation. For your own business the only inputs you need are your ARR at the start and end of the year and your margin.
Can a company with negative growth pass?
On paper, yes. Cube’s example is a company with −5% growth and a 45% margin, which sums to 40 (Cube). Whether a shrinking base can keep that margin for long is a separate question for the owner.