A sales budget for a small B2B team is two plans in one: the revenue you expect to close, and what it will cost you to close it. Build the revenue side backwards from your CRM, using the win rate, sales cycle, average deal size and pipeline coverage you can read off closed deals, then add the cost side (salaries, commission, tools), and check the pair against the live pipeline every month. Done that way, the budget stays in use after January and connects the owner’s number to what the head of sales sees in the pipeline on a Monday.
Everything below assumes a team of two to ten people on one CRM. The arithmetic is the same in Pipedrive, HubSpot, Salesforce or Zoho CRM; field names are only examples.
What a sales budget is, and the two budgets people mix up
A sales budget is the plan for how much revenue the team will close in a period, month by month, and how much the business will spend on selling to get it.
The first part is the revenue budget: what you expect to close, by month, and what pipeline that implies. The second is the cost of selling: salaries, commission, tools and the rest of what you spend to make that revenue happen. They have different owners (the head of sales owns the first, whoever does the books owns the second), different inputs, and they fail in different ways. A revenue budget fails when the pipeline is not there. A cost budget fails when commission scales faster than the revenue it was tied to.
The well-known guides fold both into one sheet. Pipedrive’s walkthrough has seven steps, from choosing the budgeting period to sharing the budget with stakeholders and monitoring it (Pipedrive: sales budget). CaptivateIQ’s has five: budget structure, historic data, revenue forecast, resources, monitoring (CaptivateIQ: sales budget). Both work as a checklist. Neither says where a team of five gets the input numbers.
Keep the two on separate tabs. The one number that has to match across both is the revenue line, because commission, bonus and often the hiring decision hang off it.
Four numbers to pull from your CRM before you touch a spreadsheet
Most budgets start top-down, from last year’s revenue plus a growth percentage; this bottom-up sales budget starts from what your deals actually did. You need four numbers. The first three live in closed deals, so none of them depends on anyone’s opinion; the fourth compares open pipeline with what is left of the target. Pull them over the last twelve months, or four full quarters, so that seasonality is in the sample.
- Win rate. Won deals divided by won plus lost, over the same window. If deal sizes vary a lot, count it by value as well as by count; the two tell different stories. How to pick the window and when a slice gets too thin is in the win rate you can trust.
- Sales cycle. Days from deal creation to won, median not average. One deal that sat for a year will wreck an average. Pipedrive stores the two timestamps as the deal’s add time and won time (Pipedrive API: Deals); HubSpot calls them Create date and Close date (HubSpot: default deal properties). Sales cycle length covers the edge cases.
- Average won deal. Take the median value of won deals (Value in Pipedrive, Amount in HubSpot) and write the biggest won deal of the year next to it. If one deal is a third of the year’s revenue, the budget has a concentration problem before it has a maths problem.
- Pipeline coverage. Open pipeline value divided by the remaining target. You use it to check the budget every month; pipeline coverage ratio has the formula.
Write the four down with their window and the date you pulled them. Twelve months from now you will want to know what you believed when you set the number.
A sales budget example: from the owner’s number to the pipeline that has to exist
Every number in this example is hypothetical, picked to show the arithmetic. Measure your own.
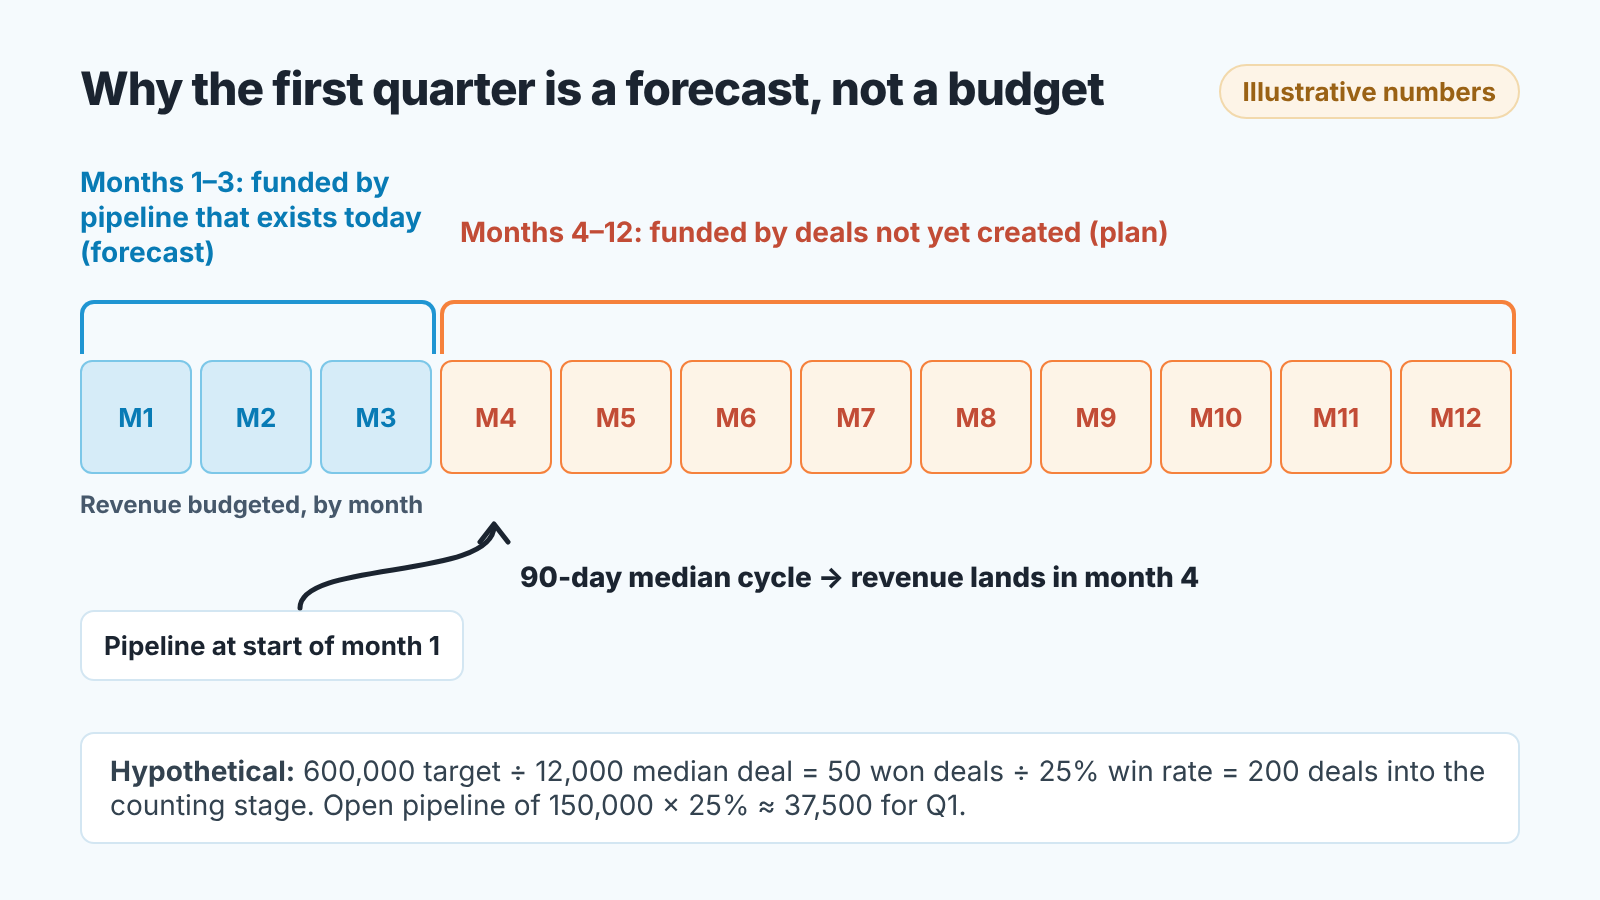
Revenue target ÷ median won deal = won deals needed; won deals ÷ win rate = deals that must reach the counting stage. The counting stage is the stage you measure win rate from, for example the first stage where a proposal is out. With a hypothetical 600,000 target, a 12,000 median deal and a 25% win rate, that is 50 won deals and 200 deals entering the counting stage. Breaking that down into stage counts per rep is a strategy job, and the sales strategy article does it.
The budget adds something the strategy page does not: time.
Say the median cycle is 90 days. A deal that closes in April was, on average, created in January. So the revenue you put in January, February and March has to come from deals that already sit in the CRM today. If the open pipeline in the counting stage is 150,000 and the win rate is 25%, the first quarter can expect something like 37,500 from it, whatever the spreadsheet says Q1 ought to bring. That first slice is a sales forecast. Everything after it is the budget proper: the deals the team still has to create, at the usual win rate and deal size, to fill months four to twelve. Lay it out as twelve rows, and next to each month write the pipeline that must exist at its start to fund the revenue one cycle later.
Two habits here. Use plain deal value, not weighted value, when you multiply by win rate; weighted pipeline already has a probability in it, and applying win rate on top counts it twice. And write the seasonality in: if the last two years show a dead August, the twelve rows should show a dead August too. Same month last year is the simplest comparison for that.
Revenue from existing customers gets its own line: renewals and expansion, with expected churn under it as a minus. It runs on a different calendar from new deals.
Cost of selling: what goes in which column
The cost tab is shorter, and most of it is not in the CRM. Base salaries come from payroll, including the start month and ramp of anyone you plan to hire; they do not move with revenue. Tools (CRM seats, calling, email, data) are mostly priced per seat, so they move with headcount rather than with sales. Everything else, travel, events, outsourced lead gen, is best taken from what you actually paid last year. Commission and bonus are the only line that moves with revenue directly.
Commission is the line that trips teams up because it belongs to both tabs. The clean way is to compute it from the revenue tab with the plan’s actual rules (rate, accelerators, cliffs); a flat percentage will be wrong. If you are not sure your plan survives that, sales commission structures for a small team walks through back-testing it against what last year would have paid.
Headcount is the other decision that lands here. The cost tab does not tell you whether you need a fourth rep; that is a capacity question, and sales capacity planning counts it bottom-up from the CRM. It does tell you what the fourth rep costs in the months before they close anything, which is usually one full cycle plus ramp.
Side by side, the two tabs give the owner the number they care about: cost of selling against the revenue it produces. CAC and LTV from CRM data takes it down to cost per customer.
The monthly check: budget against open pipeline
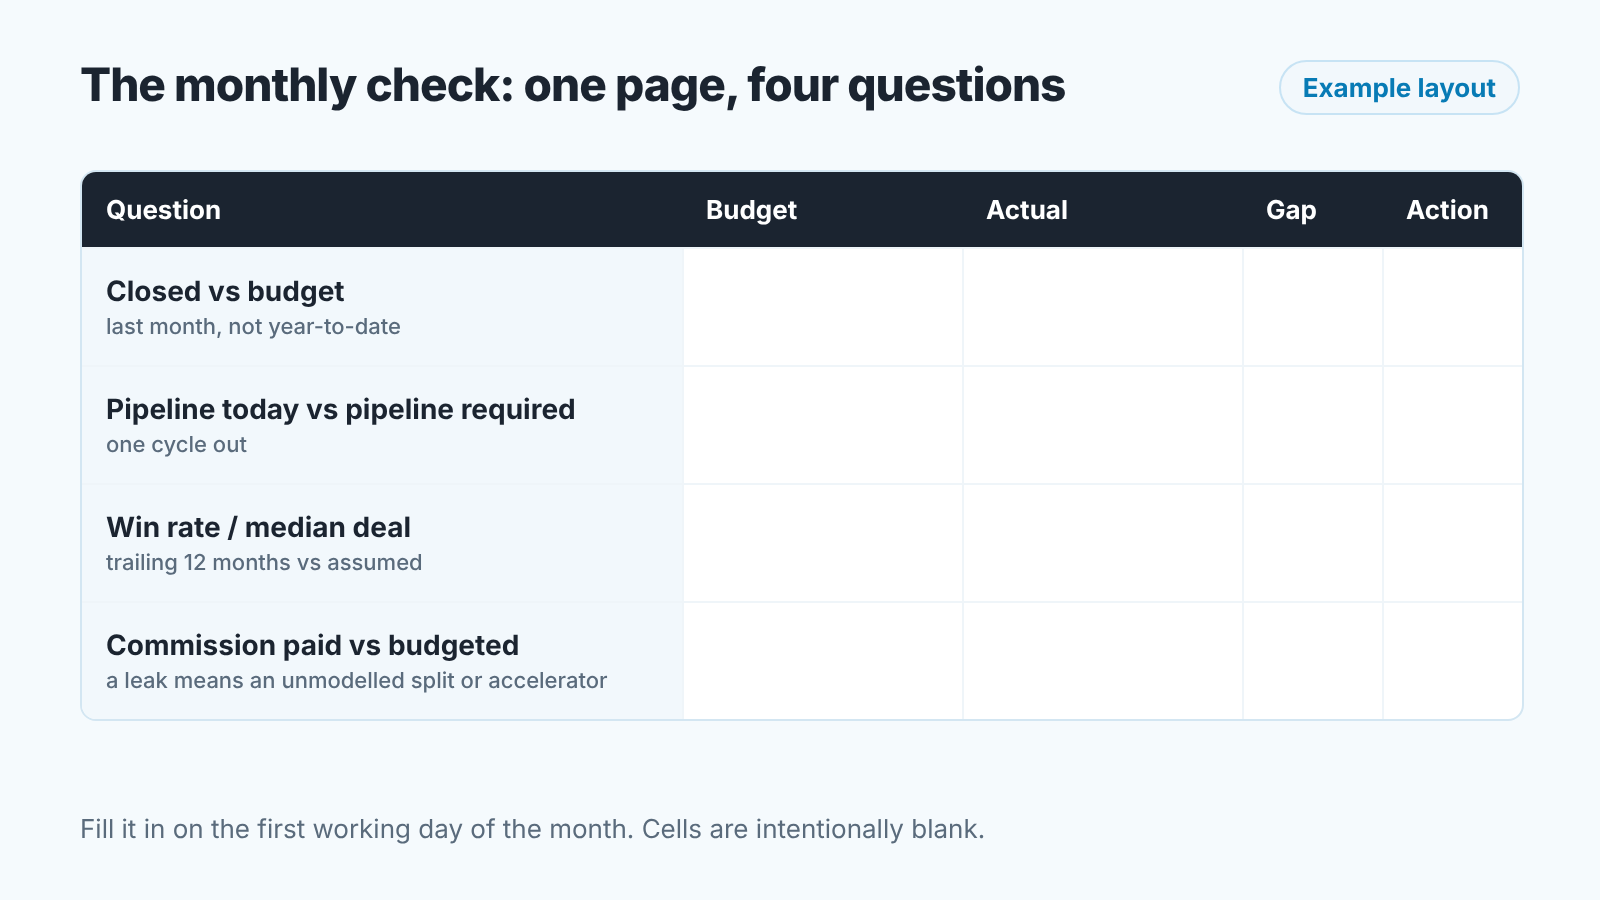
We open ours on the first working day of each month, and the review fits on one page because it asks four questions.
Closed last month against the row for that month. Not against year-to-date, a good March hides a bad February.
Pipeline that exists today against the pipeline the plan said must exist today to fund the revenue one cycle out. This is the coverage check, and it is the one that gives you warning. If you are short in March, the hole shows up in revenue in June, and March is when you can still do something about it.
Win rate and median deal over the trailing twelve months against the numbers you wrote down when you set the budget. When either drifts, the plan rows downstream are wrong, and it is better to re-cut them now than to explain the the miss in December.
Commission paid against commission budgeted. If revenue is on plan and commission is over, the comp plan has a leak, usually a split or an accelerator nobody modelled.
We build SalesBond, a sales management layer on top of the CRM a team already uses; we started with Pipedrive. The monthly one-page check works in a spreadsheet, and that is where we would start it. Before the first check, SalesBond’s free CRM audit reads the last 30 days of your CRM and sends a PDF report with money at risk, deal health and the pipeline bottleneck, then a second PDF seven days later with what changed, which tells you how much of the open pipeline you are counting on is in shape. Check your CRM with SalesBond.
Not enough history? Budget a range
Under about thirty closed deals in the window, the four numbers are noise. That is our rule of thumb, not a statistic: with twenty won-and-lost deals, two lucky closes move the win rate by ten points, and the median deal is whatever the customer in the middle of the list happened to pay.
Say so in the budget. Write the revenue line as a range, with the low end from the worst plausible win rate and deal size you have seen, the high end from the best, and the plan for the middle. In our hypothetical example, an owner would rather see an honest 400,000 to 700,000 than a confident 600,000 that was never grounded.
Don’t fill the gap with industry benchmarks. A “sales cost as a percent of revenue” figure from a benchmark database says nothing about a team of four on a 90-day cycle, and you cannot check how it was collected. Use your own range and shrink it as deals close. After one quarter, recompute the four numbers; the range usually narrows.
One exception. If the team is new but the product is not, closed deals from before the team existed (the founder’s sales, say) still beat an empty window. Mark them in the CRM with a tag or a custom field so you can exclude them later.
Where small-team budgets go wrong
Last year’s revenue plus growth. It is where the budget loses contact with the pipeline. Last year’s number has a one-off in it, or a customer who has since left, or a rep who has since left. Start from won deals, median not total, and the departures and one-offs fall out on thier own.
Counting open deals as revenue. An open deal is a chance at revenue, discounted by win rate and delayed by cycle. The quickest tell is a Q1 revenue row larger than open pipeline times win rate.
Budgeting the cost side on headcount you do not have yet, and the revenue side on reps who are fully ramped from day one. The two tabs should agree on when the new rep starts and when they close their first deal, which is one cycle later at the earliest.
And the quiet one: building the budget once. The four numbers move, and the budget is only as good as the last time someone checked them against the CRM. So before you open a spreadsheet this week, pull the four numbers, date them, and put the first monthly check in the calendar.