
A sales funnel measures how prospects convert from stage to stage over a period; a sales pipeline lists the deals that are open right now, with their value and stage. The funnel tells you where you lose deals, the pipeline tells you what you can still win this quarter.
Most articles frame it as buyer vs seller: the funnel is the buyer’s path and how many people make it through, the pipeline is the stages your reps work. In a CRM that comes down to time. The funnel is a period you look back over, the pipeline is a snapshot of today. Keep that in mind and the rest of this article is about using the split to diagnose your own numbers.
Why funnel and pipeline get confused in a CRM
Open the pipeline view in Pipedrive and you get a board of columns, say Qualified, Demo, Proposal, Negotiation. Wider on the left, thinner on the right. It looks like a funnel, so people call it one. But that board is a pipeline. It shows deals that exist today, sitting in a stage today, and nothing about the ones that already left.
The funnel only shows up when you ask a question about time. How many deals entered Qualified in the last 90 days, and how many of those reached Demo? That lives in a report, not on the board. On a small team the report tends to get opened far less often than the board.
There’s a second reason the words blur. The funnel is wider and starts earlier: it includes the marketing part, the visitors and leads who never became a deal. In Pipedrive that top can include Web Visitors companies, and converting a Web Visitors company into a lead or deal is a step worth a rule of its own. The pipeline starts only when a deal exists. So they aren’t the same thing, and if you’re asking which comes first, the funnel does.
So the word “funnel” gets attached to the picture everyone looks at, and the actual funnel goes unread. A manager says “the funnel looks full” when they mean there are a lot of cards on the board. A rep says “my funnel is fine” when they mean thier win rate hasn’t dropped. Both can be true while the team heads for a bad quarter, and nobody notices because the vocabulary hides which question was answered.
We think the fix is mostly a language habit. When someone says funnel, ask “over what period?” When someone says pipeline, ask “as of when?” If they can’t answer, they’re probably mixing the two.
One deal list, two reports
Conversion rate here means the share of deals that moved from one stage to the next. Take a hypothetical four-person team and read one deal list two ways.
The funnel view looks back over the last 90 days. 120 deals entered Qualified. 60 of them reached Demo, 30 reached Proposal, 18 reached Negotiation and 12 were won. That is 50% from Qualified to Demo, 50% from Demo to Proposal, 60% from Proposal to Negotiation, and two out of three from Negotiation to Won. Overall, 10% of qualified deals closed.
The pipeline view is a snapshot taken this morning:
| Stage | Open deals | Average value | Open value |
|---|---|---|---|
| Qualified | 14 | $6,000 | $84,000 |
| Demo | 9 | $7,000 | $63,000 |
| Proposal | 7 | $8,000 | $56,000 |
| Negotiation | 4 | $10,000 | $40,000 |
| Total | 34 | $243,000 |
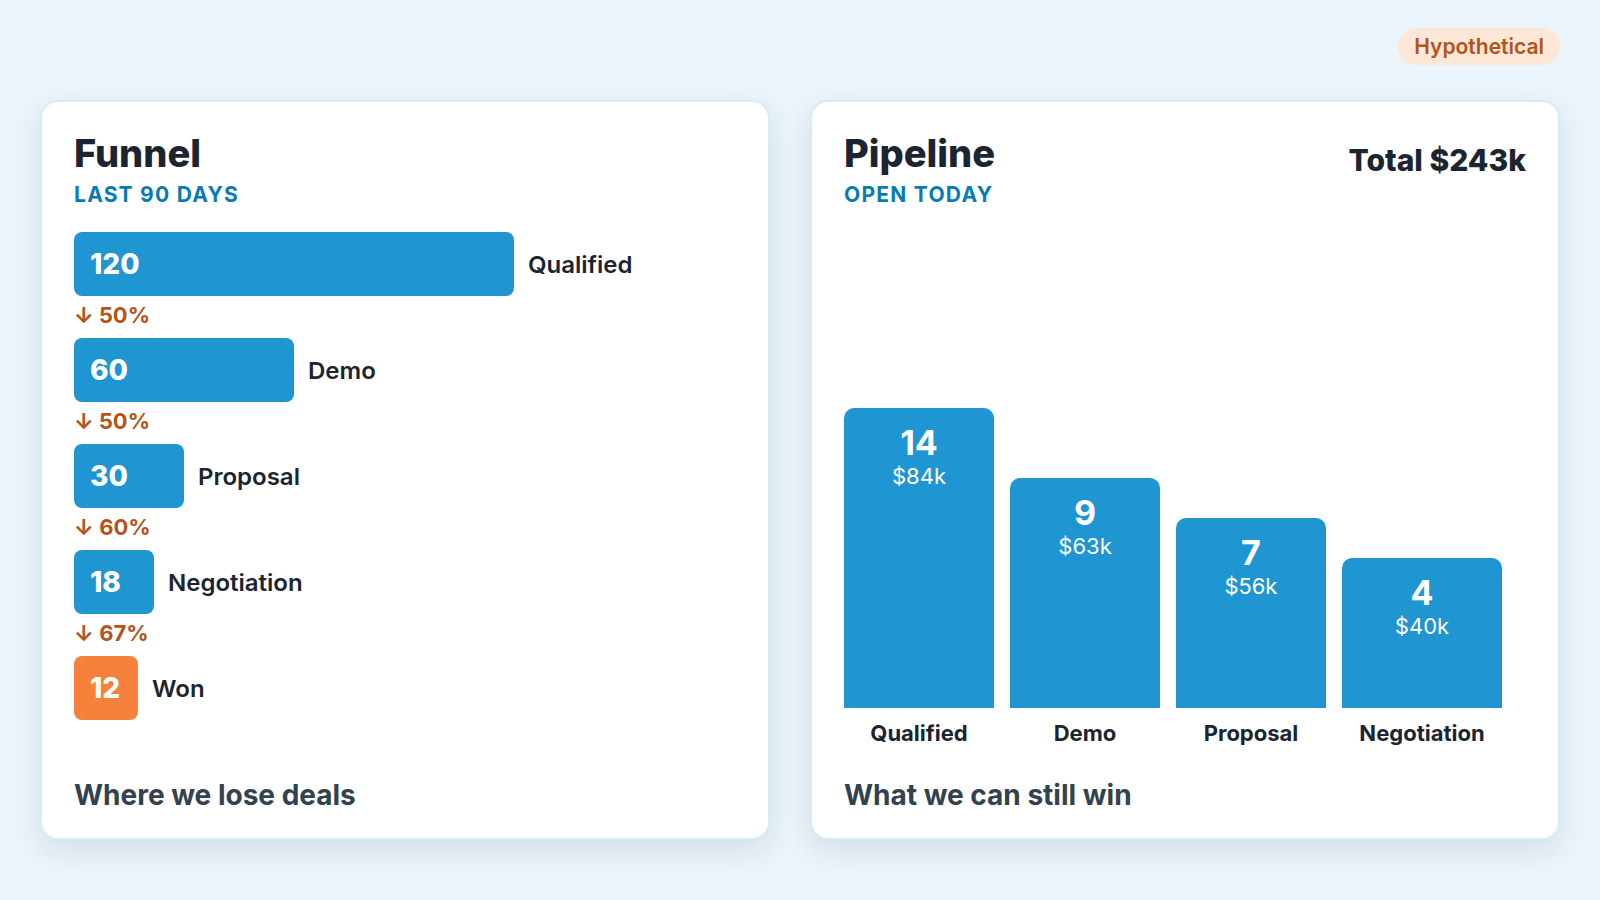
Nothing in the table tells you that half of qualified deals never get a demo. Nothing in the funnel numbers tells you there’s $243,000 in open value or that only four deals are in Negotiation. You need both. They also answer different people: the funnel is for whoever designs the process, the pipeline is for whoever has to close the quarter. Which stages you count at all is a separate choice: the textbook seven steps versus five real stages.
Say the target for the quarter is $120,000. $243,000 open is roughly two times that, which you can read against your own pipeline coverage ratio. Is two times enough? The funnel answers that, because at a 10% overall conversion rate most of the Qualified column will not close.
When the funnel looks healthy and the pipeline is thin
Same team, next quarter. The monthly report comes in and every conversion rate is within a point or two of last quarter. 50%, 50%, 60%, two in three. The manager relaxes.
Then someone opens the board. Only 19 deals are open, down from 34, and open value is under $120,000.
The funnel didn’t lie. Conversion rates are ratios, and ratios stay flat when fewer deals come in at the top. If 22 deals entered Qualified last month instead of the usual 40, every percentage can hold steady while the number of future wins falls by almost half.
Stop tuning the process and look at the input. Count new qualified deals per week for the last eight weeks. If the count is dropping, the problem is prospecting or lead flow and no amount of coaching on demos will fix it. We wrote more about this in the empty pipeline at the start of a quarter.
The reverse: a fat pipeline and a leaking funnel
Now the opposite. The board shows $400,000 in open value, well above anything the team has had before. Everyone feels good.
The funnel report shows why. Proposal to Negotiation dropped from 60% to 25%. Deals go into Proposal and stay there. Open value is high because nothing leaves the column, not because more is being won. Sort the Proposal stage by age and you’ll likely find a block of deals older than your usual sales cycle, still counted at full value.
This time the pipeline is lying by omission and the funnel is the one telling the truth. The fix is a cleanup: go through every Proposal deal with its owner, set a next step with a date or close it as lost. Stalled and dead deals look the same on a board, and the difference matters for the number you report upward.
Which view for which meeting
Monday is for the pipeline. The weekly meeting exists to move open deals, so you want the board: what’s in Negotiation, what has a close date this month, which deals have no next activity, which ones haven’t moved in two weeks. Conversion rates over 90 days change too slowly to act on in a week, and putting them on the screen on Monday turns a working session into a reporting session. If your weekly meeting runs long, a 15-minute weekly pipeline review keeps it on open deals.
The monthly review is for the funnel. Once a month look at conversion between each pair of stages over the last 90 days and compare it with the previous 90. You’re hunting for the one stage where the rate moved. That’s where the next month goes: better qualification if Qualified to Demo dropped, a sharper proposal if Proposal to Negotiation dropped, pricing or approval problems if deals die in Negotiation.
If Qualified to Demo is the rate that dropped, a BANT gate before the Qualified stage is one way to tighten it.
One line to borrow for the next meeting: “This week we talk about deals, once a month we talk about the process.”
What to fix in your stages so both views stay honest
Both views are only as good as the way deals move through stages. A few habits break them quietly.
- Define each stage by something the buyer did, not something the rep did. “Demo held” is checkable. “Rep sent a deck” is not, and it makes the Demo conversion rate meaningless.
- Don’t let deals skip stages without a reason. A deal that jumps from Qualified straight to Negotiation inflates one conversion rate and and skips another.
- Close lost deals as lost, with the stage where they died. A deal left open for months inflates the pipeline and hides the drop-off from the funnel. Not sure where the line is? See when to close a deal as lost.
- Keep close dates and values current, since open value is just the sum of those fields.
How many stages you should have is a separate question, covered in sales pipeline stages. Here the number matters less than the rule: every stage has one clear entry condition, and every deal leaves the board either won or lost. If you want to see the funnel as stages, there are four sales funnel examples mapped to Pipedrive.
A good place to start is this week’s Monday board. Pick the three oldest deals in Proposal and ask their owners for a next step with a date. Whatever doesn’t get one is a candidate for closing as lost, and your funnel report next month will be more honest for it.