

Depreciation is the gradual write-off of what a long-lived asset cost (a van, a machine, a batch of laptops) as an expense across the years it serves the business. It lowers the profit on your report every month, yet no money leaves the account in that month, because the cash went out on the day you bought the asset. Your CRM won’t show it. A CRM records deals and amounts (who bought, how much, when it closed), so depreciation lives only in the ledger.
Corporate Finance Institute describes the same thing as an expense used “to allocate the cost of a tangible asset over its useful life” (CFI: depreciation methods). Patents, trademarks and other intangible assets go through a similar process called amortization, as Xero’s guide puts it (Xero: what is depreciation). Same idea, shorter words. We left this line aside in the articles on EBITDA and operating income for a sales owner. Here it gets its own page, with one example carried all the way through.
A depreciation example: bought once, expensed over four years
Say a six-person company that installs and services equipment buys a used van and a set of tools in January for $12,000. Every number here is illustrative, picked to keep the arithmetic easy, and none comes from a real company. The owner expects four years of use. Its salvage value (what it’ll fetch at the end) is zero.
CFI writes the straight-line formula like this (CFI):
Depreciation Expense = (Cost − Salvage Value) / Useful Life
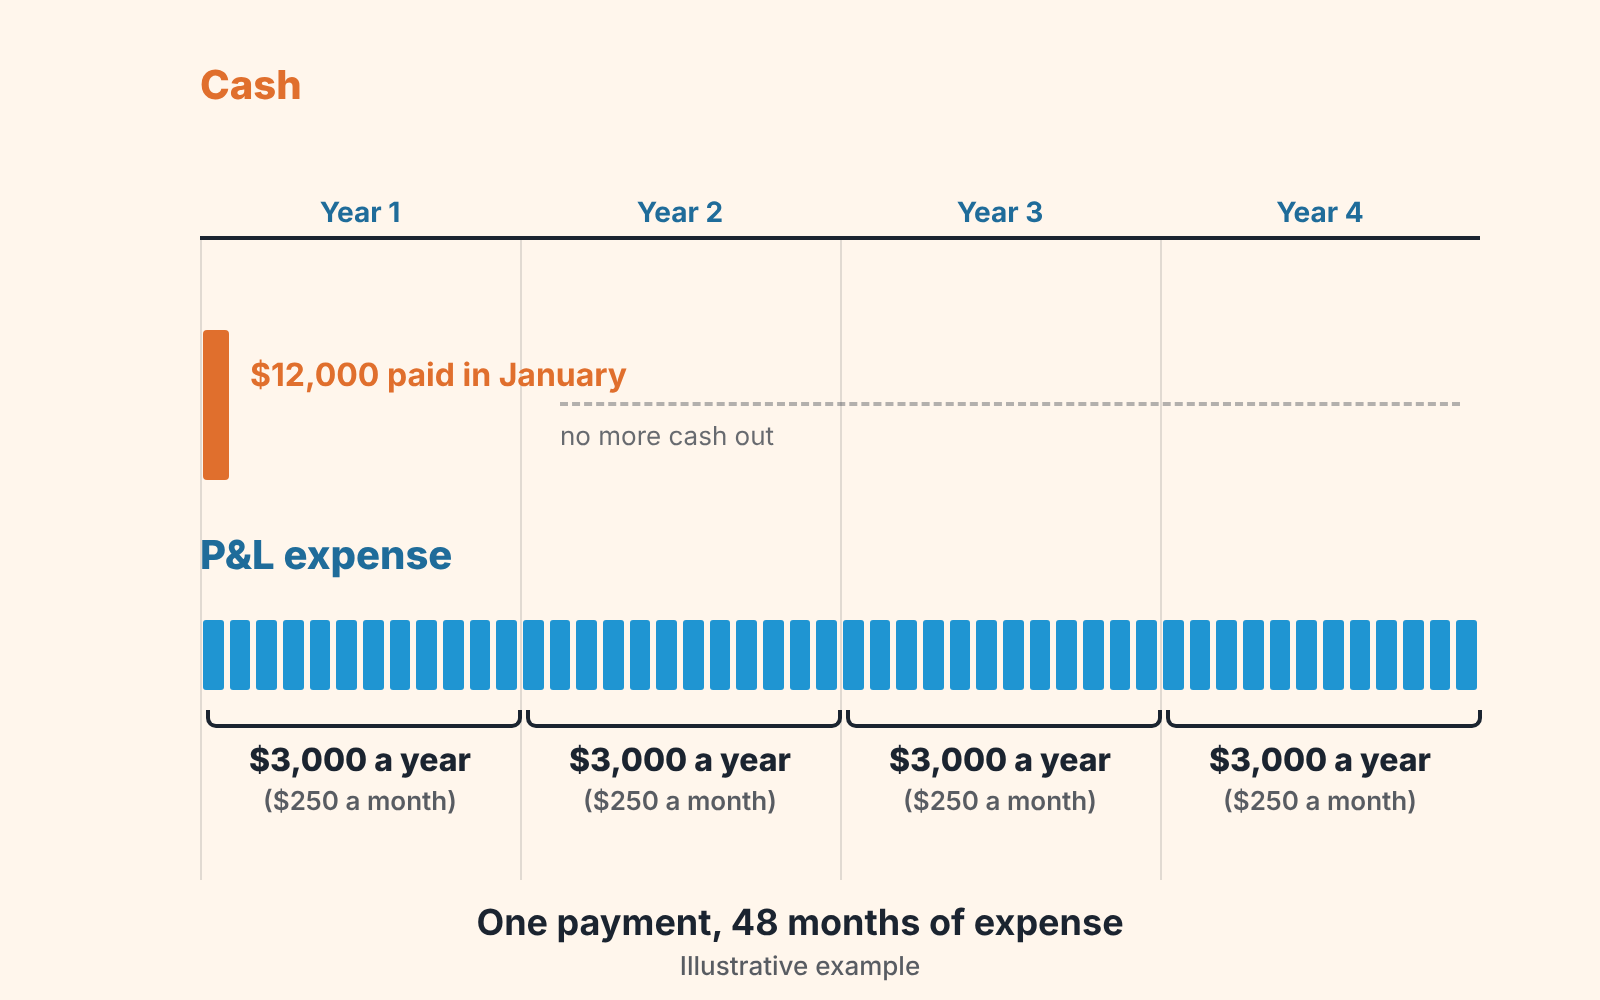
Put the van in and you get ($12,000 − $0) / 4 years = $3,000 a year, or $250 a month. That’s 25% a year. With a four-year life (and no salvage value to subtract) straight-line writes off a quarter of the cost every twelve months. The total written off so far is called accumulated depreciation, and the book value in the last column is the cost minus that total.
| Year | Cash paid for the asset | Depreciation expense on the P&L | Accumulated depreciation | Book value at year end |
|---|---|---|---|---|
| 1 | $12,000 | $3,000 | $3,000 | $9,000 |
| 2 | $0 | $3,000 | $6,000 | $6,000 |
| 3 | $0 | $3,000 | $9,000 | $3,000 |
| 4 | $0 | $3,000 | $12,000 | $0 |
So the cash leaves in a single payment, and the P&L carries a slice of it for 48 months.
Now look at two months side by side. Suppose the team bills $40,000 in each, spends $22,000 on materials and labor for those jobs, and pays $12,000 in salaries and rent. To keep it simple customers pay within the month and so does the company.
| January | February | |
|---|---|---|
| Revenue | $40,000 | $40,000 |
| Job costs and overhead | $34,000 | $34,000 |
| Depreciation | $250 | $250 |
| Profit on the P&L | $5,750 | $5,750 |
| Cash paid for the van and tools | $12,000 | $0 |
| Change in the bank balance | −$6,000 | +$6,000 |
In January the report says the company earned $5,750 while the account dropped by $6,000. In February the report says $5,750 again and the account grew by $6,000. Both documents are correct. Which one would you have trusted if you’d seen only one of them?
Straight-line depreciation and the other methods you’ll hear about
CFI lists four common methods (straight-line, double declining balance, units of production, and sum of years digits) and calls straight-line “a very common, and the simplest, method of calculating depreciation expense” (CFI). Our van uses straight-line, so every period gets the same amount. Double declining balance and other accelerated methods put more of the cost into the early years. Units of production ties the expense to how much the asset was actually used.
An owner rarely picks among them alone. You do own the two inputs under any method: how long the asset will serve, and what it will be worth at the end. Shorten the van’s life from four years to three and the monthly expense goes from $250 to about $333, though you paid exactly the same for it. So ask your bookkeeper one thing this week. Which useful life did they put on each asset, and does it match how long you really keep a van before replacing it? If the books say seven years and you swap vehicles every four, your reported profit has been a little too kind to you for a while.
Why the profit on the report and the money in the bank disagree
Wall Street Prep defines depreciation as a non-cash expense that allocates the purchase of fixed assets (capital expenditures) over their estimated useful life, and treats it as an add-back on the cash flow statement because no real outflow of cash has occurred (Wall Street Prep: depreciation). The January and February table shows that add-back month by month.
Depreciation is only one reason the two numbers split. In a sales-led company the bigger one is usually customers who pay 45 days after the invoice, and we covered that timing in cash vs accrual accounting. The road from a closed-won deal to money you can spend is in the free cash flow article, where the van purchase appears as capital spending.
A common piece of advice says that since depreciation is non-cash, an owner can skip it and watch EBITDA or the bank balance. We disagree. The cash did leave, in one lump, and it will leave again when the van is worn out. Between purchases, the $250 a month is the only place in your reports where that future bill shows up. Ignore it and the next $12,000 lands in a single month with nothing set against it in the 47 before.
What the CRM shows and what only the ledger knows
Open a deal in any CRM and you’ll find an amount, a stage, a close date and an owner. Some teams add thier own cost or margin field. Where would the van go?
| The owner’s question | In the CRM | In the ledger |
|---|---|---|
| What did we sell? | Closed-won deals with amount and close date | Revenue, recognized by your accounting method |
| What did each job cost? | A cost or margin field per deal, if you created one and reps fill it in | Cost of goods sold and operating expenses, from bills and payroll |
| What did we buy to do the work? | Nothing | The asset, recorded at cost |
| How much of it wore out this month? | Nothing | Depreciation expense ($250 in the example) |
| What is it worth on the books today? | Nothing | Book value: cost minus accumulated depreciation |
That last row feeds return on assets, which divides profit by what the company owns.
No CRM calculates depreciation. SalesBond doesn’t either, since it works on top of the CRM and does no accounting or tax math. What it can do is make the CRM column of that table worth comparing with the ledger. The free CRM audit looks at the last 30 days of your connected CRM and sends a PDF report covering money at risk, deal health and what to fix, and a second PDF follows seven days later with what changed. When deal amounts and close dates are unreliable, nobody can explain the gap between the CRM and the P&L. Check your CRM with SalesBond.
Three mistakes when an owner reads margin from deals
You export closed-won deals for the month, add up the margin field and expect the P&L to agree. It won’t, and this is the most frequent mistake. In the example, the deals show $40,000 of revenue and $22,000 of job costs, so the CRM says $18,000 of margin. The P&L says $5,750. Of the $12,250 between them, $12,000 is salaries and rent and $250 is depreciation. In this case depreciation is the small part. Take a second illustrative company with $120,000 of vehicles and machines on the same four-year schedule, and depreciation grows to $2,500 a month that no deal record carries.
Where the expense lands matters too. Wall Street Prep notes that depreciation is embedded in either cost of goods sold or operating expenses on the income statement (Wall Street Prep), so ask your bookkeeper which of the two they chose. The steps from gross to net are in gross profit vs net profit.
The second mistake is treating the number on the tax return as the number that describes your business. Tax depreciation follows its own rules and can write an asset off much faster than it actually wears out, so a year with a big purchase can look far worse on the return than it does on your monthly P&L. If your accountant emails you a tax-basis profit in March, you’d be reading a different number from the one your team earned.
Then there’s pricing. If the van and tools go out on about ten jobs a month, each job uses up roughly $25 of equipment ($250 / 10). A rep who discounts a job down to its materials and labor has sold it at a loss of $25, and the deal still shows a positive margin in the CRM. Put a per-job wear figure into whatever cost field or price floor your reps see. In this example it’s one $25 line in the the quote template.
Where the accountant takes over
Everything above describes the books you use to run the company. The tax return is a separate calculation. As of November 2026, the IRS says in Topic no. 704 that for property placed in service after 1986 you generally must use the Modified Accelerated Cost Recovery System (MACRS), and that you may be able to elect under Section 179 to recover all or part of the cost of qualifying property, up to a dollar limit (IRS: Topic no. 704, Depreciation). The same page points to Publication 946, How to Depreciate Property, for the details.
What assets can be depreciated?
Fixed assets with a useful life of more than one year. Xero’s guide lists tools, machinery, computers, office furniture, vehicles and buildings as common examples, and says land is excluded because it never loses its useful life, and inventory because it’s meant for sale (Xero). For tax purposes, IRS Topic no. 704 adds that the property must be used in a business or income-producing activity (IRS).
Whether a purchase counts as an asset at all starts with the capital expenditure test, which the CapEx vs OpEx guide covers for CRM, laptops and reps.
We won’t turn the tax rules into advice. Limits and elections change, and the right choice depends on your profit, your state and what else you bought this year. Before your next meeting, pull together the list of assets with purchase dates and prices, and write next to each one how long you actually expect to keep it. Hand that to your accountant and ask how the depreciation on the tax return differs from the figure on your monthly P&L.


