
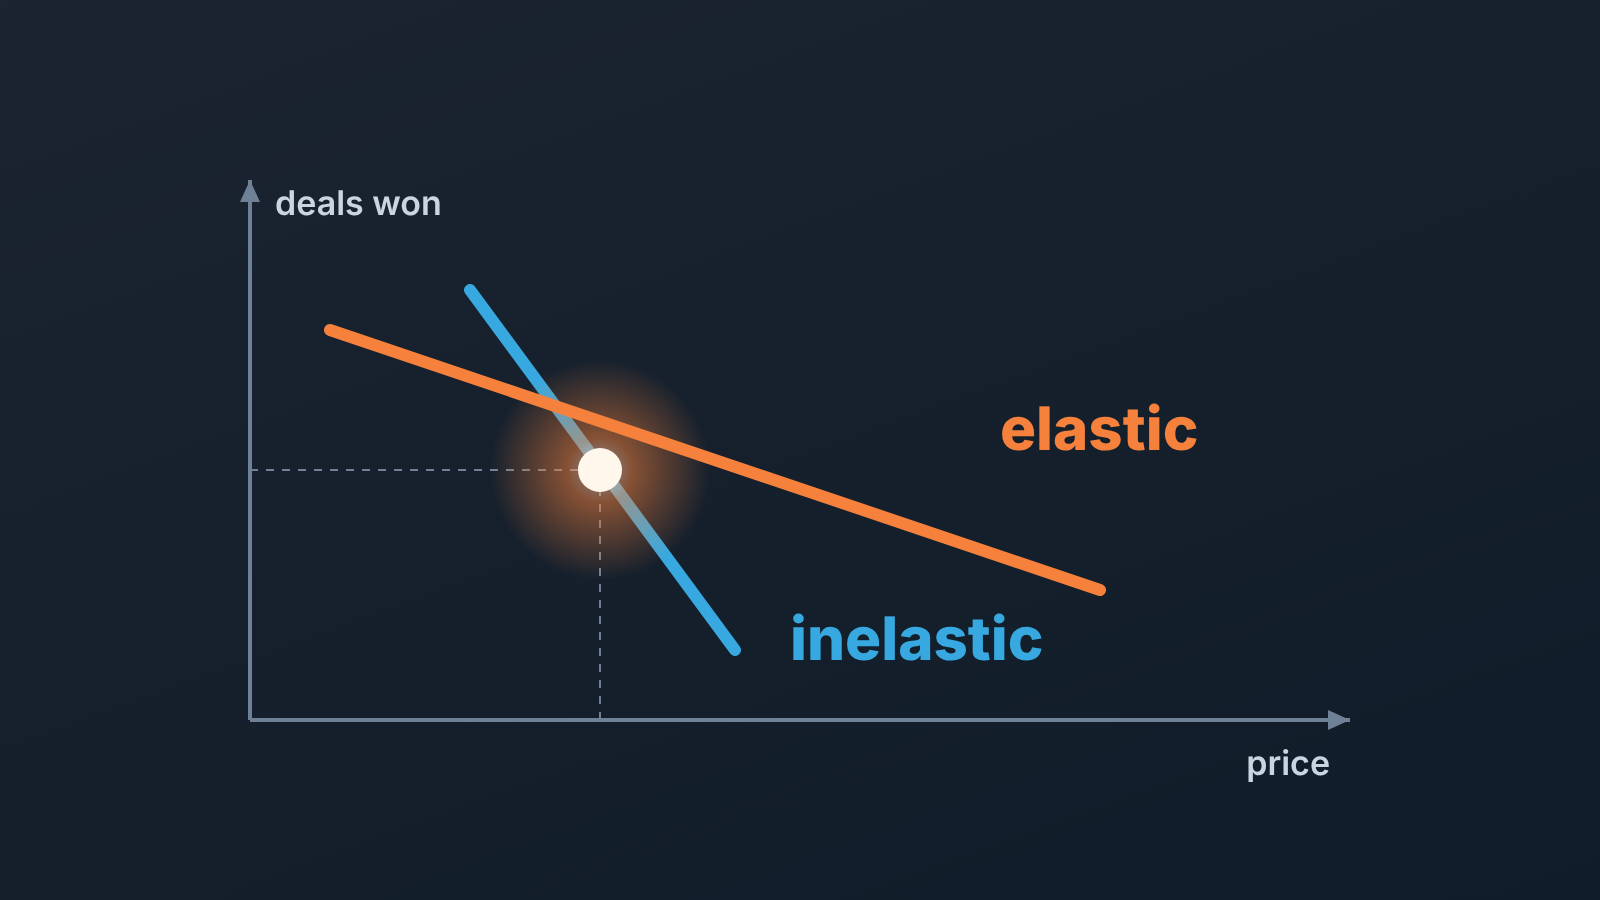
Price elasticity of demand, usually shortened to price elasticity, measures how much the quantity you sell changes when your price changes: the percentage change in volume divided by the percentage change in price. If a 1% price rise cuts volume by more than 1%, demand is elastic; if it cuts volume by less than 1%, demand is inelastic. For a small B2B team, a clean textbook coefficient is out of reach. A rough read of sales elasticity, meaning how win rate responds to the price a rep quotes, comes from its own won and lost deals: group them by discount and compare win rate and deal size across the groups.
Price elasticity in plain words
For a sales team the question behind the term is practical. If we charge more, how many fewer deals do we close, and is that enough to matter?
Conjointly’s guide describes the mechanics (Conjointly, Understanding Price Elasticity of Demand). Raise the price of something with elastic demand and demand drops by proportionally more; raise the price of something inelastic and the drop is proportionally smaller.
For an owner with four reps: when Maria knocks 12% off to win a deal, does that change the buyer’s decision, or only the invoice?
The price elasticity formula and how to read the number
The formula is a ratio of two percentages:
elasticity = (% change in quantity) ÷ (% change in price)
Conjointly prefers the midpoint method, which measures each change against the average of the two values instead of the starting one: quantity change is (Q2 − Q1) ÷ ((Q2 + Q1) ÷ 2), price change is (P2 − P1) ÷ ((P2 + P1) ÷ 2). The point is that the coefficient comes out the same whether the price went up or down (Conjointly). For a rough CRM estimate either version works. Just use the same one every quarter.
Reading the number, per the same guide:
| Coefficient | Name | What it means |
|---|---|---|
| less than −1 (for example −2, or just −1.1) | elastic | a 1% price increase loses you more than 1% of volume |
| close to −1 | unit-elastic | a 1% increase loses about 1% of volume |
| between −1 and 0 | inelastic | a 1% increase loses you less than 1% of volume |
| above 0 | positive | a higher price sells more |
Is −0.5 (often written 0.5) elastic or inelastic? Inelastic: what counts is the absolute value, and below 1 means a 1% price rise loses less than 1% of volume. People drop the minus sign because elasticity is almost always negative, so the rule of thumb is |E| > 1 for elastic and |E| < 1 for inelastic.
The positive case is real, though. Conjointly calls it a common misconception that price and quantity demanded are almost always inversely related; for some buyers a high price signals quality (Conjointly). In B2B that’s the prospect who gets nervous when your quote is half the competitor’s.
The guide’s advice is blunt. Elastic demand often means price low, inelastic usually means price high, and unit-elastic means check margins first. Sales teams need one caveat.
Why sales deals are not a textbook (discounts are a rep’s choice)
The textbook assumes the seller sets a price and the market responds. In a small sales team the seller is Maria, and the price she quotes depends on how the call went.
How a team can set those price rules and approvals is in dynamic pricing rules for a B2B sales team.
Compare a supermarket. Conjointly notes that promotion elasticity is easy to observe from supermarket scan data and that coefficients in the range of −4 to −2 are not uncommon (Conjointly). There the promotion is set centrally and every shopper sees the same shelf tag. In your pipeline the discount goes to the deal the rep thinks needs it. Your 15% discounts are not a random sample of buyers. They are the deals where the rep heard “we are also talking to two other vendors”, or where the champion went quiet after the proposal.
When heavily discounted deals show a higher win rate, two stories fit. Either buyers are price-sensitive and the discount worked, or reps discount the deals they are about to lose, drag some of them back, and the full-price deals were never in doubt. Both stories produce the same table.
So the number you are about to compute measures your team’s discounting habit as much as your buyers, and it is best used to open a conversation with the reps.
A rough estimate from your CRM: discount groups, win rate, deal size
If you have read our piece on win rate by price band, you already have the raw report: deals grouped by list price, discounted versus sold at list. This section does something different with similar data. It groups deals by how deep the discount went, turns the gap into an elasticity coefficient, and then into revenue per ten opportunities, which is the number that decides anything.
You need closed deals, the amount and the discount: either list price next to the final amount, or a discount field. No discount at all? Add the field now; a manager who cannot see discount per deal cannot see pricing. For HubSpot teams, how line items and deal amount carry discounts shows where the number lives.
Pull every deal closed, won and lost, in the last two or three quarters and split them into three groups: no discount, up to 10%, more than 10%. The boundaries are a convention: if your team discounts in 5% and 20% steps, cut where the deals cluster. Keep three groups, sixty closed deals cannot afford six buckets.
For each group compute win rate (won divided by all closed deals in the group) and average won amount. The counting traps are in how to count win rate in Pipedrive, and the logic is the same in any CRM. Then read the groups against each other as if the discount were a price change: no discount is the base price, the heavy-discount group is the lower price, and win rate stands in for quantity.
Here is a price elasticity example from a sales team of four, with made-up numbers:
| Discount group | Closed deals | Won | Win rate | Average won amount |
|---|---|---|---|---|
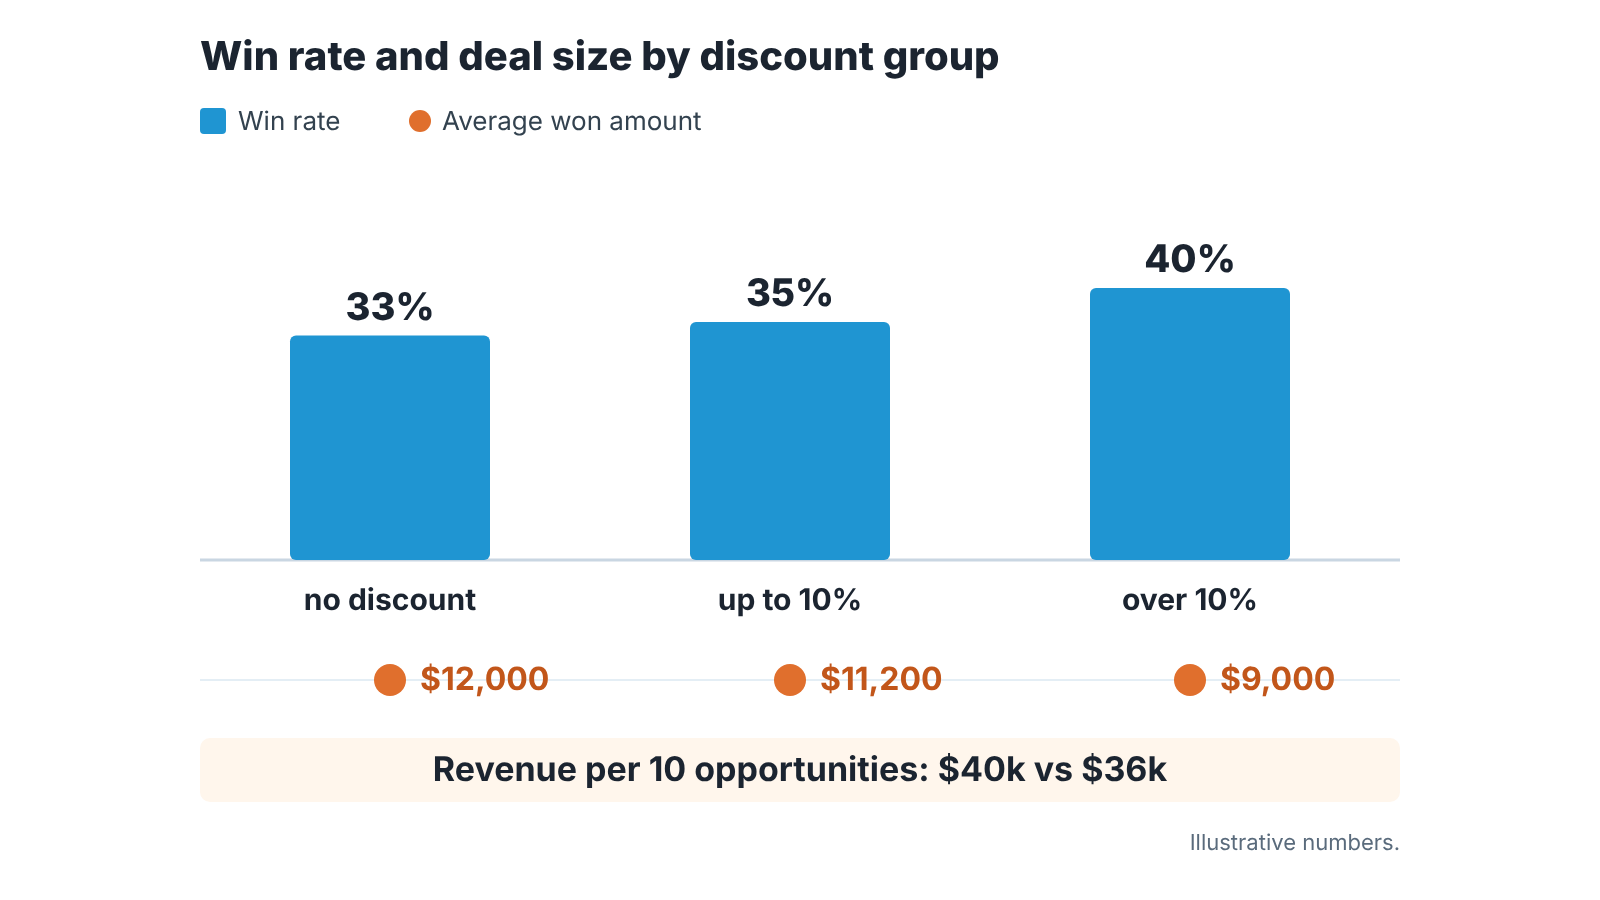
| none | 30 | 10 | 33% | $12,000 |
| up to 10% | 20 | 7 | 35% | $11,200 |
| more than 10% (avg. 15%) | 10 | 4 | 40% | $9,000 |
Price went from 100 to 85, an average 15% discount, so the midpoint price change is −16%. Win rate went from 33% to 40%, a midpoint change of about +18%. Elasticity comes to 18 ÷ −16, about −1.1. On the Conjointly scale that is just inside elastic: buyers respond to the discount, but not by much.
Notice that the average won amount fell by 25%, more than the 15% discount. A 15% cut on $12,000 would give $10,200. The rest is deal size: the heavy-discount deals were smaller to begin with, about $10,600 at list. That’s common, and it is the first sign of the segment problem in the next section.
Now look at the money instead of the coefficient. Ten opportunities at no discount produce about 3.3 wins at $12,000, roughly $40,000. Ten opportunities in the heavy-discount group produce 4 wins at $9,000, which is $36,000. The discount wins an extra deal and still brings in less per ten opportunities. Even if those deals had been full size, 4 wins at $10,200 make $40,800, roughly a wash. That is the sentence you bring to Monday’s meeting, and it took one filter and a spreadsheet.
What the result can and cannot tell you (small samples, segment, rep effect)
An elasticity estimate from a few dozen B2B deals is directional: small samples, segment mix, rep habits and quarter-end pressure all move it.
The heavy-discount group above has ten deals. One more win and its win rate jumps to 50%; one fewer and it drops to 30%. A single deal can swing the coefficient from barely elastic to clearly elastic. We would not change a price list on sixty deals, though sixty deals are enough to change the questions we ask reps.
Segment and season mix in next. If heavy discounts mostly go to mid-market prospects and full-price deals are mostly small companies, you are measuring two different buyers at two different prices and calling the difference elasticity. Split by segment first, then by discount and accept that each cell gets smaller. Quarter-end discounts serve the rep’s quota, and a group full of December deals will look elastic for reasons unrelated to price.
Then the rep. A win rate that rises with discount can mean the discount works, or that one rep closes well and happens to discount alot. The same three groups per rep, even on tiny numbers, usually tell you which. So does the lost-reason field: if heavy-discount losses still say “price”, the discount never reached the real objection. If that field is empty or useless today, see lost reasons in Pipedrive or closed-lost reasons in HubSpot.
What it can tell you: whether discounting in your team goes with winning more at all, and roughly how much deal size you give up per extra win. Enough to decide whether the habit pays for itself. Not enough to find the optimal price.
What to change: discount rules, approval step, price test on one segment
The result points to one of three moves, and none of them is “change the price list”.
If the coefficient came out inelastic (between −1 and 0) and revenue per ten opportunities is higher at full price, the discount is not buying you deals. Tighten the discount rules: a lower default ceiling for reps and a reason required for anything above it. Where the ceiling should sit and who signs off is in a discount policy for small sales teams, and the margin arithmetic behind the approval threshold is in markup vs margin for discount approval. A 15% discount on a deal priced at a 30% margin takes half the margin.
If it came out clearly elastic and the heavy-discount group also brings in more per ten opportunities, buyers do respond to price. The honest next step then is a controlled test rather than more discounting by instinct. Pick one segment, set one lower list price for one quarter, and compare win rate and contribution margin per deal against the same segment at the old price. The win-rate-by-price-band piece linked above has the steps for running it with a small team.
If the numbers are too thin or too mixed to say anything, which is the usual first-pass outcome, make the next pass possible: a list price field next to the amount, discount visible per deal, lost reason mandatory. SalesBond’s free CRM audit reads the last 30 days of the CRM and sends a PDF report with a CRM score and the top findings, a quick way to see how far the deal data is from that state. Come back in two quarters. Unglamorous, and the only version of the the exercise that gets better over time.
A one-page price check
Fill this in once a quarter and keep the old ones:
- Closed deals in the period, and how many fell into each discount group.
- Win rate per group as a fraction (4 of 10), so nobody forgets how thin it is.
- Revenue per ten opportunities per group, with the rough elasticity and the method noted (midpoint or simple).
- Which rep and which segment dominate the heavy-discount group.
- One decision: tighten rules, test a lower price on one segment, or fix the data and wait.
The last line is the one that matters, and it belongs next to the coefficient, with the sample size written beside it.


